

Key Insights
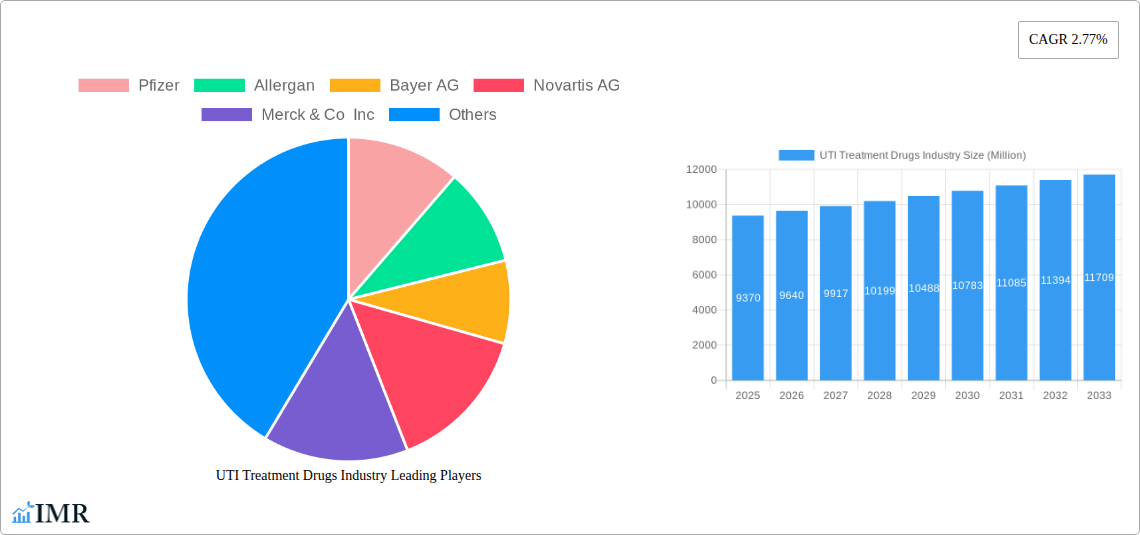
The UTI Treatment Drugs market, valued at $9.37 billion in 2025, is projected to experience steady growth, driven by rising prevalence of urinary tract infections (UTIs), particularly among women and the elderly. The market's Compound Annual Growth Rate (CAGR) of 2.77% from 2019-2033 indicates a consistent expansion, albeit moderate. Key drivers include increasing antibiotic resistance, necessitating the development and adoption of newer treatment options. Furthermore, an aging global population, coupled with improvements in healthcare infrastructure and diagnostic capabilities in developing nations, contribute to market growth. Market segmentation reveals significant demand across various indications, including complicated and uncomplicated UTIs, along with other specific infections like neurogenic bladder infections. The drug landscape is diverse, encompassing penicillins, quinolones, cephalosporins, azoles, nitrofurans, and other classes of antibiotics. Leading pharmaceutical companies such as Pfizer, Allergan, Bayer, and Novartis are major players, competing through product innovation and market penetration strategies. While the market shows promising prospects, challenges remain, including the potential for adverse effects associated with long-term antibiotic use and the continuous evolution of antibiotic-resistant bacteria.
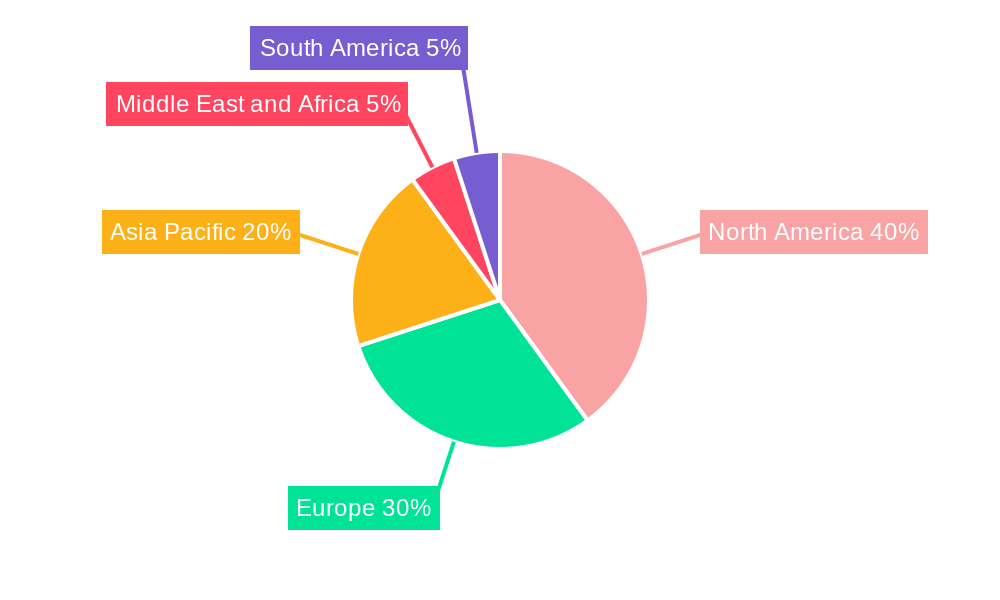
The geographical distribution of the market shows a significant presence across North America and Europe, reflecting higher healthcare expenditure and robust healthcare infrastructure in these regions. However, the Asia Pacific region is poised for significant growth, driven by increasing awareness about UTI treatment, rising disposable incomes, and expanding access to healthcare services. The market's future trajectory will heavily depend on the successful development and commercialization of novel antibiotics to combat growing antibiotic resistance, the expansion of diagnostic capabilities in emerging economies, and the effectiveness of public health initiatives aimed at preventing UTIs. The market will also likely see increased focus on personalized medicine approaches, tailoring treatments to specific patient characteristics and infection types for better efficacy and reduced side effects. Strategic partnerships and mergers and acquisitions are also expected within the industry to further consolidate market share and foster innovation.
UTI Treatment Drugs Industry: A Comprehensive Market Report (2019-2033)
This comprehensive report provides an in-depth analysis of the UTI Treatment Drugs industry, encompassing market dynamics, growth trends, regional performance, product landscape, key players, and future outlook. The study period covers 2019-2033, with 2025 as the base and estimated year. The report leverages extensive data analysis to offer actionable insights for industry professionals, investors, and strategic decision-makers. This report segments the market by Indication (Complicated UTI, Uncomplicated UTI, Other Indications) and Drug (Penicillin and Combinations, Quinolones, Cephalosporin, Azoles and Amphotericin B, Nitrofurans, Other Drugs). The market size is presented in Million units.
UTI Treatment Drugs Industry Market Dynamics & Structure
The UTI Treatment Drugs market is characterized by moderate concentration, with a few major players holding significant market share. Technological innovation, primarily focused on developing novel antibiotics to combat antibiotic resistance, is a key driver. Stringent regulatory frameworks, particularly concerning drug approvals and safety, significantly influence market dynamics. The market also faces competition from alternative treatments, including herbal remedies and lifestyle changes. The end-user demographics are largely skewed towards the elderly population and individuals with compromised immune systems. M&A activity has been relatively modest in recent years, with xx deals recorded between 2019 and 2024, representing a total market value of xx million units.
- Market Concentration: Moderately concentrated, with top 5 players holding approximately xx% market share in 2024.
- Innovation Drivers: Development of novel antibiotics, improved drug delivery systems, personalized medicine approaches.
- Regulatory Landscape: Stringent FDA and EMA approvals, increasing scrutiny on antibiotic resistance.
- Competitive Substitutes: Herbal remedies, lifestyle changes, alternative therapies.
- M&A Activity: xx deals between 2019 and 2024, valued at xx million units.
- Innovation Barriers: High R&D costs, lengthy regulatory approval processes, challenges in combating antibiotic resistance.
UTI Treatment Drugs Industry Growth Trends & Insights
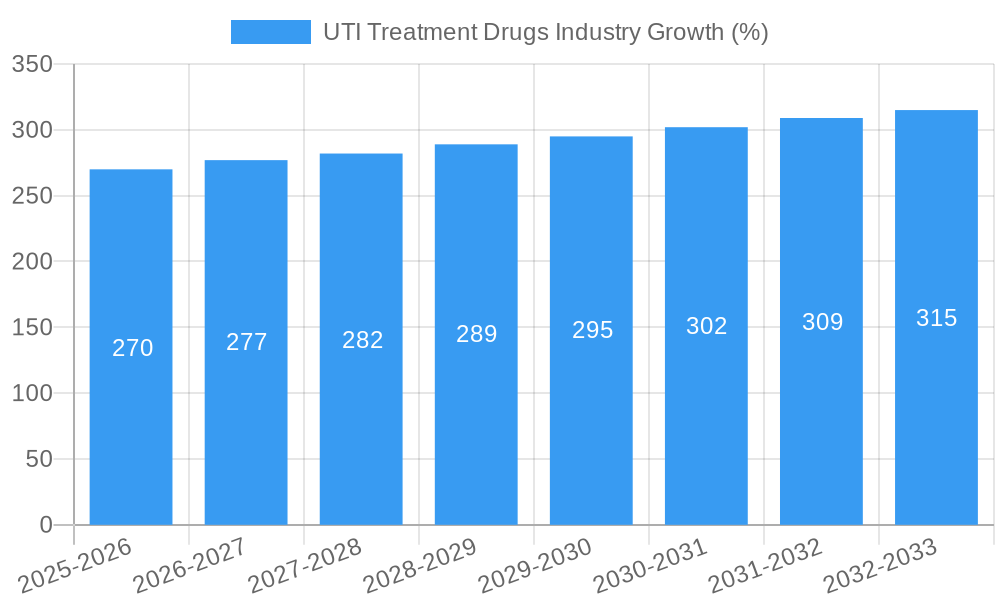
The UTI Treatment Drugs market exhibited a CAGR of xx% during the historical period (2019-2024), reaching a market size of xx million units in 2024. Adoption rates have been driven by increasing prevalence of UTIs, particularly among vulnerable populations. Technological disruptions, such as the development of rapid diagnostic tests and personalized therapies, are expected to further accelerate market growth. Consumer behavior shifts towards increased self-medication and awareness of antibiotic resistance are influencing treatment choices. The market is projected to grow at a CAGR of xx% during the forecast period (2025-2033), reaching xx million units by 2033. Market penetration is expected to increase significantly, driven by factors like improved healthcare infrastructure and access to diagnosis and treatment. The increased prevalence of antibiotic-resistant bacteria is driving the need for innovative treatment options.
Dominant Regions, Countries, or Segments in UTI Treatment Drugs Industry
North America currently holds the largest market share in the UTI Treatment Drugs industry, driven by high healthcare expenditure and a relatively high prevalence of UTIs. Within the indication segments, Uncomplicated UTIs represent the largest market share, followed by Complicated UTIs. The Quinolones segment dominates the drug category, owing to its broad-spectrum efficacy and established market presence.
- Key Drivers: High healthcare expenditure in developed nations, rising prevalence of UTIs, increased awareness, improved diagnostics.
- North America Dominance: Driven by high healthcare expenditure, advanced healthcare infrastructure, and a significant patient pool.
- Uncomplicated UTI Segment: Largest segment due to higher prevalence compared to Complicated UTIs.
- Quinolones Segment: Dominant drug class owing to efficacy and market penetration.
- Growth Potential: Emerging markets in Asia and Africa offer significant growth potential driven by increasing healthcare spending and rising awareness.
UTI Treatment Drugs Industry Product Landscape
The UTI Treatment Drugs market is characterized by a diverse range of products, including oral and intravenous formulations, with advancements in targeted drug delivery and extended-release formulations improving patient compliance and efficacy. New drug development focuses on overcoming antibiotic resistance and minimizing side effects. Unique selling propositions include improved bioavailability, reduced side effects profiles, and enhanced patient compliance. Technological advancements are concentrated in areas such as rapid diagnostics and personalized medicine.
Key Drivers, Barriers & Challenges in UTI Treatment Drugs Industry
Key Drivers: Rising prevalence of UTIs, particularly in aging populations, increased awareness of UTIs, advancements in diagnostic technologies, improved healthcare infrastructure in developing countries.
Challenges & Restraints: The emergence of antibiotic-resistant strains of bacteria poses a significant challenge, limiting the efficacy of existing treatments. High R&D costs associated with developing new antibiotics hinder innovation. Stringent regulatory pathways for drug approvals also impact market entry. Furthermore, pricing pressures and generic competition constrain profitability for many players. Supply chain disruptions and manufacturing complexities can lead to drug shortages and impact availability.
Emerging Opportunities in UTI Treatment Drugs Industry
The development of novel antibiotics to combat antibiotic resistance presents a significant opportunity. Expanding access to diagnostic tools and treatments in underserved populations offers considerable market potential. Furthermore, the development of personalized therapies tailored to specific patient needs and bacterial strains represents a key area for growth. Lastly, improved preventative measures and public health campaigns to raise UTI awareness offer further potential for market expansion.
Growth Accelerators in the UTI Treatment Drugs Industry
Strategic partnerships and collaborations between pharmaceutical companies and research institutions are accelerating innovation in antibiotic development. Technological breakthroughs in rapid diagnostics and targeted drug delivery are enhancing treatment efficacy. Market expansion strategies, focusing on emerging markets and underserved populations, are driving growth. Finally, investments in R&D and clinical trials are creating a pipeline of new and improved UTI treatments.
Key Players Shaping the UTI Treatment Drugs Market
- Pfizer
- Allergan
- Bayer AG
- Novartis AG
- Merck & Co Inc
- Cipla Inc
- Shionogi & Co Ltd
- AstraZeneca
- Almirall SA
- Dr Reddy's Laboratories Ltd
- Bristol-Myers Squibb Company
- GlaxoSmithKline PLC
Notable Milestones in UTI Treatment Drugs Industry Sector
- 2020: FDA approval of a new antibiotic for complicated UTIs.
- 2022: Launch of a rapid diagnostic test for UTIs.
- 2023: Merck & Co. Inc. announces a major investment in antibiotic research and development.
- 2024: Acquisition of a smaller biotech company specializing in UTI treatment by Pfizer.
In-Depth UTI Treatment Drugs Industry Market Outlook
The UTI Treatment Drugs market is poised for significant growth in the coming years, driven by factors such as the rising prevalence of UTIs, advancements in diagnostics and treatments, and expansion into new markets. Strategic partnerships, focused R&D efforts, and innovative product development will shape market dynamics. The long-term outlook is positive, with significant opportunities for companies that can effectively address the challenges of antibiotic resistance and provide effective, accessible treatment options.
UTI Treatment Drugs Industry Segmentation
-
1. Drug
- 1.1. Penicillin and Combinations
- 1.2. Quinolones
- 1.3. Cephalosporin
- 1.4. Azoles and Amphotericin B
- 1.5. Nitrofurans
- 1.6. Other Dr
-
2. Indication
- 2.1. Complicated UTI
- 2.2. Uncomplicated UTI
- 2.3. Other In
UTI Treatment Drugs Industry Segmentation By Geography
-
1. North America
- 1.1. US
- 1.2. Canada
- 1.3. Mexico
-
2. Europe
- 2.1. Germany
- 2.2. UK
- 2.3. France
- 2.4. Italy
- 2.5. Spain
- 2.6. Rest of Europe
-
3. Asia Pacific
- 3.1. China
- 3.2. Japan
- 3.3. India
- 3.4. Australia
- 3.5. South Korea
- 3.6. Rest of Asia Pacific
-
4. Middle East and Africa
- 4.1. GCC
- 4.2. South Africa
- 4.3. Rest of Middle East and Africa
-
5. South America
- 5.1. Brazil
- 5.2. Argentina
- 5.3. Rest of South America
UTI Treatment Drugs Industry REPORT HIGHLIGHTS
| Aspects | Details |
|---|---|
| Study Period | 2019-2033 |
| Base Year | 2024 |
| Estimated Year | 2025 |
| Forecast Period | 2025-2033 |
| Historical Period | 2019-2024 |
| Growth Rate | CAGR of 2.77% from 2019-2033 |
| Segmentation |
|
Table of Contents
- 1. Introduction
- 1.1. Research Scope
- 1.2. Market Segmentation
- 1.3. Research Methodology
- 1.4. Definitions and Assumptions
- 2. Executive Summary
- 2.1. Introduction
- 3. Market Dynamics
- 3.1. Introduction
- 3.2. Market Drivers
- 3.2.1. Increasing Prevalence of Diabetes and Kidney Stones; Launch of Combination Drugs
- 3.3. Market Restrains
- 3.3.1. Adverse Effects Associated with the Use of Medication; Lack of Awareness in Developing and Underdeveloped Countries
- 3.4. Market Trends
- 3.4.1. Complicated UTIs Segment Expected to Hold a Major Share in the Urinary Tract Infection Therapeutics Market
- 4. Market Factor Analysis
- 4.1. Porters Five Forces
- 4.2. Supply/Value Chain
- 4.3. PESTEL analysis
- 4.4. Market Entropy
- 4.5. Patent/Trademark Analysis
- 5. Global UTI Treatment Drugs Industry Analysis, Insights and Forecast, 2019-2031
- 5.1. Market Analysis, Insights and Forecast - by Drug
- 5.1.1. Penicillin and Combinations
- 5.1.2. Quinolones
- 5.1.3. Cephalosporin
- 5.1.4. Azoles and Amphotericin B
- 5.1.5. Nitrofurans
- 5.1.6. Other Dr
- 5.2. Market Analysis, Insights and Forecast - by Indication
- 5.2.1. Complicated UTI
- 5.2.2. Uncomplicated UTI
- 5.2.3. Other In
- 5.3. Market Analysis, Insights and Forecast - by Region
- 5.3.1. North America
- 5.3.2. Europe
- 5.3.3. Asia Pacific
- 5.3.4. Middle East and Africa
- 5.3.5. South America
- 5.1. Market Analysis, Insights and Forecast - by Drug
- 6. North America UTI Treatment Drugs Industry Analysis, Insights and Forecast, 2019-2031
- 6.1. Market Analysis, Insights and Forecast - by Drug
- 6.1.1. Penicillin and Combinations
- 6.1.2. Quinolones
- 6.1.3. Cephalosporin
- 6.1.4. Azoles and Amphotericin B
- 6.1.5. Nitrofurans
- 6.1.6. Other Dr
- 6.2. Market Analysis, Insights and Forecast - by Indication
- 6.2.1. Complicated UTI
- 6.2.2. Uncomplicated UTI
- 6.2.3. Other In
- 6.1. Market Analysis, Insights and Forecast - by Drug
- 7. Europe UTI Treatment Drugs Industry Analysis, Insights and Forecast, 2019-2031
- 7.1. Market Analysis, Insights and Forecast - by Drug
- 7.1.1. Penicillin and Combinations
- 7.1.2. Quinolones
- 7.1.3. Cephalosporin
- 7.1.4. Azoles and Amphotericin B
- 7.1.5. Nitrofurans
- 7.1.6. Other Dr
- 7.2. Market Analysis, Insights and Forecast - by Indication
- 7.2.1. Complicated UTI
- 7.2.2. Uncomplicated UTI
- 7.2.3. Other In
- 7.1. Market Analysis, Insights and Forecast - by Drug
- 8. Asia Pacific UTI Treatment Drugs Industry Analysis, Insights and Forecast, 2019-2031
- 8.1. Market Analysis, Insights and Forecast - by Drug
- 8.1.1. Penicillin and Combinations
- 8.1.2. Quinolones
- 8.1.3. Cephalosporin
- 8.1.4. Azoles and Amphotericin B
- 8.1.5. Nitrofurans
- 8.1.6. Other Dr
- 8.2. Market Analysis, Insights and Forecast - by Indication
- 8.2.1. Complicated UTI
- 8.2.2. Uncomplicated UTI
- 8.2.3. Other In
- 8.1. Market Analysis, Insights and Forecast - by Drug
- 9. Middle East and Africa UTI Treatment Drugs Industry Analysis, Insights and Forecast, 2019-2031
- 9.1. Market Analysis, Insights and Forecast - by Drug
- 9.1.1. Penicillin and Combinations
- 9.1.2. Quinolones
- 9.1.3. Cephalosporin
- 9.1.4. Azoles and Amphotericin B
- 9.1.5. Nitrofurans
- 9.1.6. Other Dr
- 9.2. Market Analysis, Insights and Forecast - by Indication
- 9.2.1. Complicated UTI
- 9.2.2. Uncomplicated UTI
- 9.2.3. Other In
- 9.1. Market Analysis, Insights and Forecast - by Drug
- 10. South America UTI Treatment Drugs Industry Analysis, Insights and Forecast, 2019-2031
- 10.1. Market Analysis, Insights and Forecast - by Drug
- 10.1.1. Penicillin and Combinations
- 10.1.2. Quinolones
- 10.1.3. Cephalosporin
- 10.1.4. Azoles and Amphotericin B
- 10.1.5. Nitrofurans
- 10.1.6. Other Dr
- 10.2. Market Analysis, Insights and Forecast - by Indication
- 10.2.1. Complicated UTI
- 10.2.2. Uncomplicated UTI
- 10.2.3. Other In
- 10.1. Market Analysis, Insights and Forecast - by Drug
- 11. North America UTI Treatment Drugs Industry Analysis, Insights and Forecast, 2019-2031
- 11.1. Market Analysis, Insights and Forecast - By Country/Sub-region
- 11.1.1. undefined
- 12. Europe UTI Treatment Drugs Industry Analysis, Insights and Forecast, 2019-2031
- 12.1. Market Analysis, Insights and Forecast - By Country/Sub-region
- 12.1.1. undefined
- 13. Asia Pacifi UTI Treatment Drugs Industry Analysis, Insights and Forecast, 2019-2031
- 13.1. Market Analysis, Insights and Forecast - By Country/Sub-region
- 13.1.1. undefined
- 14. Middle East and Africa UTI Treatment Drugs Industry Analysis, Insights and Forecast, 2019-2031
- 14.1. Market Analysis, Insights and Forecast - By Country/Sub-region
- 14.1.1. undefined
- 15. South America UTI Treatment Drugs Industry Analysis, Insights and Forecast, 2019-2031
- 15.1. Market Analysis, Insights and Forecast - By Country/Sub-region
- 15.1.1. undefined
- 16. Competitive Analysis
- 16.1. Global Market Share Analysis 2024
- 16.2. Company Profiles
- 16.2.1 Pfizer
- 16.2.1.1. Overview
- 16.2.1.2. Products
- 16.2.1.3. SWOT Analysis
- 16.2.1.4. Recent Developments
- 16.2.1.5. Financials (Based on Availability)
- 16.2.2 Allergan
- 16.2.2.1. Overview
- 16.2.2.2. Products
- 16.2.2.3. SWOT Analysis
- 16.2.2.4. Recent Developments
- 16.2.2.5. Financials (Based on Availability)
- 16.2.3 Bayer AG
- 16.2.3.1. Overview
- 16.2.3.2. Products
- 16.2.3.3. SWOT Analysis
- 16.2.3.4. Recent Developments
- 16.2.3.5. Financials (Based on Availability)
- 16.2.4 Novartis AG
- 16.2.4.1. Overview
- 16.2.4.2. Products
- 16.2.4.3. SWOT Analysis
- 16.2.4.4. Recent Developments
- 16.2.4.5. Financials (Based on Availability)
- 16.2.5 Merck & Co Inc
- 16.2.5.1. Overview
- 16.2.5.2. Products
- 16.2.5.3. SWOT Analysis
- 16.2.5.4. Recent Developments
- 16.2.5.5. Financials (Based on Availability)
- 16.2.6 Cipla Inc
- 16.2.6.1. Overview
- 16.2.6.2. Products
- 16.2.6.3. SWOT Analysis
- 16.2.6.4. Recent Developments
- 16.2.6.5. Financials (Based on Availability)
- 16.2.7 Shionogi & Co Ltd
- 16.2.7.1. Overview
- 16.2.7.2. Products
- 16.2.7.3. SWOT Analysis
- 16.2.7.4. Recent Developments
- 16.2.7.5. Financials (Based on Availability)
- 16.2.8 AstraZeneca
- 16.2.8.1. Overview
- 16.2.8.2. Products
- 16.2.8.3. SWOT Analysis
- 16.2.8.4. Recent Developments
- 16.2.8.5. Financials (Based on Availability)
- 16.2.9 Almirall SA
- 16.2.9.1. Overview
- 16.2.9.2. Products
- 16.2.9.3. SWOT Analysis
- 16.2.9.4. Recent Developments
- 16.2.9.5. Financials (Based on Availability)
- 16.2.10 Dr Reddys Laboratories Ltd
- 16.2.10.1. Overview
- 16.2.10.2. Products
- 16.2.10.3. SWOT Analysis
- 16.2.10.4. Recent Developments
- 16.2.10.5. Financials (Based on Availability)
- 16.2.11 Bristol-Myers Squibb Company
- 16.2.11.1. Overview
- 16.2.11.2. Products
- 16.2.11.3. SWOT Analysis
- 16.2.11.4. Recent Developments
- 16.2.11.5. Financials (Based on Availability)
- 16.2.12 GlaxoSmithKline PLC
- 16.2.12.1. Overview
- 16.2.12.2. Products
- 16.2.12.3. SWOT Analysis
- 16.2.12.4. Recent Developments
- 16.2.12.5. Financials (Based on Availability)
- 16.2.1 Pfizer
List of Figures
- Figure 1: Global UTI Treatment Drugs Industry Revenue Breakdown (Million, %) by Region 2024 & 2032
- Figure 2: Global UTI Treatment Drugs Industry Volume Breakdown (K Unit, %) by Region 2024 & 2032
- Figure 3: North America UTI Treatment Drugs Industry Revenue (Million), by Country 2024 & 2032
- Figure 4: North America UTI Treatment Drugs Industry Volume (K Unit), by Country 2024 & 2032
- Figure 5: North America UTI Treatment Drugs Industry Revenue Share (%), by Country 2024 & 2032
- Figure 6: North America UTI Treatment Drugs Industry Volume Share (%), by Country 2024 & 2032
- Figure 7: Europe UTI Treatment Drugs Industry Revenue (Million), by Country 2024 & 2032
- Figure 8: Europe UTI Treatment Drugs Industry Volume (K Unit), by Country 2024 & 2032
- Figure 9: Europe UTI Treatment Drugs Industry Revenue Share (%), by Country 2024 & 2032
- Figure 10: Europe UTI Treatment Drugs Industry Volume Share (%), by Country 2024 & 2032
- Figure 11: Asia Pacifi UTI Treatment Drugs Industry Revenue (Million), by Country 2024 & 2032
- Figure 12: Asia Pacifi UTI Treatment Drugs Industry Volume (K Unit), by Country 2024 & 2032
- Figure 13: Asia Pacifi UTI Treatment Drugs Industry Revenue Share (%), by Country 2024 & 2032
- Figure 14: Asia Pacifi UTI Treatment Drugs Industry Volume Share (%), by Country 2024 & 2032
- Figure 15: Middle East and Africa UTI Treatment Drugs Industry Revenue (Million), by Country 2024 & 2032
- Figure 16: Middle East and Africa UTI Treatment Drugs Industry Volume (K Unit), by Country 2024 & 2032
- Figure 17: Middle East and Africa UTI Treatment Drugs Industry Revenue Share (%), by Country 2024 & 2032
- Figure 18: Middle East and Africa UTI Treatment Drugs Industry Volume Share (%), by Country 2024 & 2032
- Figure 19: South America UTI Treatment Drugs Industry Revenue (Million), by Country 2024 & 2032
- Figure 20: South America UTI Treatment Drugs Industry Volume (K Unit), by Country 2024 & 2032
- Figure 21: South America UTI Treatment Drugs Industry Revenue Share (%), by Country 2024 & 2032
- Figure 22: South America UTI Treatment Drugs Industry Volume Share (%), by Country 2024 & 2032
- Figure 23: North America UTI Treatment Drugs Industry Revenue (Million), by Drug 2024 & 2032
- Figure 24: North America UTI Treatment Drugs Industry Volume (K Unit), by Drug 2024 & 2032
- Figure 25: North America UTI Treatment Drugs Industry Revenue Share (%), by Drug 2024 & 2032
- Figure 26: North America UTI Treatment Drugs Industry Volume Share (%), by Drug 2024 & 2032
- Figure 27: North America UTI Treatment Drugs Industry Revenue (Million), by Indication 2024 & 2032
- Figure 28: North America UTI Treatment Drugs Industry Volume (K Unit), by Indication 2024 & 2032
- Figure 29: North America UTI Treatment Drugs Industry Revenue Share (%), by Indication 2024 & 2032
- Figure 30: North America UTI Treatment Drugs Industry Volume Share (%), by Indication 2024 & 2032
- Figure 31: North America UTI Treatment Drugs Industry Revenue (Million), by Country 2024 & 2032
- Figure 32: North America UTI Treatment Drugs Industry Volume (K Unit), by Country 2024 & 2032
- Figure 33: North America UTI Treatment Drugs Industry Revenue Share (%), by Country 2024 & 2032
- Figure 34: North America UTI Treatment Drugs Industry Volume Share (%), by Country 2024 & 2032
- Figure 35: Europe UTI Treatment Drugs Industry Revenue (Million), by Drug 2024 & 2032
- Figure 36: Europe UTI Treatment Drugs Industry Volume (K Unit), by Drug 2024 & 2032
- Figure 37: Europe UTI Treatment Drugs Industry Revenue Share (%), by Drug 2024 & 2032
- Figure 38: Europe UTI Treatment Drugs Industry Volume Share (%), by Drug 2024 & 2032
- Figure 39: Europe UTI Treatment Drugs Industry Revenue (Million), by Indication 2024 & 2032
- Figure 40: Europe UTI Treatment Drugs Industry Volume (K Unit), by Indication 2024 & 2032
- Figure 41: Europe UTI Treatment Drugs Industry Revenue Share (%), by Indication 2024 & 2032
- Figure 42: Europe UTI Treatment Drugs Industry Volume Share (%), by Indication 2024 & 2032
- Figure 43: Europe UTI Treatment Drugs Industry Revenue (Million), by Country 2024 & 2032
- Figure 44: Europe UTI Treatment Drugs Industry Volume (K Unit), by Country 2024 & 2032
- Figure 45: Europe UTI Treatment Drugs Industry Revenue Share (%), by Country 2024 & 2032
- Figure 46: Europe UTI Treatment Drugs Industry Volume Share (%), by Country 2024 & 2032
- Figure 47: Asia Pacific UTI Treatment Drugs Industry Revenue (Million), by Drug 2024 & 2032
- Figure 48: Asia Pacific UTI Treatment Drugs Industry Volume (K Unit), by Drug 2024 & 2032
- Figure 49: Asia Pacific UTI Treatment Drugs Industry Revenue Share (%), by Drug 2024 & 2032
- Figure 50: Asia Pacific UTI Treatment Drugs Industry Volume Share (%), by Drug 2024 & 2032
- Figure 51: Asia Pacific UTI Treatment Drugs Industry Revenue (Million), by Indication 2024 & 2032
- Figure 52: Asia Pacific UTI Treatment Drugs Industry Volume (K Unit), by Indication 2024 & 2032
- Figure 53: Asia Pacific UTI Treatment Drugs Industry Revenue Share (%), by Indication 2024 & 2032
- Figure 54: Asia Pacific UTI Treatment Drugs Industry Volume Share (%), by Indication 2024 & 2032
- Figure 55: Asia Pacific UTI Treatment Drugs Industry Revenue (Million), by Country 2024 & 2032
- Figure 56: Asia Pacific UTI Treatment Drugs Industry Volume (K Unit), by Country 2024 & 2032
- Figure 57: Asia Pacific UTI Treatment Drugs Industry Revenue Share (%), by Country 2024 & 2032
- Figure 58: Asia Pacific UTI Treatment Drugs Industry Volume Share (%), by Country 2024 & 2032
- Figure 59: Middle East and Africa UTI Treatment Drugs Industry Revenue (Million), by Drug 2024 & 2032
- Figure 60: Middle East and Africa UTI Treatment Drugs Industry Volume (K Unit), by Drug 2024 & 2032
- Figure 61: Middle East and Africa UTI Treatment Drugs Industry Revenue Share (%), by Drug 2024 & 2032
- Figure 62: Middle East and Africa UTI Treatment Drugs Industry Volume Share (%), by Drug 2024 & 2032
- Figure 63: Middle East and Africa UTI Treatment Drugs Industry Revenue (Million), by Indication 2024 & 2032
- Figure 64: Middle East and Africa UTI Treatment Drugs Industry Volume (K Unit), by Indication 2024 & 2032
- Figure 65: Middle East and Africa UTI Treatment Drugs Industry Revenue Share (%), by Indication 2024 & 2032
- Figure 66: Middle East and Africa UTI Treatment Drugs Industry Volume Share (%), by Indication 2024 & 2032
- Figure 67: Middle East and Africa UTI Treatment Drugs Industry Revenue (Million), by Country 2024 & 2032
- Figure 68: Middle East and Africa UTI Treatment Drugs Industry Volume (K Unit), by Country 2024 & 2032
- Figure 69: Middle East and Africa UTI Treatment Drugs Industry Revenue Share (%), by Country 2024 & 2032
- Figure 70: Middle East and Africa UTI Treatment Drugs Industry Volume Share (%), by Country 2024 & 2032
- Figure 71: South America UTI Treatment Drugs Industry Revenue (Million), by Drug 2024 & 2032
- Figure 72: South America UTI Treatment Drugs Industry Volume (K Unit), by Drug 2024 & 2032
- Figure 73: South America UTI Treatment Drugs Industry Revenue Share (%), by Drug 2024 & 2032
- Figure 74: South America UTI Treatment Drugs Industry Volume Share (%), by Drug 2024 & 2032
- Figure 75: South America UTI Treatment Drugs Industry Revenue (Million), by Indication 2024 & 2032
- Figure 76: South America UTI Treatment Drugs Industry Volume (K Unit), by Indication 2024 & 2032
- Figure 77: South America UTI Treatment Drugs Industry Revenue Share (%), by Indication 2024 & 2032
- Figure 78: South America UTI Treatment Drugs Industry Volume Share (%), by Indication 2024 & 2032
- Figure 79: South America UTI Treatment Drugs Industry Revenue (Million), by Country 2024 & 2032
- Figure 80: South America UTI Treatment Drugs Industry Volume (K Unit), by Country 2024 & 2032
- Figure 81: South America UTI Treatment Drugs Industry Revenue Share (%), by Country 2024 & 2032
- Figure 82: South America UTI Treatment Drugs Industry Volume Share (%), by Country 2024 & 2032
List of Tables
- Table 1: Global UTI Treatment Drugs Industry Revenue Million Forecast, by Region 2019 & 2032
- Table 2: Global UTI Treatment Drugs Industry Volume K Unit Forecast, by Region 2019 & 2032
- Table 3: Global UTI Treatment Drugs Industry Revenue Million Forecast, by Drug 2019 & 2032
- Table 4: Global UTI Treatment Drugs Industry Volume K Unit Forecast, by Drug 2019 & 2032
- Table 5: Global UTI Treatment Drugs Industry Revenue Million Forecast, by Indication 2019 & 2032
- Table 6: Global UTI Treatment Drugs Industry Volume K Unit Forecast, by Indication 2019 & 2032
- Table 7: Global UTI Treatment Drugs Industry Revenue Million Forecast, by Region 2019 & 2032
- Table 8: Global UTI Treatment Drugs Industry Volume K Unit Forecast, by Region 2019 & 2032
- Table 9: Global UTI Treatment Drugs Industry Revenue Million Forecast, by Country 2019 & 2032
- Table 10: Global UTI Treatment Drugs Industry Volume K Unit Forecast, by Country 2019 & 2032
- Table 11: Global UTI Treatment Drugs Industry Revenue Million Forecast, by Country 2019 & 2032
- Table 12: Global UTI Treatment Drugs Industry Volume K Unit Forecast, by Country 2019 & 2032
- Table 13: Global UTI Treatment Drugs Industry Revenue Million Forecast, by Country 2019 & 2032
- Table 14: Global UTI Treatment Drugs Industry Volume K Unit Forecast, by Country 2019 & 2032
- Table 15: Global UTI Treatment Drugs Industry Revenue Million Forecast, by Country 2019 & 2032
- Table 16: Global UTI Treatment Drugs Industry Volume K Unit Forecast, by Country 2019 & 2032
- Table 17: Global UTI Treatment Drugs Industry Revenue Million Forecast, by Country 2019 & 2032
- Table 18: Global UTI Treatment Drugs Industry Volume K Unit Forecast, by Country 2019 & 2032
- Table 19: Global UTI Treatment Drugs Industry Revenue Million Forecast, by Drug 2019 & 2032
- Table 20: Global UTI Treatment Drugs Industry Volume K Unit Forecast, by Drug 2019 & 2032
- Table 21: Global UTI Treatment Drugs Industry Revenue Million Forecast, by Indication 2019 & 2032
- Table 22: Global UTI Treatment Drugs Industry Volume K Unit Forecast, by Indication 2019 & 2032
- Table 23: Global UTI Treatment Drugs Industry Revenue Million Forecast, by Country 2019 & 2032
- Table 24: Global UTI Treatment Drugs Industry Volume K Unit Forecast, by Country 2019 & 2032
- Table 25: US UTI Treatment Drugs Industry Revenue (Million) Forecast, by Application 2019 & 2032
- Table 26: US UTI Treatment Drugs Industry Volume (K Unit) Forecast, by Application 2019 & 2032
- Table 27: Canada UTI Treatment Drugs Industry Revenue (Million) Forecast, by Application 2019 & 2032
- Table 28: Canada UTI Treatment Drugs Industry Volume (K Unit) Forecast, by Application 2019 & 2032
- Table 29: Mexico UTI Treatment Drugs Industry Revenue (Million) Forecast, by Application 2019 & 2032
- Table 30: Mexico UTI Treatment Drugs Industry Volume (K Unit) Forecast, by Application 2019 & 2032
- Table 31: Global UTI Treatment Drugs Industry Revenue Million Forecast, by Drug 2019 & 2032
- Table 32: Global UTI Treatment Drugs Industry Volume K Unit Forecast, by Drug 2019 & 2032
- Table 33: Global UTI Treatment Drugs Industry Revenue Million Forecast, by Indication 2019 & 2032
- Table 34: Global UTI Treatment Drugs Industry Volume K Unit Forecast, by Indication 2019 & 2032
- Table 35: Global UTI Treatment Drugs Industry Revenue Million Forecast, by Country 2019 & 2032
- Table 36: Global UTI Treatment Drugs Industry Volume K Unit Forecast, by Country 2019 & 2032
- Table 37: Germany UTI Treatment Drugs Industry Revenue (Million) Forecast, by Application 2019 & 2032
- Table 38: Germany UTI Treatment Drugs Industry Volume (K Unit) Forecast, by Application 2019 & 2032
- Table 39: UK UTI Treatment Drugs Industry Revenue (Million) Forecast, by Application 2019 & 2032
- Table 40: UK UTI Treatment Drugs Industry Volume (K Unit) Forecast, by Application 2019 & 2032
- Table 41: France UTI Treatment Drugs Industry Revenue (Million) Forecast, by Application 2019 & 2032
- Table 42: France UTI Treatment Drugs Industry Volume (K Unit) Forecast, by Application 2019 & 2032
- Table 43: Italy UTI Treatment Drugs Industry Revenue (Million) Forecast, by Application 2019 & 2032
- Table 44: Italy UTI Treatment Drugs Industry Volume (K Unit) Forecast, by Application 2019 & 2032
- Table 45: Spain UTI Treatment Drugs Industry Revenue (Million) Forecast, by Application 2019 & 2032
- Table 46: Spain UTI Treatment Drugs Industry Volume (K Unit) Forecast, by Application 2019 & 2032
- Table 47: Rest of Europe UTI Treatment Drugs Industry Revenue (Million) Forecast, by Application 2019 & 2032
- Table 48: Rest of Europe UTI Treatment Drugs Industry Volume (K Unit) Forecast, by Application 2019 & 2032
- Table 49: Global UTI Treatment Drugs Industry Revenue Million Forecast, by Drug 2019 & 2032
- Table 50: Global UTI Treatment Drugs Industry Volume K Unit Forecast, by Drug 2019 & 2032
- Table 51: Global UTI Treatment Drugs Industry Revenue Million Forecast, by Indication 2019 & 2032
- Table 52: Global UTI Treatment Drugs Industry Volume K Unit Forecast, by Indication 2019 & 2032
- Table 53: Global UTI Treatment Drugs Industry Revenue Million Forecast, by Country 2019 & 2032
- Table 54: Global UTI Treatment Drugs Industry Volume K Unit Forecast, by Country 2019 & 2032
- Table 55: China UTI Treatment Drugs Industry Revenue (Million) Forecast, by Application 2019 & 2032
- Table 56: China UTI Treatment Drugs Industry Volume (K Unit) Forecast, by Application 2019 & 2032
- Table 57: Japan UTI Treatment Drugs Industry Revenue (Million) Forecast, by Application 2019 & 2032
- Table 58: Japan UTI Treatment Drugs Industry Volume (K Unit) Forecast, by Application 2019 & 2032
- Table 59: India UTI Treatment Drugs Industry Revenue (Million) Forecast, by Application 2019 & 2032
- Table 60: India UTI Treatment Drugs Industry Volume (K Unit) Forecast, by Application 2019 & 2032
- Table 61: Australia UTI Treatment Drugs Industry Revenue (Million) Forecast, by Application 2019 & 2032
- Table 62: Australia UTI Treatment Drugs Industry Volume (K Unit) Forecast, by Application 2019 & 2032
- Table 63: South Korea UTI Treatment Drugs Industry Revenue (Million) Forecast, by Application 2019 & 2032
- Table 64: South Korea UTI Treatment Drugs Industry Volume (K Unit) Forecast, by Application 2019 & 2032
- Table 65: Rest of Asia Pacific UTI Treatment Drugs Industry Revenue (Million) Forecast, by Application 2019 & 2032
- Table 66: Rest of Asia Pacific UTI Treatment Drugs Industry Volume (K Unit) Forecast, by Application 2019 & 2032
- Table 67: Global UTI Treatment Drugs Industry Revenue Million Forecast, by Drug 2019 & 2032
- Table 68: Global UTI Treatment Drugs Industry Volume K Unit Forecast, by Drug 2019 & 2032
- Table 69: Global UTI Treatment Drugs Industry Revenue Million Forecast, by Indication 2019 & 2032
- Table 70: Global UTI Treatment Drugs Industry Volume K Unit Forecast, by Indication 2019 & 2032
- Table 71: Global UTI Treatment Drugs Industry Revenue Million Forecast, by Country 2019 & 2032
- Table 72: Global UTI Treatment Drugs Industry Volume K Unit Forecast, by Country 2019 & 2032
- Table 73: GCC UTI Treatment Drugs Industry Revenue (Million) Forecast, by Application 2019 & 2032
- Table 74: GCC UTI Treatment Drugs Industry Volume (K Unit) Forecast, by Application 2019 & 2032
- Table 75: South Africa UTI Treatment Drugs Industry Revenue (Million) Forecast, by Application 2019 & 2032
- Table 76: South Africa UTI Treatment Drugs Industry Volume (K Unit) Forecast, by Application 2019 & 2032
- Table 77: Rest of Middle East and Africa UTI Treatment Drugs Industry Revenue (Million) Forecast, by Application 2019 & 2032
- Table 78: Rest of Middle East and Africa UTI Treatment Drugs Industry Volume (K Unit) Forecast, by Application 2019 & 2032
- Table 79: Global UTI Treatment Drugs Industry Revenue Million Forecast, by Drug 2019 & 2032
- Table 80: Global UTI Treatment Drugs Industry Volume K Unit Forecast, by Drug 2019 & 2032
- Table 81: Global UTI Treatment Drugs Industry Revenue Million Forecast, by Indication 2019 & 2032
- Table 82: Global UTI Treatment Drugs Industry Volume K Unit Forecast, by Indication 2019 & 2032
- Table 83: Global UTI Treatment Drugs Industry Revenue Million Forecast, by Country 2019 & 2032
- Table 84: Global UTI Treatment Drugs Industry Volume K Unit Forecast, by Country 2019 & 2032
- Table 85: Brazil UTI Treatment Drugs Industry Revenue (Million) Forecast, by Application 2019 & 2032
- Table 86: Brazil UTI Treatment Drugs Industry Volume (K Unit) Forecast, by Application 2019 & 2032
- Table 87: Argentina UTI Treatment Drugs Industry Revenue (Million) Forecast, by Application 2019 & 2032
- Table 88: Argentina UTI Treatment Drugs Industry Volume (K Unit) Forecast, by Application 2019 & 2032
- Table 89: Rest of South America UTI Treatment Drugs Industry Revenue (Million) Forecast, by Application 2019 & 2032
- Table 90: Rest of South America UTI Treatment Drugs Industry Volume (K Unit) Forecast, by Application 2019 & 2032
Frequently Asked Questions
1. What is the projected Compound Annual Growth Rate (CAGR) of the UTI Treatment Drugs Industry?
The projected CAGR is approximately 2.77%.
2. Which companies are prominent players in the UTI Treatment Drugs Industry?
Key companies in the market include Pfizer, Allergan, Bayer AG, Novartis AG, Merck & Co Inc, Cipla Inc, Shionogi & Co Ltd, AstraZeneca, Almirall SA, Dr Reddys Laboratories Ltd, Bristol-Myers Squibb Company, GlaxoSmithKline PLC.
3. What are the main segments of the UTI Treatment Drugs Industry?
The market segments include Drug, Indication.
4. Can you provide details about the market size?
The market size is estimated to be USD 9.37 Million as of 2022.
5. What are some drivers contributing to market growth?
Increasing Prevalence of Diabetes and Kidney Stones; Launch of Combination Drugs.
6. What are the notable trends driving market growth?
Complicated UTIs Segment Expected to Hold a Major Share in the Urinary Tract Infection Therapeutics Market.
7. Are there any restraints impacting market growth?
Adverse Effects Associated with the Use of Medication; Lack of Awareness in Developing and Underdeveloped Countries.
8. Can you provide examples of recent developments in the market?
N/A
9. What pricing options are available for accessing the report?
Pricing options include single-user, multi-user, and enterprise licenses priced at USD 4750, USD 5250, and USD 8750 respectively.
10. Is the market size provided in terms of value or volume?
The market size is provided in terms of value, measured in Million and volume, measured in K Unit.
11. Are there any specific market keywords associated with the report?
Yes, the market keyword associated with the report is "UTI Treatment Drugs Industry," which aids in identifying and referencing the specific market segment covered.
12. How do I determine which pricing option suits my needs best?
The pricing options vary based on user requirements and access needs. Individual users may opt for single-user licenses, while businesses requiring broader access may choose multi-user or enterprise licenses for cost-effective access to the report.
13. Are there any additional resources or data provided in the UTI Treatment Drugs Industry report?
While the report offers comprehensive insights, it's advisable to review the specific contents or supplementary materials provided to ascertain if additional resources or data are available.
14. How can I stay updated on further developments or reports in the UTI Treatment Drugs Industry?
To stay informed about further developments, trends, and reports in the UTI Treatment Drugs Industry, consider subscribing to industry newsletters, following relevant companies and organizations, or regularly checking reputable industry news sources and publications.
Methodology
Step 1 - Identification of Relevant Samples Size from Population Database


Step 2 - Approaches for Defining Global Market Size (Value, Volume* & Price*)

Note*: In applicable scenarios
Step 3 - Data Sources
Primary Research
- Web Analytics
- Survey Reports
- Research Institute
- Latest Research Reports
- Opinion Leaders
Secondary Research
- Annual Reports
- White Paper
- Latest Press Release
- Industry Association
- Paid Database
- Investor Presentations

Step 4 - Data Triangulation
Involves using different sources of information in order to increase the validity of a study
These sources are likely to be stakeholders in a program - participants, other researchers, program staff, other community members, and so on.
Then we put all data in single framework & apply various statistical tools to find out the dynamic on the market.
During the analysis stage, feedback from the stakeholder groups would be compared to determine areas of agreement as well as areas of divergence
