

Key Insights
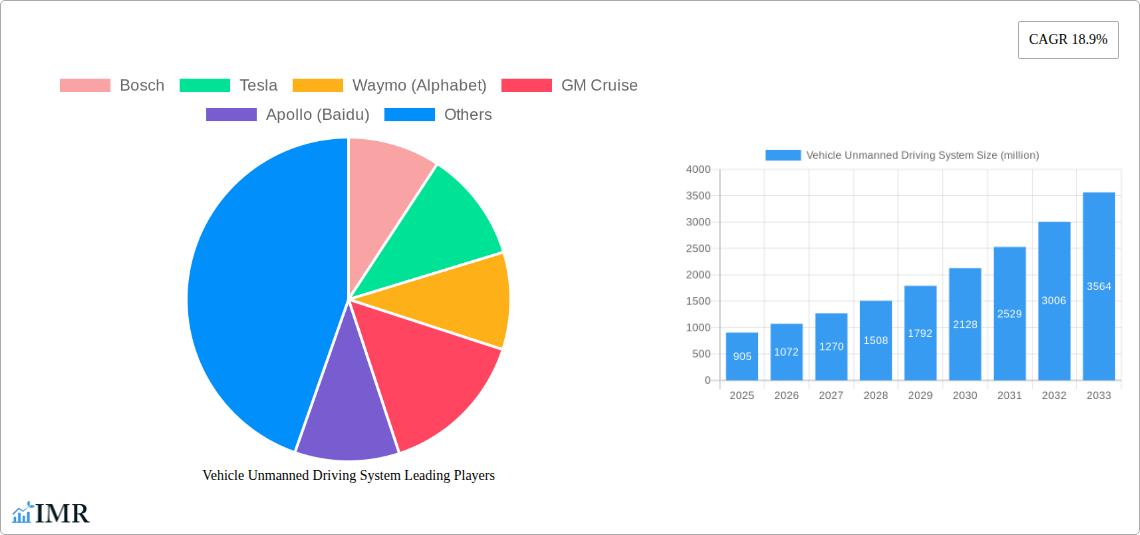
The autonomous vehicle market, encompassing unmanned driving systems, is experiencing explosive growth, projected to reach a substantial size. With a current market valuation of $905 million in 2025 and a Compound Annual Growth Rate (CAGR) of 18.9%, the market is poised for significant expansion throughout the forecast period (2025-2033). This robust growth is fueled by several key factors. Technological advancements in sensor technology (LiDAR, radar, cameras), artificial intelligence (AI), and machine learning (ML) are enabling more sophisticated and reliable autonomous driving capabilities. Increasing consumer demand for enhanced safety and convenience, coupled with the potential for reduced traffic congestion and improved fuel efficiency, are driving adoption. Furthermore, significant investments from both established automotive manufacturers like Bosch, Continental, and Denso, and technology giants such as Tesla, Waymo (Alphabet), and NVIDIA, are accelerating innovation and market penetration. Government regulations and supportive policies, aiming to promote the development and deployment of autonomous vehicles, also play a crucial role in shaping this dynamic landscape.
However, the market faces certain challenges. High initial costs associated with the development, manufacturing, and deployment of autonomous driving systems remain a significant barrier to wider adoption. Concerns surrounding safety and regulatory uncertainties, including liability issues in the event of accidents, are also creating headwinds. The complex integration of various technologies and the need for robust cybersecurity measures to prevent hacking and malicious attacks present further hurdles. Despite these challenges, the long-term outlook for the autonomous vehicle market remains overwhelmingly positive, with continuous technological improvements and increasing acceptance anticipated to drive significant market expansion in the coming years. Competition among leading companies will intensify, driving innovation and potentially leading to consolidation within the industry.
Vehicle Unmanned Driving System Market Report: 2019-2033
This comprehensive report provides a detailed analysis of the global Vehicle Unmanned Driving System (VUDS) market, encompassing market dynamics, growth trends, regional segmentation, product landscape, key players, and future outlook. The report covers the period 2019-2033, with a base year of 2025 and a forecast period of 2025-2033. The study focuses on the parent market of Advanced Driver-Assistance Systems (ADAS) and the child market of fully autonomous driving systems. It offers invaluable insights for industry professionals, investors, and strategic decision-makers seeking to navigate this rapidly evolving sector. The market size is estimated in million units.
Vehicle Unmanned Driving System Market Dynamics & Structure
The VUDS market is characterized by intense competition amongst established automotive suppliers and tech giants. Market concentration is moderate, with a few dominant players controlling a significant portion of the market share. However, the entry of new players, particularly from the technology sector, is increasing competition. Technological innovation, primarily in areas such as sensor technology, AI algorithms, and high-definition mapping, is a key driver of market growth. Regulatory frameworks, varying significantly across different countries, pose both challenges and opportunities. The development of robust safety standards and regulatory approvals are crucial for wider adoption. Furthermore, alternative solutions, such as improved driver assistance systems, represent competitive substitutes. The end-user demographics are predominantly focused on commercial fleets (logistics, ride-hailing) and later consumer vehicles. M&A activity has been significant, with larger players acquiring smaller companies to gain technological expertise and market share.
- Market Concentration: Moderate, with top 5 players holding approximately xx% market share in 2025.
- Technological Innovation: Significant advancements in AI, sensor fusion, and mapping technologies are driving market growth.
- Regulatory Landscape: Varying regulations across different geographies create challenges for market expansion.
- Competitive Substitutes: Improved ADAS systems and human-driven vehicles represent competitive threats.
- End-User Demographics: Primarily commercial fleets initially, with a shift towards consumer adoption by 2033.
- M&A Activity: xx major M&A deals in the period 2019-2024, with a projected xx deals in 2025-2033.
Vehicle Unmanned Driving System Growth Trends & Insights
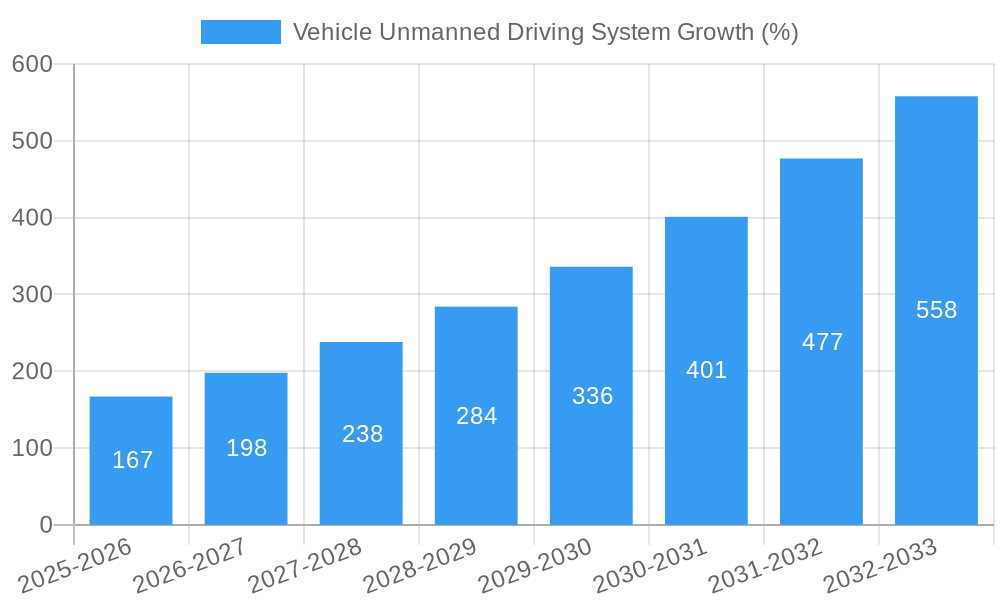
The VUDS market is experiencing exponential growth, driven by technological advancements and increasing demand for improved road safety and transportation efficiency. The market size is estimated to reach xx million units in 2025, expanding to xx million units by 2033. This signifies a Compound Annual Growth Rate (CAGR) of xx%. Market penetration is currently low, but is expected to increase significantly as technology matures and regulatory approvals are obtained. Technological disruptions, such as the development of fully autonomous vehicles, are fundamentally changing the automotive landscape. Consumer behavior shifts are favoring convenience, safety, and efficiency. The rising adoption of shared mobility services further drives demand for autonomous vehicles.
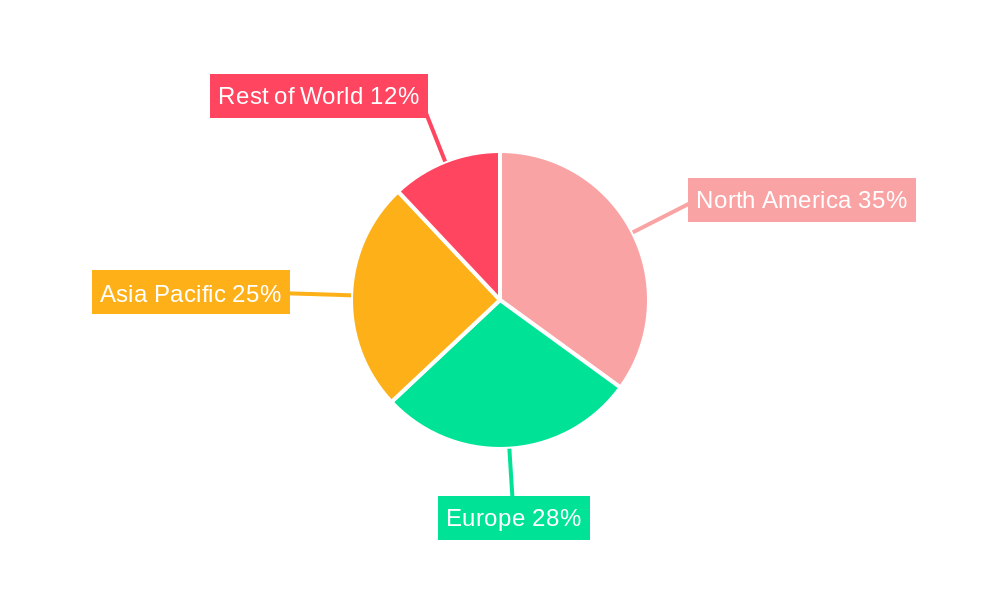
Dominant Regions, Countries, or Segments in Vehicle Unmanned Driving System
North America (specifically the USA) currently leads the VUDS market, driven by significant investments in R&D, supportive regulatory environments (in specific areas), and high consumer acceptance. China is also witnessing rapid growth due to increasing government support and a large potential market. The commercial fleet segment is currently the largest, followed by the passenger vehicle segment.
- North America: High investment in R&D, favorable regulatory environment in certain states, and early adopter market create dominance.
- China: Strong government support, large potential market, and increasing technological advancements drive rapid growth.
- Commercial Fleets: Early adoption by logistics and ride-hailing companies drives initial market volume.
- Passenger Vehicles: Growing consumer acceptance and technological advancements will fuel future growth.
Vehicle Unmanned Driving System Product Landscape
VUDS products encompass a range of technologies, including LiDAR, radar, cameras, and high-precision GPS. These systems are integrated to provide a comprehensive understanding of the vehicle's surroundings. Performance metrics focus on safety, reliability, and accuracy, with innovations emphasizing improved sensor fusion algorithms, AI-powered decision-making capabilities, and enhanced mapping systems. Unique selling propositions frequently center around higher levels of automation, increased safety features, and superior reliability. Technological advancements continually improve the accuracy and robustness of the systems.
Key Drivers, Barriers & Challenges in Vehicle Unmanned Driving System
Key Drivers: Technological breakthroughs in AI, sensor technology, and mapping; increased demand for safer and more efficient transportation; supportive government policies and incentives in certain regions; growing adoption of shared mobility services.
Challenges: High development costs and deployment barriers; stringent regulatory approvals and safety standards; concerns regarding data security and privacy; ethical implications and liability issues; supply chain vulnerabilities affecting the availability of key components (e.g., semiconductor chips). These challenges could lead to a xx% reduction in projected growth if not effectively addressed.
Emerging Opportunities in Vehicle Unmanned Driving System
Emerging opportunities include untapped markets in developing countries; innovative applications, such as autonomous delivery services and robotic taxis; evolving consumer preferences towards convenience and sustainability; the integration of VUDS with smart city infrastructure.
Growth Accelerators in the Vehicle Unmanned Driving System Industry
Long-term growth will be fueled by technological breakthroughs in edge computing and AI; strategic partnerships between automotive manufacturers and technology companies; expansion into new geographic markets; and the development of more affordable and accessible VUDS solutions.
Key Players Shaping the Vehicle Unmanned Driving System Market
Notable Milestones in Vehicle Unmanned Driving System Sector
- 2020: Waymo launches fully autonomous ride-hailing service in limited areas.
- 2021: GM Cruise expands autonomous vehicle testing in several cities.
- 2022: Several major partnerships formed between automotive manufacturers and technology companies to accelerate VUDS development.
- 2023: Significant advancements in LiDAR and sensor fusion technologies are reported.
- 2024: Increased regulatory scrutiny and safety standards implemented in several countries.
In-Depth Vehicle Unmanned Driving System Market Outlook
The VUDS market holds tremendous future potential, driven by technological progress and increasing adoption across various sectors. Strategic opportunities abound for companies that can successfully navigate the technological, regulatory, and competitive challenges. The market's growth trajectory will be significantly influenced by advancements in AI, sensor technology, and infrastructure development. Companies focused on innovation, strategic partnerships, and addressing consumer concerns will be best positioned for success in this dynamic and rapidly growing market.
Vehicle Unmanned Driving System Segmentation
-
1. Application
- 1.1. Passenger Car
- 1.2. Commercial Car
-
2. Type
- 2.1. L3
- 2.2. L4
- 2.3. Others
Vehicle Unmanned Driving System Segmentation By Geography
-
1. North America
- 1.1. United States
- 1.2. Canada
- 1.3. Mexico
-
2. South America
- 2.1. Brazil
- 2.2. Argentina
- 2.3. Rest of South America
-
3. Europe
- 3.1. United Kingdom
- 3.2. Germany
- 3.3. France
- 3.4. Italy
- 3.5. Spain
- 3.6. Russia
- 3.7. Benelux
- 3.8. Nordics
- 3.9. Rest of Europe
-
4. Middle East & Africa
- 4.1. Turkey
- 4.2. Israel
- 4.3. GCC
- 4.4. North Africa
- 4.5. South Africa
- 4.6. Rest of Middle East & Africa
-
5. Asia Pacific
- 5.1. China
- 5.2. India
- 5.3. Japan
- 5.4. South Korea
- 5.5. ASEAN
- 5.6. Oceania
- 5.7. Rest of Asia Pacific
Vehicle Unmanned Driving System REPORT HIGHLIGHTS
| Aspects | Details |
|---|---|
| Study Period | 2019-2033 |
| Base Year | 2024 |
| Estimated Year | 2025 |
| Forecast Period | 2025-2033 |
| Historical Period | 2019-2024 |
| Growth Rate | CAGR of 18.9% from 2019-2033 |
| Segmentation |
|
Table of Contents
- 1. Introduction
- 1.1. Research Scope
- 1.2. Market Segmentation
- 1.3. Research Methodology
- 1.4. Definitions and Assumptions
- 2. Executive Summary
- 2.1. Introduction
- 3. Market Dynamics
- 3.1. Introduction
- 3.2. Market Drivers
- 3.3. Market Restrains
- 3.4. Market Trends
- 4. Market Factor Analysis
- 4.1. Porters Five Forces
- 4.2. Supply/Value Chain
- 4.3. PESTEL analysis
- 4.4. Market Entropy
- 4.5. Patent/Trademark Analysis
- 5. Global Vehicle Unmanned Driving System Analysis, Insights and Forecast, 2019-2031
- 5.1. Market Analysis, Insights and Forecast - by Application
- 5.1.1. Passenger Car
- 5.1.2. Commercial Car
- 5.2. Market Analysis, Insights and Forecast - by Type
- 5.2.1. L3
- 5.2.2. L4
- 5.2.3. Others
- 5.3. Market Analysis, Insights and Forecast - by Region
- 5.3.1. North America
- 5.3.2. South America
- 5.3.3. Europe
- 5.3.4. Middle East & Africa
- 5.3.5. Asia Pacific
- 5.1. Market Analysis, Insights and Forecast - by Application
- 6. North America Vehicle Unmanned Driving System Analysis, Insights and Forecast, 2019-2031
- 6.1. Market Analysis, Insights and Forecast - by Application
- 6.1.1. Passenger Car
- 6.1.2. Commercial Car
- 6.2. Market Analysis, Insights and Forecast - by Type
- 6.2.1. L3
- 6.2.2. L4
- 6.2.3. Others
- 6.1. Market Analysis, Insights and Forecast - by Application
- 7. South America Vehicle Unmanned Driving System Analysis, Insights and Forecast, 2019-2031
- 7.1. Market Analysis, Insights and Forecast - by Application
- 7.1.1. Passenger Car
- 7.1.2. Commercial Car
- 7.2. Market Analysis, Insights and Forecast - by Type
- 7.2.1. L3
- 7.2.2. L4
- 7.2.3. Others
- 7.1. Market Analysis, Insights and Forecast - by Application
- 8. Europe Vehicle Unmanned Driving System Analysis, Insights and Forecast, 2019-2031
- 8.1. Market Analysis, Insights and Forecast - by Application
- 8.1.1. Passenger Car
- 8.1.2. Commercial Car
- 8.2. Market Analysis, Insights and Forecast - by Type
- 8.2.1. L3
- 8.2.2. L4
- 8.2.3. Others
- 8.1. Market Analysis, Insights and Forecast - by Application
- 9. Middle East & Africa Vehicle Unmanned Driving System Analysis, Insights and Forecast, 2019-2031
- 9.1. Market Analysis, Insights and Forecast - by Application
- 9.1.1. Passenger Car
- 9.1.2. Commercial Car
- 9.2. Market Analysis, Insights and Forecast - by Type
- 9.2.1. L3
- 9.2.2. L4
- 9.2.3. Others
- 9.1. Market Analysis, Insights and Forecast - by Application
- 10. Asia Pacific Vehicle Unmanned Driving System Analysis, Insights and Forecast, 2019-2031
- 10.1. Market Analysis, Insights and Forecast - by Application
- 10.1.1. Passenger Car
- 10.1.2. Commercial Car
- 10.2. Market Analysis, Insights and Forecast - by Type
- 10.2.1. L3
- 10.2.2. L4
- 10.2.3. Others
- 10.1. Market Analysis, Insights and Forecast - by Application
- 11. Competitive Analysis
- 11.1. Global Market Share Analysis 2024
- 11.2. Company Profiles
- 11.2.1 Bosch
- 11.2.1.1. Overview
- 11.2.1.2. Products
- 11.2.1.3. SWOT Analysis
- 11.2.1.4. Recent Developments
- 11.2.1.5. Financials (Based on Availability)
- 11.2.2 Tesla
- 11.2.2.1. Overview
- 11.2.2.2. Products
- 11.2.2.3. SWOT Analysis
- 11.2.2.4. Recent Developments
- 11.2.2.5. Financials (Based on Availability)
- 11.2.3 Waymo (Alphabet)
- 11.2.3.1. Overview
- 11.2.3.2. Products
- 11.2.3.3. SWOT Analysis
- 11.2.3.4. Recent Developments
- 11.2.3.5. Financials (Based on Availability)
- 11.2.4 GM Cruise
- 11.2.4.1. Overview
- 11.2.4.2. Products
- 11.2.4.3. SWOT Analysis
- 11.2.4.4. Recent Developments
- 11.2.4.5. Financials (Based on Availability)
- 11.2.5 Apollo (Baidu)
- 11.2.5.1. Overview
- 11.2.5.2. Products
- 11.2.5.3. SWOT Analysis
- 11.2.5.4. Recent Developments
- 11.2.5.5. Financials (Based on Availability)
- 11.2.6 Continental
- 11.2.6.1. Overview
- 11.2.6.2. Products
- 11.2.6.3. SWOT Analysis
- 11.2.6.4. Recent Developments
- 11.2.6.5. Financials (Based on Availability)
- 11.2.7 Aptiv
- 11.2.7.1. Overview
- 11.2.7.2. Products
- 11.2.7.3. SWOT Analysis
- 11.2.7.4. Recent Developments
- 11.2.7.5. Financials (Based on Availability)
- 11.2.8 ZF Group
- 11.2.8.1. Overview
- 11.2.8.2. Products
- 11.2.8.3. SWOT Analysis
- 11.2.8.4. Recent Developments
- 11.2.8.5. Financials (Based on Availability)
- 11.2.9 NVIDIA
- 11.2.9.1. Overview
- 11.2.9.2. Products
- 11.2.9.3. SWOT Analysis
- 11.2.9.4. Recent Developments
- 11.2.9.5. Financials (Based on Availability)
- 11.2.10 Denso
- 11.2.10.1. Overview
- 11.2.10.2. Products
- 11.2.10.3. SWOT Analysis
- 11.2.10.4. Recent Developments
- 11.2.10.5. Financials (Based on Availability)
- 11.2.1 Bosch
List of Figures
- Figure 1: Global Vehicle Unmanned Driving System Revenue Breakdown (million, %) by Region 2024 & 2032
- Figure 2: North America Vehicle Unmanned Driving System Revenue (million), by Application 2024 & 2032
- Figure 3: North America Vehicle Unmanned Driving System Revenue Share (%), by Application 2024 & 2032
- Figure 4: North America Vehicle Unmanned Driving System Revenue (million), by Type 2024 & 2032
- Figure 5: North America Vehicle Unmanned Driving System Revenue Share (%), by Type 2024 & 2032
- Figure 6: North America Vehicle Unmanned Driving System Revenue (million), by Country 2024 & 2032
- Figure 7: North America Vehicle Unmanned Driving System Revenue Share (%), by Country 2024 & 2032
- Figure 8: South America Vehicle Unmanned Driving System Revenue (million), by Application 2024 & 2032
- Figure 9: South America Vehicle Unmanned Driving System Revenue Share (%), by Application 2024 & 2032
- Figure 10: South America Vehicle Unmanned Driving System Revenue (million), by Type 2024 & 2032
- Figure 11: South America Vehicle Unmanned Driving System Revenue Share (%), by Type 2024 & 2032
- Figure 12: South America Vehicle Unmanned Driving System Revenue (million), by Country 2024 & 2032
- Figure 13: South America Vehicle Unmanned Driving System Revenue Share (%), by Country 2024 & 2032
- Figure 14: Europe Vehicle Unmanned Driving System Revenue (million), by Application 2024 & 2032
- Figure 15: Europe Vehicle Unmanned Driving System Revenue Share (%), by Application 2024 & 2032
- Figure 16: Europe Vehicle Unmanned Driving System Revenue (million), by Type 2024 & 2032
- Figure 17: Europe Vehicle Unmanned Driving System Revenue Share (%), by Type 2024 & 2032
- Figure 18: Europe Vehicle Unmanned Driving System Revenue (million), by Country 2024 & 2032
- Figure 19: Europe Vehicle Unmanned Driving System Revenue Share (%), by Country 2024 & 2032
- Figure 20: Middle East & Africa Vehicle Unmanned Driving System Revenue (million), by Application 2024 & 2032
- Figure 21: Middle East & Africa Vehicle Unmanned Driving System Revenue Share (%), by Application 2024 & 2032
- Figure 22: Middle East & Africa Vehicle Unmanned Driving System Revenue (million), by Type 2024 & 2032
- Figure 23: Middle East & Africa Vehicle Unmanned Driving System Revenue Share (%), by Type 2024 & 2032
- Figure 24: Middle East & Africa Vehicle Unmanned Driving System Revenue (million), by Country 2024 & 2032
- Figure 25: Middle East & Africa Vehicle Unmanned Driving System Revenue Share (%), by Country 2024 & 2032
- Figure 26: Asia Pacific Vehicle Unmanned Driving System Revenue (million), by Application 2024 & 2032
- Figure 27: Asia Pacific Vehicle Unmanned Driving System Revenue Share (%), by Application 2024 & 2032
- Figure 28: Asia Pacific Vehicle Unmanned Driving System Revenue (million), by Type 2024 & 2032
- Figure 29: Asia Pacific Vehicle Unmanned Driving System Revenue Share (%), by Type 2024 & 2032
- Figure 30: Asia Pacific Vehicle Unmanned Driving System Revenue (million), by Country 2024 & 2032
- Figure 31: Asia Pacific Vehicle Unmanned Driving System Revenue Share (%), by Country 2024 & 2032
List of Tables
- Table 1: Global Vehicle Unmanned Driving System Revenue million Forecast, by Region 2019 & 2032
- Table 2: Global Vehicle Unmanned Driving System Revenue million Forecast, by Application 2019 & 2032
- Table 3: Global Vehicle Unmanned Driving System Revenue million Forecast, by Type 2019 & 2032
- Table 4: Global Vehicle Unmanned Driving System Revenue million Forecast, by Region 2019 & 2032
- Table 5: Global Vehicle Unmanned Driving System Revenue million Forecast, by Application 2019 & 2032
- Table 6: Global Vehicle Unmanned Driving System Revenue million Forecast, by Type 2019 & 2032
- Table 7: Global Vehicle Unmanned Driving System Revenue million Forecast, by Country 2019 & 2032
- Table 8: United States Vehicle Unmanned Driving System Revenue (million) Forecast, by Application 2019 & 2032
- Table 9: Canada Vehicle Unmanned Driving System Revenue (million) Forecast, by Application 2019 & 2032
- Table 10: Mexico Vehicle Unmanned Driving System Revenue (million) Forecast, by Application 2019 & 2032
- Table 11: Global Vehicle Unmanned Driving System Revenue million Forecast, by Application 2019 & 2032
- Table 12: Global Vehicle Unmanned Driving System Revenue million Forecast, by Type 2019 & 2032
- Table 13: Global Vehicle Unmanned Driving System Revenue million Forecast, by Country 2019 & 2032
- Table 14: Brazil Vehicle Unmanned Driving System Revenue (million) Forecast, by Application 2019 & 2032
- Table 15: Argentina Vehicle Unmanned Driving System Revenue (million) Forecast, by Application 2019 & 2032
- Table 16: Rest of South America Vehicle Unmanned Driving System Revenue (million) Forecast, by Application 2019 & 2032
- Table 17: Global Vehicle Unmanned Driving System Revenue million Forecast, by Application 2019 & 2032
- Table 18: Global Vehicle Unmanned Driving System Revenue million Forecast, by Type 2019 & 2032
- Table 19: Global Vehicle Unmanned Driving System Revenue million Forecast, by Country 2019 & 2032
- Table 20: United Kingdom Vehicle Unmanned Driving System Revenue (million) Forecast, by Application 2019 & 2032
- Table 21: Germany Vehicle Unmanned Driving System Revenue (million) Forecast, by Application 2019 & 2032
- Table 22: France Vehicle Unmanned Driving System Revenue (million) Forecast, by Application 2019 & 2032
- Table 23: Italy Vehicle Unmanned Driving System Revenue (million) Forecast, by Application 2019 & 2032
- Table 24: Spain Vehicle Unmanned Driving System Revenue (million) Forecast, by Application 2019 & 2032
- Table 25: Russia Vehicle Unmanned Driving System Revenue (million) Forecast, by Application 2019 & 2032
- Table 26: Benelux Vehicle Unmanned Driving System Revenue (million) Forecast, by Application 2019 & 2032
- Table 27: Nordics Vehicle Unmanned Driving System Revenue (million) Forecast, by Application 2019 & 2032
- Table 28: Rest of Europe Vehicle Unmanned Driving System Revenue (million) Forecast, by Application 2019 & 2032
- Table 29: Global Vehicle Unmanned Driving System Revenue million Forecast, by Application 2019 & 2032
- Table 30: Global Vehicle Unmanned Driving System Revenue million Forecast, by Type 2019 & 2032
- Table 31: Global Vehicle Unmanned Driving System Revenue million Forecast, by Country 2019 & 2032
- Table 32: Turkey Vehicle Unmanned Driving System Revenue (million) Forecast, by Application 2019 & 2032
- Table 33: Israel Vehicle Unmanned Driving System Revenue (million) Forecast, by Application 2019 & 2032
- Table 34: GCC Vehicle Unmanned Driving System Revenue (million) Forecast, by Application 2019 & 2032
- Table 35: North Africa Vehicle Unmanned Driving System Revenue (million) Forecast, by Application 2019 & 2032
- Table 36: South Africa Vehicle Unmanned Driving System Revenue (million) Forecast, by Application 2019 & 2032
- Table 37: Rest of Middle East & Africa Vehicle Unmanned Driving System Revenue (million) Forecast, by Application 2019 & 2032
- Table 38: Global Vehicle Unmanned Driving System Revenue million Forecast, by Application 2019 & 2032
- Table 39: Global Vehicle Unmanned Driving System Revenue million Forecast, by Type 2019 & 2032
- Table 40: Global Vehicle Unmanned Driving System Revenue million Forecast, by Country 2019 & 2032
- Table 41: China Vehicle Unmanned Driving System Revenue (million) Forecast, by Application 2019 & 2032
- Table 42: India Vehicle Unmanned Driving System Revenue (million) Forecast, by Application 2019 & 2032
- Table 43: Japan Vehicle Unmanned Driving System Revenue (million) Forecast, by Application 2019 & 2032
- Table 44: South Korea Vehicle Unmanned Driving System Revenue (million) Forecast, by Application 2019 & 2032
- Table 45: ASEAN Vehicle Unmanned Driving System Revenue (million) Forecast, by Application 2019 & 2032
- Table 46: Oceania Vehicle Unmanned Driving System Revenue (million) Forecast, by Application 2019 & 2032
- Table 47: Rest of Asia Pacific Vehicle Unmanned Driving System Revenue (million) Forecast, by Application 2019 & 2032
Frequently Asked Questions
1. What is the projected Compound Annual Growth Rate (CAGR) of the Vehicle Unmanned Driving System?
The projected CAGR is approximately 18.9%.
2. Which companies are prominent players in the Vehicle Unmanned Driving System?
Key companies in the market include Bosch, Tesla, Waymo (Alphabet), GM Cruise, Apollo (Baidu), Continental, Aptiv, ZF Group, NVIDIA, Denso.
3. What are the main segments of the Vehicle Unmanned Driving System?
The market segments include Application, Type.
4. Can you provide details about the market size?
The market size is estimated to be USD 905 million as of 2022.
5. What are some drivers contributing to market growth?
N/A
6. What are the notable trends driving market growth?
N/A
7. Are there any restraints impacting market growth?
N/A
8. Can you provide examples of recent developments in the market?
N/A
9. What pricing options are available for accessing the report?
Pricing options include single-user, multi-user, and enterprise licenses priced at USD 3950.00, USD 5925.00, and USD 7900.00 respectively.
10. Is the market size provided in terms of value or volume?
The market size is provided in terms of value, measured in million.
11. Are there any specific market keywords associated with the report?
Yes, the market keyword associated with the report is "Vehicle Unmanned Driving System," which aids in identifying and referencing the specific market segment covered.
12. How do I determine which pricing option suits my needs best?
The pricing options vary based on user requirements and access needs. Individual users may opt for single-user licenses, while businesses requiring broader access may choose multi-user or enterprise licenses for cost-effective access to the report.
13. Are there any additional resources or data provided in the Vehicle Unmanned Driving System report?
While the report offers comprehensive insights, it's advisable to review the specific contents or supplementary materials provided to ascertain if additional resources or data are available.
14. How can I stay updated on further developments or reports in the Vehicle Unmanned Driving System?
To stay informed about further developments, trends, and reports in the Vehicle Unmanned Driving System, consider subscribing to industry newsletters, following relevant companies and organizations, or regularly checking reputable industry news sources and publications.
Methodology
Step 1 - Identification of Relevant Samples Size from Population Database


Step 2 - Approaches for Defining Global Market Size (Value, Volume* & Price*)

Note*: In applicable scenarios
Step 3 - Data Sources
Primary Research
- Web Analytics
- Survey Reports
- Research Institute
- Latest Research Reports
- Opinion Leaders
Secondary Research
- Annual Reports
- White Paper
- Latest Press Release
- Industry Association
- Paid Database
- Investor Presentations

Step 4 - Data Triangulation
Involves using different sources of information in order to increase the validity of a study
These sources are likely to be stakeholders in a program - participants, other researchers, program staff, other community members, and so on.
Then we put all data in single framework & apply various statistical tools to find out the dynamic on the market.
During the analysis stage, feedback from the stakeholder groups would be compared to determine areas of agreement as well as areas of divergence
