

Key Insights
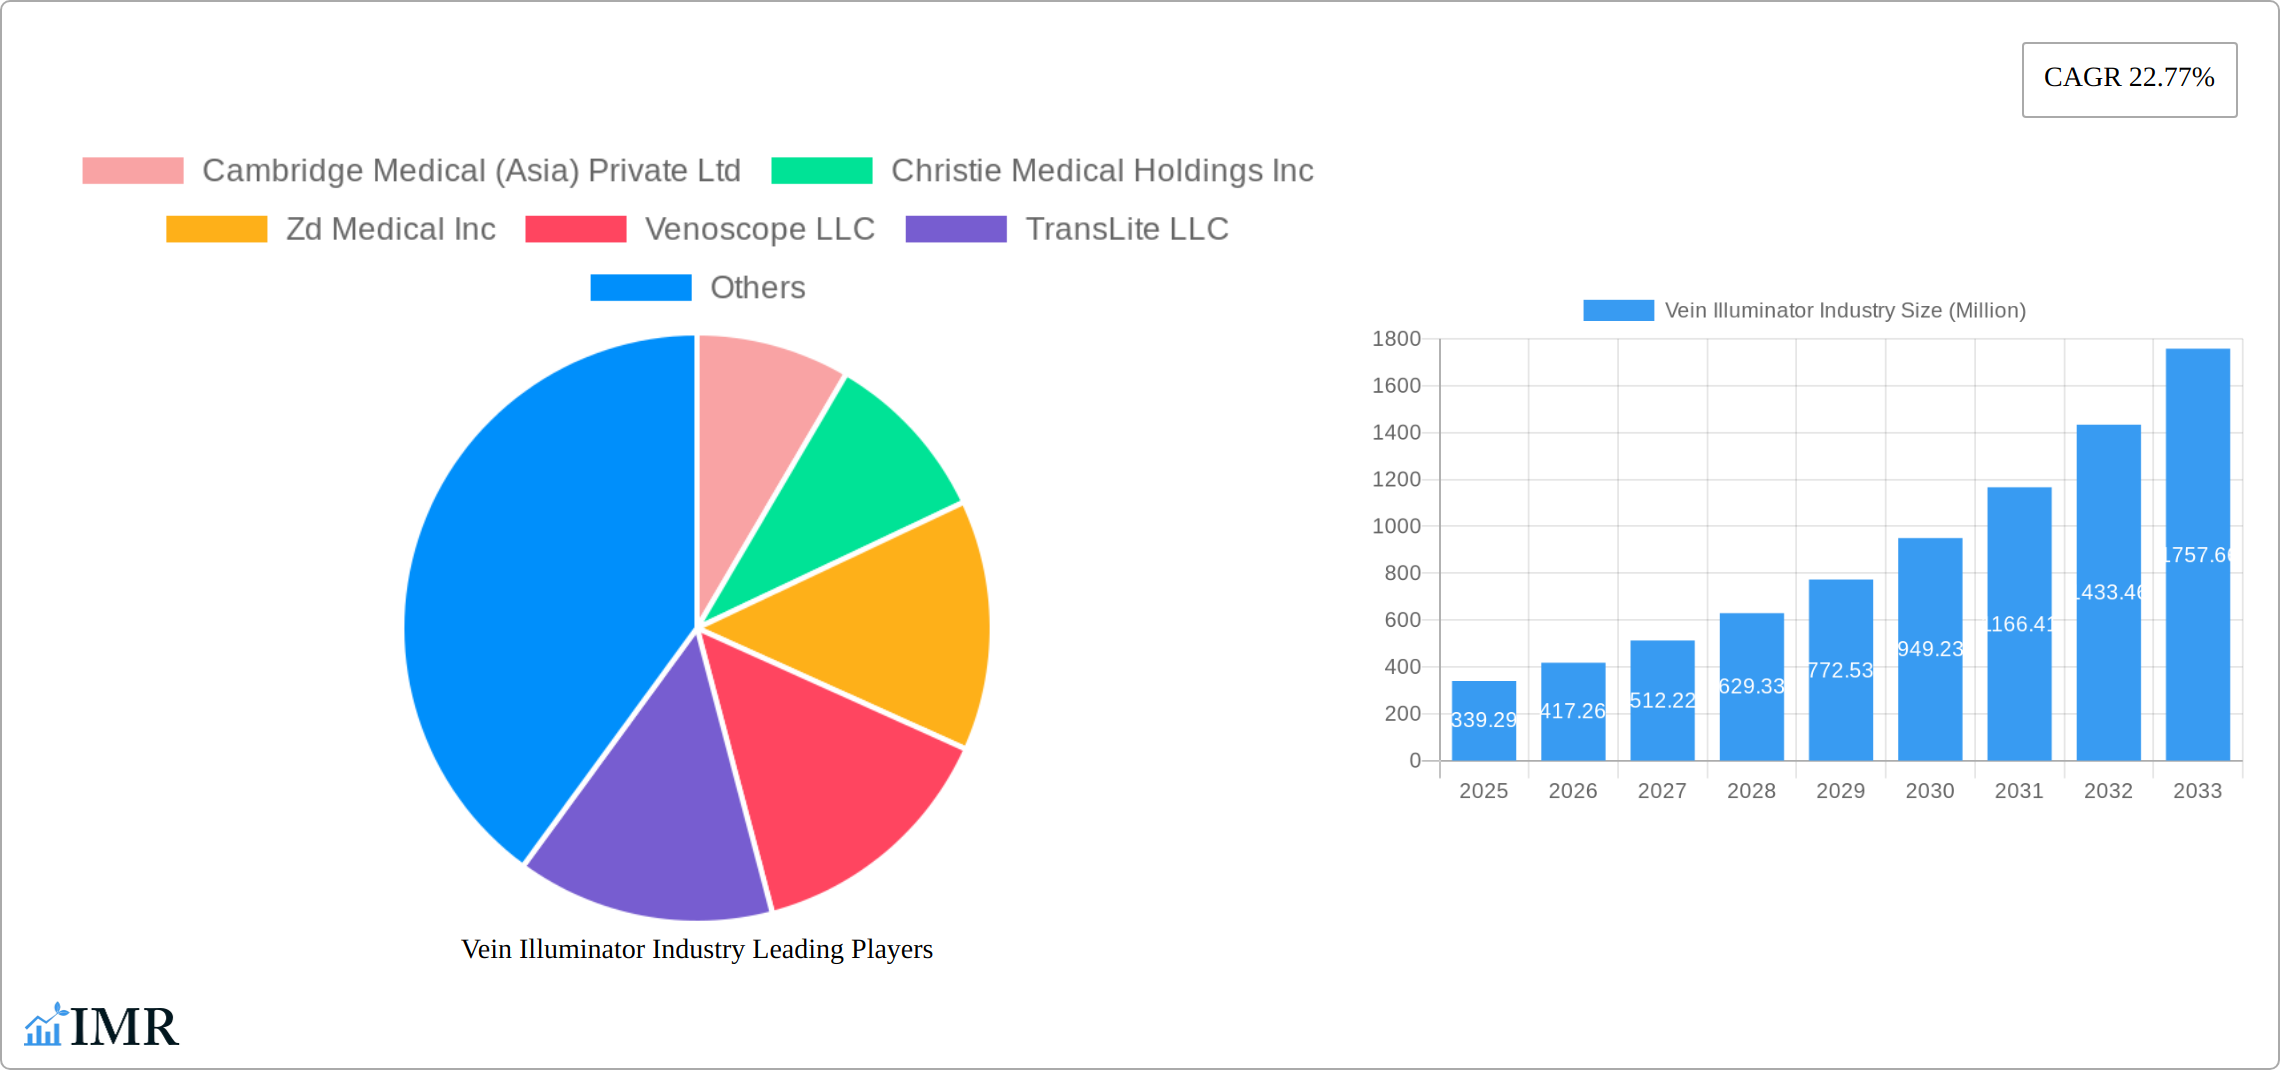
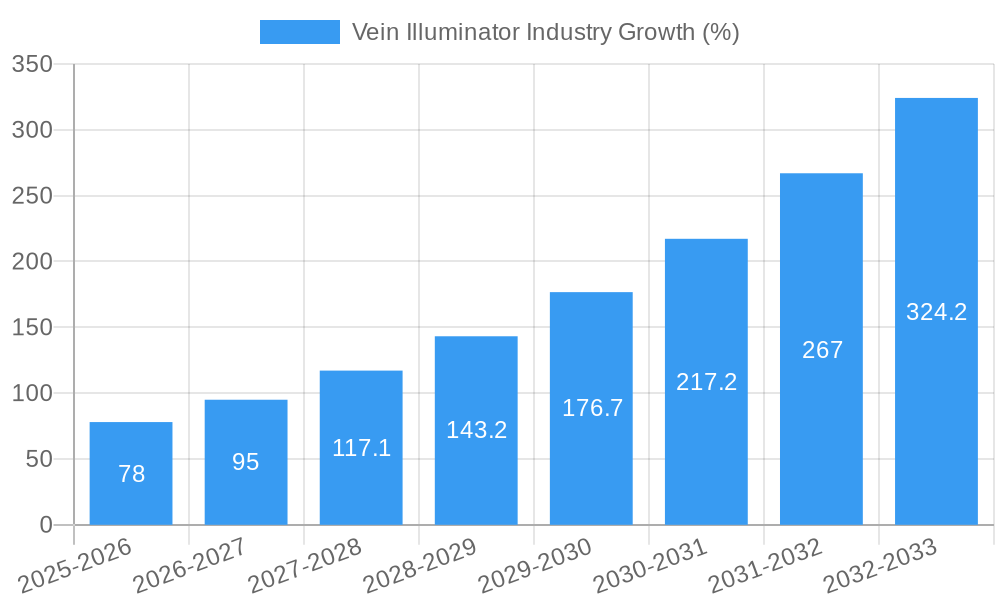
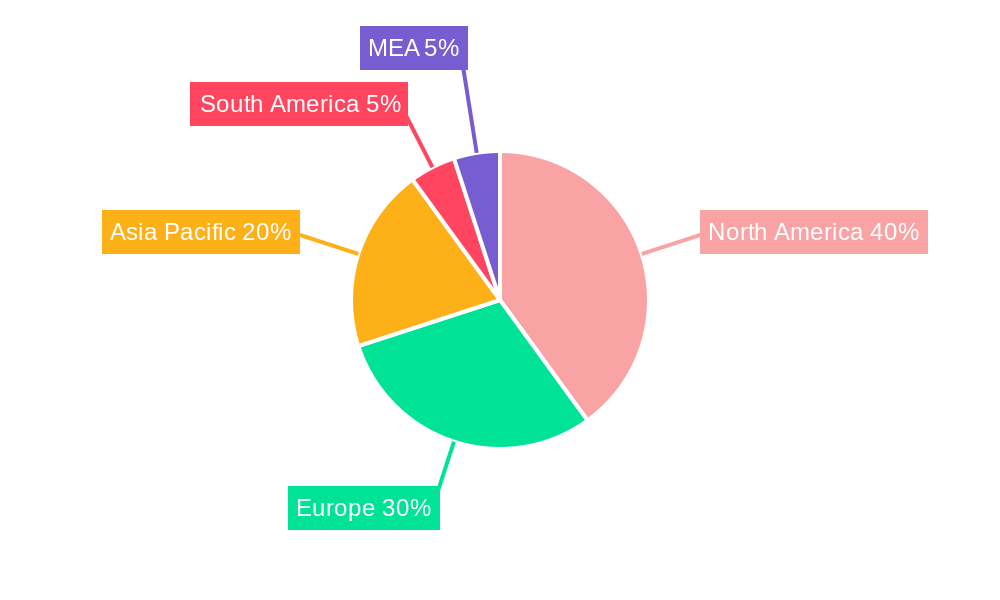
The vein illuminator market, currently valued at $339.29 million in 2025, is experiencing robust growth, projected to expand at a compound annual growth rate (CAGR) of 22.77% from 2025 to 2033. This rapid expansion is driven by several key factors. Firstly, the increasing prevalence of chronic diseases requiring frequent intravenous (IV) therapy and blood draws fuels demand for accurate and efficient vein visualization technologies. Secondly, advancements in near-infrared (NIR) imaging technology are leading to more compact, portable, and user-friendly vein illuminators, improving accessibility and adoption across various healthcare settings. Furthermore, the growing preference for minimally invasive procedures and a rising focus on patient comfort are contributing to the market's growth. The market is segmented by application (venipuncture assistance, IV access, sclerotherapy, and other applications) and end-user (hospitals, blood camps, rehabilitation centers, academic institutions, paramedic applications, and other end-users). North America currently holds a significant market share, driven by high healthcare expenditure and technological advancements, but the Asia-Pacific region is anticipated to witness substantial growth owing to rising healthcare infrastructure development and increasing awareness of advanced medical technologies. Competitive landscape analysis reveals key players such as AccuVein Inc., Christie Medical Holdings Inc., and others actively investing in R&D and strategic collaborations to maintain their market positions.
The restraints to market growth primarily involve the high initial investment cost associated with purchasing vein illuminators, particularly for smaller clinics and healthcare facilities. However, the long-term cost-effectiveness of reducing complications and improving patient satisfaction is expected to mitigate this factor. Furthermore, potential regulatory hurdles and the need for skilled personnel for operation could pose challenges. Nevertheless, the overall market outlook remains positive, driven by consistent technological innovation, increasing healthcare spending globally, and the growing need for efficient and less invasive medical procedures. The market is expected to witness significant expansion across all major geographical regions in the coming years, with continued innovation shaping the future of vein visualization technology.
Vein Illuminator Industry Market Report: 2019-2033
This comprehensive report provides a detailed analysis of the Vein Illuminator industry, encompassing market dynamics, growth trends, competitive landscape, and future outlook. The report covers the period from 2019 to 2033, with 2025 serving as the base and estimated year. The analysis delves into key segments – by application (Venipuncture Assistance, IV Access, Sclerotherapy, Other Applications) and by end-user (Hospital, Blood Camp, Rehabilitation, Academic Institution, Parademic Application, Other End Users) – providing granular insights for informed decision-making. The total market size is projected to reach xx Million units by 2033.
Vein Illuminator Industry Market Dynamics & Structure
The vein illuminator market is characterized by moderate concentration, with key players vying for market share. Technological innovation, primarily driven by advancements in near-infrared (NIR) imaging and image processing, is a major growth driver. Stringent regulatory approvals (e.g., FDA clearance in the US) pose significant hurdles for new entrants. The market also faces competition from alternative techniques for vein visualization. M&A activity has been relatively low in recent years, suggesting a focus on organic growth among established players. End-user demographics are expanding with the aging population and rising incidence of chronic diseases requiring frequent intravenous treatments.
- Market Concentration: Moderately concentrated, with top 5 players holding approximately xx% market share in 2025.
- Technological Innovation: Advancements in NIR technology, miniaturization, and improved image quality are key drivers.
- Regulatory Framework: Stringent regulatory approvals (e.g., FDA, CE Mark) impact market entry and growth.
- Competitive Substitutes: Traditional methods of vein location, ultrasound, and other imaging techniques present competition.
- M&A Trends: Relatively low M&A activity observed during the historical period (2019-2024), with approximately xx deals.
- End-User Demographics: Aging population and increase in chronic diseases are major drivers.
Vein Illuminator Industry Growth Trends & Insights
The vein illuminator market experienced a CAGR of xx% during the historical period (2019-2024), primarily fueled by increasing demand for minimally invasive procedures, improved patient comfort, and reduced procedure times. Adoption rates have been steadily increasing, particularly in hospitals and blood banks, driven by cost-effectiveness and enhanced efficiency. Technological disruptions, such as the introduction of wireless and portable devices, are further boosting market growth. Shifting consumer preferences towards minimally invasive techniques and improved patient experience are influencing market expansion. The market penetration rate was estimated at xx% in 2025 and is projected to reach xx% by 2033.
(Note: This section requires data to populate the specific metrics - CAGR, Market Penetration, etc. Replace 'xxx' with the relevant data source.)
Dominant Regions, Countries, or Segments in Vein Illuminator Industry
North America currently dominates the vein illuminator market, owing to high healthcare expenditure, advanced medical infrastructure, and early adoption of advanced technologies. Within applications, Venipuncture Assistance holds the largest market share, driven by the high volume of blood draws across various healthcare settings. Hospitals remain the primary end-users, accounting for the largest segment. However, growth is anticipated in other end-user segments such as parademic applications driven by increasing demand for efficient and safe IV access in emergency situations.
- North America Dominance: High healthcare spending, advanced infrastructure, early technology adoption.
- Venipuncture Assistance: Largest application segment due to high volume of blood draws.
- Hospital Segment: Largest end-user segment, driven by high procedure volume.
- Parademic Application Growth: Increasing demand for efficient and safe IV access in emergencies.
- European Market: Growing steadily due to increased focus on improving healthcare efficiency and patient care.
Vein Illuminator Industry Product Landscape
Vein illuminators range from simple handheld devices to advanced systems with integrated imaging software. Key product innovations include wireless capabilities, improved image resolution, ergonomic designs, and integration with electronic health records (EHR). Unique selling propositions emphasize ease of use, improved accuracy, reduced procedure times, and enhanced patient comfort. Technological advancements focus on improving the sensitivity and specificity of vein detection, leading to a reduction in needle insertion attempts.
Key Drivers, Barriers & Challenges in Vein Illuminator Industry
Key Drivers: Increasing demand for minimally invasive procedures, technological advancements improving accuracy and ease of use, rising healthcare expenditure, and growing geriatric population.
Challenges: High initial investment costs, competition from alternative vein visualization methods, stringent regulatory approvals, and the potential for device malfunction or inaccurate readings which may lead to xx Million units loss per year.
Emerging Opportunities in Vein Illuminator Industry
Untapped markets in developing economies, increasing demand for point-of-care diagnostics, integration with telemedicine platforms, and development of portable and cost-effective devices represent significant opportunities. The rising demand for home healthcare will also spur growth in portable vein illuminators. New applications in dermatology and aesthetic procedures are also emerging.
Growth Accelerators in the Vein Illuminator Industry Industry
Technological breakthroughs in image processing, strategic partnerships between device manufacturers and healthcare providers, and market expansion into emerging economies are key growth accelerators. Furthermore, the development of innovative applications (e.g., use in veterinary medicine) and improved reimbursement policies will accelerate market growth.
Key Players Shaping the Vein Illuminator Industry Market
- AccuVein Inc
- Cambridge Medical (Asia) Private Ltd
- Christie Medical Holdings Inc
- Near Infrared Imaging Inc
- Sharn Anesthesia
- TransLite LLC
- VueTek Scientific LLC
- Venoscope LLC
- Zd Medical Inc
Notable Milestones in Vein Illuminator Industry Sector
- 2020: AccuVein Inc. launches a new generation of vein illuminators with improved image quality.
- 2022: Zd Medical Inc. receives FDA clearance for a novel vein illumination technology.
- 2023: A strategic partnership is formed between Christie Medical Holdings Inc and a major hospital system.
- (Add further milestones with dates and descriptions)
In-Depth Vein Illuminator Industry Market Outlook
The vein illuminator market is poised for substantial growth over the forecast period (2025-2033), driven by technological advancements, increasing adoption rates, and expansion into new markets. Strategic partnerships and innovative product development will be crucial for sustained growth. The market is expected to witness continued consolidation, with larger players acquiring smaller companies to expand their product portfolio and market reach. Focus on improving device performance, reducing costs, and expanding into new applications will be critical for success in this dynamic and rapidly evolving market.
Vein Illuminator Industry Segmentation
-
1. Application
- 1.1. Venipuncture Assistance
- 1.2. IV Access
- 1.3. Sclerotherapy
- 1.4. Other Applications
-
2. End User
- 2.1. Hospital
- 2.2. Blood Camp
- 2.3. Rehabilitation
- 2.4. Academic Institution
- 2.5. Parademic Application
- 2.6. Other End Users
Vein Illuminator Industry Segmentation By Geography
- 1. North America
- 2. Europe
- 3. Asia Pacific
- 4. Latin America
- 5. Middle East
Vein Illuminator Industry REPORT HIGHLIGHTS
| Aspects | Details |
|---|---|
| Study Period | 2019-2033 |
| Base Year | 2024 |
| Estimated Year | 2025 |
| Forecast Period | 2025-2033 |
| Historical Period | 2019-2024 |
| Growth Rate | CAGR of 22.77% from 2019-2033 |
| Segmentation |
|
Table of Contents
- 1. Introduction
- 1.1. Research Scope
- 1.2. Market Segmentation
- 1.3. Research Methodology
- 1.4. Definitions and Assumptions
- 2. Executive Summary
- 2.1. Introduction
- 3. Market Dynamics
- 3.1. Introduction
- 3.2. Market Drivers
- 3.2.1. ; Increased Success Rate of Blood Draw at First Attempt; Increased Patient Satisfaction
- 3.3. Market Restrains
- 3.3.1. ; Higher Costs
- 3.4. Market Trends
- 3.4.1. Growing Healthcare Spending and Equipment Market Expected to Drive the Market
- 4. Market Factor Analysis
- 4.1. Porters Five Forces
- 4.2. Supply/Value Chain
- 4.3. PESTEL analysis
- 4.4. Market Entropy
- 4.5. Patent/Trademark Analysis
- 5. Global Vein Illuminator Industry Analysis, Insights and Forecast, 2019-2031
- 5.1. Market Analysis, Insights and Forecast - by Application
- 5.1.1. Venipuncture Assistance
- 5.1.2. IV Access
- 5.1.3. Sclerotherapy
- 5.1.4. Other Applications
- 5.2. Market Analysis, Insights and Forecast - by End User
- 5.2.1. Hospital
- 5.2.2. Blood Camp
- 5.2.3. Rehabilitation
- 5.2.4. Academic Institution
- 5.2.5. Parademic Application
- 5.2.6. Other End Users
- 5.3. Market Analysis, Insights and Forecast - by Region
- 5.3.1. North America
- 5.3.2. Europe
- 5.3.3. Asia Pacific
- 5.3.4. Latin America
- 5.3.5. Middle East
- 5.1. Market Analysis, Insights and Forecast - by Application
- 6. North America Vein Illuminator Industry Analysis, Insights and Forecast, 2019-2031
- 6.1. Market Analysis, Insights and Forecast - by Application
- 6.1.1. Venipuncture Assistance
- 6.1.2. IV Access
- 6.1.3. Sclerotherapy
- 6.1.4. Other Applications
- 6.2. Market Analysis, Insights and Forecast - by End User
- 6.2.1. Hospital
- 6.2.2. Blood Camp
- 6.2.3. Rehabilitation
- 6.2.4. Academic Institution
- 6.2.5. Parademic Application
- 6.2.6. Other End Users
- 6.1. Market Analysis, Insights and Forecast - by Application
- 7. Europe Vein Illuminator Industry Analysis, Insights and Forecast, 2019-2031
- 7.1. Market Analysis, Insights and Forecast - by Application
- 7.1.1. Venipuncture Assistance
- 7.1.2. IV Access
- 7.1.3. Sclerotherapy
- 7.1.4. Other Applications
- 7.2. Market Analysis, Insights and Forecast - by End User
- 7.2.1. Hospital
- 7.2.2. Blood Camp
- 7.2.3. Rehabilitation
- 7.2.4. Academic Institution
- 7.2.5. Parademic Application
- 7.2.6. Other End Users
- 7.1. Market Analysis, Insights and Forecast - by Application
- 8. Asia Pacific Vein Illuminator Industry Analysis, Insights and Forecast, 2019-2031
- 8.1. Market Analysis, Insights and Forecast - by Application
- 8.1.1. Venipuncture Assistance
- 8.1.2. IV Access
- 8.1.3. Sclerotherapy
- 8.1.4. Other Applications
- 8.2. Market Analysis, Insights and Forecast - by End User
- 8.2.1. Hospital
- 8.2.2. Blood Camp
- 8.2.3. Rehabilitation
- 8.2.4. Academic Institution
- 8.2.5. Parademic Application
- 8.2.6. Other End Users
- 8.1. Market Analysis, Insights and Forecast - by Application
- 9. Latin America Vein Illuminator Industry Analysis, Insights and Forecast, 2019-2031
- 9.1. Market Analysis, Insights and Forecast - by Application
- 9.1.1. Venipuncture Assistance
- 9.1.2. IV Access
- 9.1.3. Sclerotherapy
- 9.1.4. Other Applications
- 9.2. Market Analysis, Insights and Forecast - by End User
- 9.2.1. Hospital
- 9.2.2. Blood Camp
- 9.2.3. Rehabilitation
- 9.2.4. Academic Institution
- 9.2.5. Parademic Application
- 9.2.6. Other End Users
- 9.1. Market Analysis, Insights and Forecast - by Application
- 10. Middle East Vein Illuminator Industry Analysis, Insights and Forecast, 2019-2031
- 10.1. Market Analysis, Insights and Forecast - by Application
- 10.1.1. Venipuncture Assistance
- 10.1.2. IV Access
- 10.1.3. Sclerotherapy
- 10.1.4. Other Applications
- 10.2. Market Analysis, Insights and Forecast - by End User
- 10.2.1. Hospital
- 10.2.2. Blood Camp
- 10.2.3. Rehabilitation
- 10.2.4. Academic Institution
- 10.2.5. Parademic Application
- 10.2.6. Other End Users
- 10.1. Market Analysis, Insights and Forecast - by Application
- 11. North America Vein Illuminator Industry Analysis, Insights and Forecast, 2019-2031
- 11.1. Market Analysis, Insights and Forecast - By Country/Sub-region
- 11.1.1 United States
- 11.1.2 Canada
- 11.1.3 Mexico
- 12. Europe Vein Illuminator Industry Analysis, Insights and Forecast, 2019-2031
- 12.1. Market Analysis, Insights and Forecast - By Country/Sub-region
- 12.1.1 Germany
- 12.1.2 United Kingdom
- 12.1.3 France
- 12.1.4 Spain
- 12.1.5 Italy
- 12.1.6 Spain
- 12.1.7 Belgium
- 12.1.8 Netherland
- 12.1.9 Nordics
- 12.1.10 Rest of Europe
- 13. Asia Pacific Vein Illuminator Industry Analysis, Insights and Forecast, 2019-2031
- 13.1. Market Analysis, Insights and Forecast - By Country/Sub-region
- 13.1.1 China
- 13.1.2 Japan
- 13.1.3 India
- 13.1.4 South Korea
- 13.1.5 Southeast Asia
- 13.1.6 Australia
- 13.1.7 Indonesia
- 13.1.8 Phillipes
- 13.1.9 Singapore
- 13.1.10 Thailandc
- 13.1.11 Rest of Asia Pacific
- 14. South America Vein Illuminator Industry Analysis, Insights and Forecast, 2019-2031
- 14.1. Market Analysis, Insights and Forecast - By Country/Sub-region
- 14.1.1 Brazil
- 14.1.2 Argentina
- 14.1.3 Peru
- 14.1.4 Chile
- 14.1.5 Colombia
- 14.1.6 Ecuador
- 14.1.7 Venezuela
- 14.1.8 Rest of South America
- 15. North America Vein Illuminator Industry Analysis, Insights and Forecast, 2019-2031
- 15.1. Market Analysis, Insights and Forecast - By Country/Sub-region
- 15.1.1 United States
- 15.1.2 Canada
- 15.1.3 Mexico
- 16. MEA Vein Illuminator Industry Analysis, Insights and Forecast, 2019-2031
- 16.1. Market Analysis, Insights and Forecast - By Country/Sub-region
- 16.1.1 United Arab Emirates
- 16.1.2 Saudi Arabia
- 16.1.3 South Africa
- 16.1.4 Rest of Middle East and Africa
- 17. Competitive Analysis
- 17.1. Global Market Share Analysis 2024
- 17.2. Company Profiles
- 17.2.1 Cambridge Medical (Asia) Private Ltd
- 17.2.1.1. Overview
- 17.2.1.2. Products
- 17.2.1.3. SWOT Analysis
- 17.2.1.4. Recent Developments
- 17.2.1.5. Financials (Based on Availability)
- 17.2.2 Christie Medical Holdings Inc
- 17.2.2.1. Overview
- 17.2.2.2. Products
- 17.2.2.3. SWOT Analysis
- 17.2.2.4. Recent Developments
- 17.2.2.5. Financials (Based on Availability)
- 17.2.3 Zd Medical Inc
- 17.2.3.1. Overview
- 17.2.3.2. Products
- 17.2.3.3. SWOT Analysis
- 17.2.3.4. Recent Developments
- 17.2.3.5. Financials (Based on Availability)
- 17.2.4 Venoscope LLC
- 17.2.4.1. Overview
- 17.2.4.2. Products
- 17.2.4.3. SWOT Analysis
- 17.2.4.4. Recent Developments
- 17.2.4.5. Financials (Based on Availability)
- 17.2.5 TransLite LLC
- 17.2.5.1. Overview
- 17.2.5.2. Products
- 17.2.5.3. SWOT Analysis
- 17.2.5.4. Recent Developments
- 17.2.5.5. Financials (Based on Availability)
- 17.2.6 VueTek Scientific LLC
- 17.2.6.1. Overview
- 17.2.6.2. Products
- 17.2.6.3. SWOT Analysis
- 17.2.6.4. Recent Developments
- 17.2.6.5. Financials (Based on Availability)
- 17.2.7 AccuVein Inc
- 17.2.7.1. Overview
- 17.2.7.2. Products
- 17.2.7.3. SWOT Analysis
- 17.2.7.4. Recent Developments
- 17.2.7.5. Financials (Based on Availability)
- 17.2.8 Sharn Anesthesia
- 17.2.8.1. Overview
- 17.2.8.2. Products
- 17.2.8.3. SWOT Analysis
- 17.2.8.4. Recent Developments
- 17.2.8.5. Financials (Based on Availability)
- 17.2.9 Near Infrared Imaging Inc
- 17.2.9.1. Overview
- 17.2.9.2. Products
- 17.2.9.3. SWOT Analysis
- 17.2.9.4. Recent Developments
- 17.2.9.5. Financials (Based on Availability)
- 17.2.1 Cambridge Medical (Asia) Private Ltd
List of Figures
- Figure 1: Global Vein Illuminator Industry Revenue Breakdown (Million, %) by Region 2024 & 2032
- Figure 2: Global Vein Illuminator Industry Volume Breakdown (K Unit, %) by Region 2024 & 2032
- Figure 3: North America Vein Illuminator Industry Revenue (Million), by Country 2024 & 2032
- Figure 4: North America Vein Illuminator Industry Volume (K Unit), by Country 2024 & 2032
- Figure 5: North America Vein Illuminator Industry Revenue Share (%), by Country 2024 & 2032
- Figure 6: North America Vein Illuminator Industry Volume Share (%), by Country 2024 & 2032
- Figure 7: Europe Vein Illuminator Industry Revenue (Million), by Country 2024 & 2032
- Figure 8: Europe Vein Illuminator Industry Volume (K Unit), by Country 2024 & 2032
- Figure 9: Europe Vein Illuminator Industry Revenue Share (%), by Country 2024 & 2032
- Figure 10: Europe Vein Illuminator Industry Volume Share (%), by Country 2024 & 2032
- Figure 11: Asia Pacific Vein Illuminator Industry Revenue (Million), by Country 2024 & 2032
- Figure 12: Asia Pacific Vein Illuminator Industry Volume (K Unit), by Country 2024 & 2032
- Figure 13: Asia Pacific Vein Illuminator Industry Revenue Share (%), by Country 2024 & 2032
- Figure 14: Asia Pacific Vein Illuminator Industry Volume Share (%), by Country 2024 & 2032
- Figure 15: South America Vein Illuminator Industry Revenue (Million), by Country 2024 & 2032
- Figure 16: South America Vein Illuminator Industry Volume (K Unit), by Country 2024 & 2032
- Figure 17: South America Vein Illuminator Industry Revenue Share (%), by Country 2024 & 2032
- Figure 18: South America Vein Illuminator Industry Volume Share (%), by Country 2024 & 2032
- Figure 19: North America Vein Illuminator Industry Revenue (Million), by Country 2024 & 2032
- Figure 20: North America Vein Illuminator Industry Volume (K Unit), by Country 2024 & 2032
- Figure 21: North America Vein Illuminator Industry Revenue Share (%), by Country 2024 & 2032
- Figure 22: North America Vein Illuminator Industry Volume Share (%), by Country 2024 & 2032
- Figure 23: MEA Vein Illuminator Industry Revenue (Million), by Country 2024 & 2032
- Figure 24: MEA Vein Illuminator Industry Volume (K Unit), by Country 2024 & 2032
- Figure 25: MEA Vein Illuminator Industry Revenue Share (%), by Country 2024 & 2032
- Figure 26: MEA Vein Illuminator Industry Volume Share (%), by Country 2024 & 2032
- Figure 27: North America Vein Illuminator Industry Revenue (Million), by Application 2024 & 2032
- Figure 28: North America Vein Illuminator Industry Volume (K Unit), by Application 2024 & 2032
- Figure 29: North America Vein Illuminator Industry Revenue Share (%), by Application 2024 & 2032
- Figure 30: North America Vein Illuminator Industry Volume Share (%), by Application 2024 & 2032
- Figure 31: North America Vein Illuminator Industry Revenue (Million), by End User 2024 & 2032
- Figure 32: North America Vein Illuminator Industry Volume (K Unit), by End User 2024 & 2032
- Figure 33: North America Vein Illuminator Industry Revenue Share (%), by End User 2024 & 2032
- Figure 34: North America Vein Illuminator Industry Volume Share (%), by End User 2024 & 2032
- Figure 35: North America Vein Illuminator Industry Revenue (Million), by Country 2024 & 2032
- Figure 36: North America Vein Illuminator Industry Volume (K Unit), by Country 2024 & 2032
- Figure 37: North America Vein Illuminator Industry Revenue Share (%), by Country 2024 & 2032
- Figure 38: North America Vein Illuminator Industry Volume Share (%), by Country 2024 & 2032
- Figure 39: Europe Vein Illuminator Industry Revenue (Million), by Application 2024 & 2032
- Figure 40: Europe Vein Illuminator Industry Volume (K Unit), by Application 2024 & 2032
- Figure 41: Europe Vein Illuminator Industry Revenue Share (%), by Application 2024 & 2032
- Figure 42: Europe Vein Illuminator Industry Volume Share (%), by Application 2024 & 2032
- Figure 43: Europe Vein Illuminator Industry Revenue (Million), by End User 2024 & 2032
- Figure 44: Europe Vein Illuminator Industry Volume (K Unit), by End User 2024 & 2032
- Figure 45: Europe Vein Illuminator Industry Revenue Share (%), by End User 2024 & 2032
- Figure 46: Europe Vein Illuminator Industry Volume Share (%), by End User 2024 & 2032
- Figure 47: Europe Vein Illuminator Industry Revenue (Million), by Country 2024 & 2032
- Figure 48: Europe Vein Illuminator Industry Volume (K Unit), by Country 2024 & 2032
- Figure 49: Europe Vein Illuminator Industry Revenue Share (%), by Country 2024 & 2032
- Figure 50: Europe Vein Illuminator Industry Volume Share (%), by Country 2024 & 2032
- Figure 51: Asia Pacific Vein Illuminator Industry Revenue (Million), by Application 2024 & 2032
- Figure 52: Asia Pacific Vein Illuminator Industry Volume (K Unit), by Application 2024 & 2032
- Figure 53: Asia Pacific Vein Illuminator Industry Revenue Share (%), by Application 2024 & 2032
- Figure 54: Asia Pacific Vein Illuminator Industry Volume Share (%), by Application 2024 & 2032
- Figure 55: Asia Pacific Vein Illuminator Industry Revenue (Million), by End User 2024 & 2032
- Figure 56: Asia Pacific Vein Illuminator Industry Volume (K Unit), by End User 2024 & 2032
- Figure 57: Asia Pacific Vein Illuminator Industry Revenue Share (%), by End User 2024 & 2032
- Figure 58: Asia Pacific Vein Illuminator Industry Volume Share (%), by End User 2024 & 2032
- Figure 59: Asia Pacific Vein Illuminator Industry Revenue (Million), by Country 2024 & 2032
- Figure 60: Asia Pacific Vein Illuminator Industry Volume (K Unit), by Country 2024 & 2032
- Figure 61: Asia Pacific Vein Illuminator Industry Revenue Share (%), by Country 2024 & 2032
- Figure 62: Asia Pacific Vein Illuminator Industry Volume Share (%), by Country 2024 & 2032
- Figure 63: Latin America Vein Illuminator Industry Revenue (Million), by Application 2024 & 2032
- Figure 64: Latin America Vein Illuminator Industry Volume (K Unit), by Application 2024 & 2032
- Figure 65: Latin America Vein Illuminator Industry Revenue Share (%), by Application 2024 & 2032
- Figure 66: Latin America Vein Illuminator Industry Volume Share (%), by Application 2024 & 2032
- Figure 67: Latin America Vein Illuminator Industry Revenue (Million), by End User 2024 & 2032
- Figure 68: Latin America Vein Illuminator Industry Volume (K Unit), by End User 2024 & 2032
- Figure 69: Latin America Vein Illuminator Industry Revenue Share (%), by End User 2024 & 2032
- Figure 70: Latin America Vein Illuminator Industry Volume Share (%), by End User 2024 & 2032
- Figure 71: Latin America Vein Illuminator Industry Revenue (Million), by Country 2024 & 2032
- Figure 72: Latin America Vein Illuminator Industry Volume (K Unit), by Country 2024 & 2032
- Figure 73: Latin America Vein Illuminator Industry Revenue Share (%), by Country 2024 & 2032
- Figure 74: Latin America Vein Illuminator Industry Volume Share (%), by Country 2024 & 2032
- Figure 75: Middle East Vein Illuminator Industry Revenue (Million), by Application 2024 & 2032
- Figure 76: Middle East Vein Illuminator Industry Volume (K Unit), by Application 2024 & 2032
- Figure 77: Middle East Vein Illuminator Industry Revenue Share (%), by Application 2024 & 2032
- Figure 78: Middle East Vein Illuminator Industry Volume Share (%), by Application 2024 & 2032
- Figure 79: Middle East Vein Illuminator Industry Revenue (Million), by End User 2024 & 2032
- Figure 80: Middle East Vein Illuminator Industry Volume (K Unit), by End User 2024 & 2032
- Figure 81: Middle East Vein Illuminator Industry Revenue Share (%), by End User 2024 & 2032
- Figure 82: Middle East Vein Illuminator Industry Volume Share (%), by End User 2024 & 2032
- Figure 83: Middle East Vein Illuminator Industry Revenue (Million), by Country 2024 & 2032
- Figure 84: Middle East Vein Illuminator Industry Volume (K Unit), by Country 2024 & 2032
- Figure 85: Middle East Vein Illuminator Industry Revenue Share (%), by Country 2024 & 2032
- Figure 86: Middle East Vein Illuminator Industry Volume Share (%), by Country 2024 & 2032
List of Tables
- Table 1: Global Vein Illuminator Industry Revenue Million Forecast, by Region 2019 & 2032
- Table 2: Global Vein Illuminator Industry Volume K Unit Forecast, by Region 2019 & 2032
- Table 3: Global Vein Illuminator Industry Revenue Million Forecast, by Application 2019 & 2032
- Table 4: Global Vein Illuminator Industry Volume K Unit Forecast, by Application 2019 & 2032
- Table 5: Global Vein Illuminator Industry Revenue Million Forecast, by End User 2019 & 2032
- Table 6: Global Vein Illuminator Industry Volume K Unit Forecast, by End User 2019 & 2032
- Table 7: Global Vein Illuminator Industry Revenue Million Forecast, by Region 2019 & 2032
- Table 8: Global Vein Illuminator Industry Volume K Unit Forecast, by Region 2019 & 2032
- Table 9: Global Vein Illuminator Industry Revenue Million Forecast, by Country 2019 & 2032
- Table 10: Global Vein Illuminator Industry Volume K Unit Forecast, by Country 2019 & 2032
- Table 11: United States Vein Illuminator Industry Revenue (Million) Forecast, by Application 2019 & 2032
- Table 12: United States Vein Illuminator Industry Volume (K Unit) Forecast, by Application 2019 & 2032
- Table 13: Canada Vein Illuminator Industry Revenue (Million) Forecast, by Application 2019 & 2032
- Table 14: Canada Vein Illuminator Industry Volume (K Unit) Forecast, by Application 2019 & 2032
- Table 15: Mexico Vein Illuminator Industry Revenue (Million) Forecast, by Application 2019 & 2032
- Table 16: Mexico Vein Illuminator Industry Volume (K Unit) Forecast, by Application 2019 & 2032
- Table 17: Global Vein Illuminator Industry Revenue Million Forecast, by Country 2019 & 2032
- Table 18: Global Vein Illuminator Industry Volume K Unit Forecast, by Country 2019 & 2032
- Table 19: Germany Vein Illuminator Industry Revenue (Million) Forecast, by Application 2019 & 2032
- Table 20: Germany Vein Illuminator Industry Volume (K Unit) Forecast, by Application 2019 & 2032
- Table 21: United Kingdom Vein Illuminator Industry Revenue (Million) Forecast, by Application 2019 & 2032
- Table 22: United Kingdom Vein Illuminator Industry Volume (K Unit) Forecast, by Application 2019 & 2032
- Table 23: France Vein Illuminator Industry Revenue (Million) Forecast, by Application 2019 & 2032
- Table 24: France Vein Illuminator Industry Volume (K Unit) Forecast, by Application 2019 & 2032
- Table 25: Spain Vein Illuminator Industry Revenue (Million) Forecast, by Application 2019 & 2032
- Table 26: Spain Vein Illuminator Industry Volume (K Unit) Forecast, by Application 2019 & 2032
- Table 27: Italy Vein Illuminator Industry Revenue (Million) Forecast, by Application 2019 & 2032
- Table 28: Italy Vein Illuminator Industry Volume (K Unit) Forecast, by Application 2019 & 2032
- Table 29: Spain Vein Illuminator Industry Revenue (Million) Forecast, by Application 2019 & 2032
- Table 30: Spain Vein Illuminator Industry Volume (K Unit) Forecast, by Application 2019 & 2032
- Table 31: Belgium Vein Illuminator Industry Revenue (Million) Forecast, by Application 2019 & 2032
- Table 32: Belgium Vein Illuminator Industry Volume (K Unit) Forecast, by Application 2019 & 2032
- Table 33: Netherland Vein Illuminator Industry Revenue (Million) Forecast, by Application 2019 & 2032
- Table 34: Netherland Vein Illuminator Industry Volume (K Unit) Forecast, by Application 2019 & 2032
- Table 35: Nordics Vein Illuminator Industry Revenue (Million) Forecast, by Application 2019 & 2032
- Table 36: Nordics Vein Illuminator Industry Volume (K Unit) Forecast, by Application 2019 & 2032
- Table 37: Rest of Europe Vein Illuminator Industry Revenue (Million) Forecast, by Application 2019 & 2032
- Table 38: Rest of Europe Vein Illuminator Industry Volume (K Unit) Forecast, by Application 2019 & 2032
- Table 39: Global Vein Illuminator Industry Revenue Million Forecast, by Country 2019 & 2032
- Table 40: Global Vein Illuminator Industry Volume K Unit Forecast, by Country 2019 & 2032
- Table 41: China Vein Illuminator Industry Revenue (Million) Forecast, by Application 2019 & 2032
- Table 42: China Vein Illuminator Industry Volume (K Unit) Forecast, by Application 2019 & 2032
- Table 43: Japan Vein Illuminator Industry Revenue (Million) Forecast, by Application 2019 & 2032
- Table 44: Japan Vein Illuminator Industry Volume (K Unit) Forecast, by Application 2019 & 2032
- Table 45: India Vein Illuminator Industry Revenue (Million) Forecast, by Application 2019 & 2032
- Table 46: India Vein Illuminator Industry Volume (K Unit) Forecast, by Application 2019 & 2032
- Table 47: South Korea Vein Illuminator Industry Revenue (Million) Forecast, by Application 2019 & 2032
- Table 48: South Korea Vein Illuminator Industry Volume (K Unit) Forecast, by Application 2019 & 2032
- Table 49: Southeast Asia Vein Illuminator Industry Revenue (Million) Forecast, by Application 2019 & 2032
- Table 50: Southeast Asia Vein Illuminator Industry Volume (K Unit) Forecast, by Application 2019 & 2032
- Table 51: Australia Vein Illuminator Industry Revenue (Million) Forecast, by Application 2019 & 2032
- Table 52: Australia Vein Illuminator Industry Volume (K Unit) Forecast, by Application 2019 & 2032
- Table 53: Indonesia Vein Illuminator Industry Revenue (Million) Forecast, by Application 2019 & 2032
- Table 54: Indonesia Vein Illuminator Industry Volume (K Unit) Forecast, by Application 2019 & 2032
- Table 55: Phillipes Vein Illuminator Industry Revenue (Million) Forecast, by Application 2019 & 2032
- Table 56: Phillipes Vein Illuminator Industry Volume (K Unit) Forecast, by Application 2019 & 2032
- Table 57: Singapore Vein Illuminator Industry Revenue (Million) Forecast, by Application 2019 & 2032
- Table 58: Singapore Vein Illuminator Industry Volume (K Unit) Forecast, by Application 2019 & 2032
- Table 59: Thailandc Vein Illuminator Industry Revenue (Million) Forecast, by Application 2019 & 2032
- Table 60: Thailandc Vein Illuminator Industry Volume (K Unit) Forecast, by Application 2019 & 2032
- Table 61: Rest of Asia Pacific Vein Illuminator Industry Revenue (Million) Forecast, by Application 2019 & 2032
- Table 62: Rest of Asia Pacific Vein Illuminator Industry Volume (K Unit) Forecast, by Application 2019 & 2032
- Table 63: Global Vein Illuminator Industry Revenue Million Forecast, by Country 2019 & 2032
- Table 64: Global Vein Illuminator Industry Volume K Unit Forecast, by Country 2019 & 2032
- Table 65: Brazil Vein Illuminator Industry Revenue (Million) Forecast, by Application 2019 & 2032
- Table 66: Brazil Vein Illuminator Industry Volume (K Unit) Forecast, by Application 2019 & 2032
- Table 67: Argentina Vein Illuminator Industry Revenue (Million) Forecast, by Application 2019 & 2032
- Table 68: Argentina Vein Illuminator Industry Volume (K Unit) Forecast, by Application 2019 & 2032
- Table 69: Peru Vein Illuminator Industry Revenue (Million) Forecast, by Application 2019 & 2032
- Table 70: Peru Vein Illuminator Industry Volume (K Unit) Forecast, by Application 2019 & 2032
- Table 71: Chile Vein Illuminator Industry Revenue (Million) Forecast, by Application 2019 & 2032
- Table 72: Chile Vein Illuminator Industry Volume (K Unit) Forecast, by Application 2019 & 2032
- Table 73: Colombia Vein Illuminator Industry Revenue (Million) Forecast, by Application 2019 & 2032
- Table 74: Colombia Vein Illuminator Industry Volume (K Unit) Forecast, by Application 2019 & 2032
- Table 75: Ecuador Vein Illuminator Industry Revenue (Million) Forecast, by Application 2019 & 2032
- Table 76: Ecuador Vein Illuminator Industry Volume (K Unit) Forecast, by Application 2019 & 2032
- Table 77: Venezuela Vein Illuminator Industry Revenue (Million) Forecast, by Application 2019 & 2032
- Table 78: Venezuela Vein Illuminator Industry Volume (K Unit) Forecast, by Application 2019 & 2032
- Table 79: Rest of South America Vein Illuminator Industry Revenue (Million) Forecast, by Application 2019 & 2032
- Table 80: Rest of South America Vein Illuminator Industry Volume (K Unit) Forecast, by Application 2019 & 2032
- Table 81: Global Vein Illuminator Industry Revenue Million Forecast, by Country 2019 & 2032
- Table 82: Global Vein Illuminator Industry Volume K Unit Forecast, by Country 2019 & 2032
- Table 83: United States Vein Illuminator Industry Revenue (Million) Forecast, by Application 2019 & 2032
- Table 84: United States Vein Illuminator Industry Volume (K Unit) Forecast, by Application 2019 & 2032
- Table 85: Canada Vein Illuminator Industry Revenue (Million) Forecast, by Application 2019 & 2032
- Table 86: Canada Vein Illuminator Industry Volume (K Unit) Forecast, by Application 2019 & 2032
- Table 87: Mexico Vein Illuminator Industry Revenue (Million) Forecast, by Application 2019 & 2032
- Table 88: Mexico Vein Illuminator Industry Volume (K Unit) Forecast, by Application 2019 & 2032
- Table 89: Global Vein Illuminator Industry Revenue Million Forecast, by Country 2019 & 2032
- Table 90: Global Vein Illuminator Industry Volume K Unit Forecast, by Country 2019 & 2032
- Table 91: United Arab Emirates Vein Illuminator Industry Revenue (Million) Forecast, by Application 2019 & 2032
- Table 92: United Arab Emirates Vein Illuminator Industry Volume (K Unit) Forecast, by Application 2019 & 2032
- Table 93: Saudi Arabia Vein Illuminator Industry Revenue (Million) Forecast, by Application 2019 & 2032
- Table 94: Saudi Arabia Vein Illuminator Industry Volume (K Unit) Forecast, by Application 2019 & 2032
- Table 95: South Africa Vein Illuminator Industry Revenue (Million) Forecast, by Application 2019 & 2032
- Table 96: South Africa Vein Illuminator Industry Volume (K Unit) Forecast, by Application 2019 & 2032
- Table 97: Rest of Middle East and Africa Vein Illuminator Industry Revenue (Million) Forecast, by Application 2019 & 2032
- Table 98: Rest of Middle East and Africa Vein Illuminator Industry Volume (K Unit) Forecast, by Application 2019 & 2032
- Table 99: Global Vein Illuminator Industry Revenue Million Forecast, by Application 2019 & 2032
- Table 100: Global Vein Illuminator Industry Volume K Unit Forecast, by Application 2019 & 2032
- Table 101: Global Vein Illuminator Industry Revenue Million Forecast, by End User 2019 & 2032
- Table 102: Global Vein Illuminator Industry Volume K Unit Forecast, by End User 2019 & 2032
- Table 103: Global Vein Illuminator Industry Revenue Million Forecast, by Country 2019 & 2032
- Table 104: Global Vein Illuminator Industry Volume K Unit Forecast, by Country 2019 & 2032
- Table 105: Global Vein Illuminator Industry Revenue Million Forecast, by Application 2019 & 2032
- Table 106: Global Vein Illuminator Industry Volume K Unit Forecast, by Application 2019 & 2032
- Table 107: Global Vein Illuminator Industry Revenue Million Forecast, by End User 2019 & 2032
- Table 108: Global Vein Illuminator Industry Volume K Unit Forecast, by End User 2019 & 2032
- Table 109: Global Vein Illuminator Industry Revenue Million Forecast, by Country 2019 & 2032
- Table 110: Global Vein Illuminator Industry Volume K Unit Forecast, by Country 2019 & 2032
- Table 111: Global Vein Illuminator Industry Revenue Million Forecast, by Application 2019 & 2032
- Table 112: Global Vein Illuminator Industry Volume K Unit Forecast, by Application 2019 & 2032
- Table 113: Global Vein Illuminator Industry Revenue Million Forecast, by End User 2019 & 2032
- Table 114: Global Vein Illuminator Industry Volume K Unit Forecast, by End User 2019 & 2032
- Table 115: Global Vein Illuminator Industry Revenue Million Forecast, by Country 2019 & 2032
- Table 116: Global Vein Illuminator Industry Volume K Unit Forecast, by Country 2019 & 2032
- Table 117: Global Vein Illuminator Industry Revenue Million Forecast, by Application 2019 & 2032
- Table 118: Global Vein Illuminator Industry Volume K Unit Forecast, by Application 2019 & 2032
- Table 119: Global Vein Illuminator Industry Revenue Million Forecast, by End User 2019 & 2032
- Table 120: Global Vein Illuminator Industry Volume K Unit Forecast, by End User 2019 & 2032
- Table 121: Global Vein Illuminator Industry Revenue Million Forecast, by Country 2019 & 2032
- Table 122: Global Vein Illuminator Industry Volume K Unit Forecast, by Country 2019 & 2032
- Table 123: Global Vein Illuminator Industry Revenue Million Forecast, by Application 2019 & 2032
- Table 124: Global Vein Illuminator Industry Volume K Unit Forecast, by Application 2019 & 2032
- Table 125: Global Vein Illuminator Industry Revenue Million Forecast, by End User 2019 & 2032
- Table 126: Global Vein Illuminator Industry Volume K Unit Forecast, by End User 2019 & 2032
- Table 127: Global Vein Illuminator Industry Revenue Million Forecast, by Country 2019 & 2032
- Table 128: Global Vein Illuminator Industry Volume K Unit Forecast, by Country 2019 & 2032
Frequently Asked Questions
1. What is the projected Compound Annual Growth Rate (CAGR) of the Vein Illuminator Industry?
The projected CAGR is approximately 22.77%.
2. Which companies are prominent players in the Vein Illuminator Industry?
Key companies in the market include Cambridge Medical (Asia) Private Ltd, Christie Medical Holdings Inc, Zd Medical Inc, Venoscope LLC, TransLite LLC, VueTek Scientific LLC, AccuVein Inc, Sharn Anesthesia, Near Infrared Imaging Inc.
3. What are the main segments of the Vein Illuminator Industry?
The market segments include Application, End User.
4. Can you provide details about the market size?
The market size is estimated to be USD 339.29 Million as of 2022.
5. What are some drivers contributing to market growth?
; Increased Success Rate of Blood Draw at First Attempt; Increased Patient Satisfaction.
6. What are the notable trends driving market growth?
Growing Healthcare Spending and Equipment Market Expected to Drive the Market.
7. Are there any restraints impacting market growth?
; Higher Costs.
8. Can you provide examples of recent developments in the market?
N/A
9. What pricing options are available for accessing the report?
Pricing options include single-user, multi-user, and enterprise licenses priced at USD 4750, USD 5250, and USD 8750 respectively.
10. Is the market size provided in terms of value or volume?
The market size is provided in terms of value, measured in Million and volume, measured in K Unit.
11. Are there any specific market keywords associated with the report?
Yes, the market keyword associated with the report is "Vein Illuminator Industry," which aids in identifying and referencing the specific market segment covered.
12. How do I determine which pricing option suits my needs best?
The pricing options vary based on user requirements and access needs. Individual users may opt for single-user licenses, while businesses requiring broader access may choose multi-user or enterprise licenses for cost-effective access to the report.
13. Are there any additional resources or data provided in the Vein Illuminator Industry report?
While the report offers comprehensive insights, it's advisable to review the specific contents or supplementary materials provided to ascertain if additional resources or data are available.
14. How can I stay updated on further developments or reports in the Vein Illuminator Industry?
To stay informed about further developments, trends, and reports in the Vein Illuminator Industry, consider subscribing to industry newsletters, following relevant companies and organizations, or regularly checking reputable industry news sources and publications.
Methodology
Step 1 - Identification of Relevant Samples Size from Population Database


Step 2 - Approaches for Defining Global Market Size (Value, Volume* & Price*)

Note*: In applicable scenarios
Step 3 - Data Sources
Primary Research
- Web Analytics
- Survey Reports
- Research Institute
- Latest Research Reports
- Opinion Leaders
Secondary Research
- Annual Reports
- White Paper
- Latest Press Release
- Industry Association
- Paid Database
- Investor Presentations

Step 4 - Data Triangulation
Involves using different sources of information in order to increase the validity of a study
These sources are likely to be stakeholders in a program - participants, other researchers, program staff, other community members, and so on.
Then we put all data in single framework & apply various statistical tools to find out the dynamic on the market.
During the analysis stage, feedback from the stakeholder groups would be compared to determine areas of agreement as well as areas of divergence
