

Key Insights
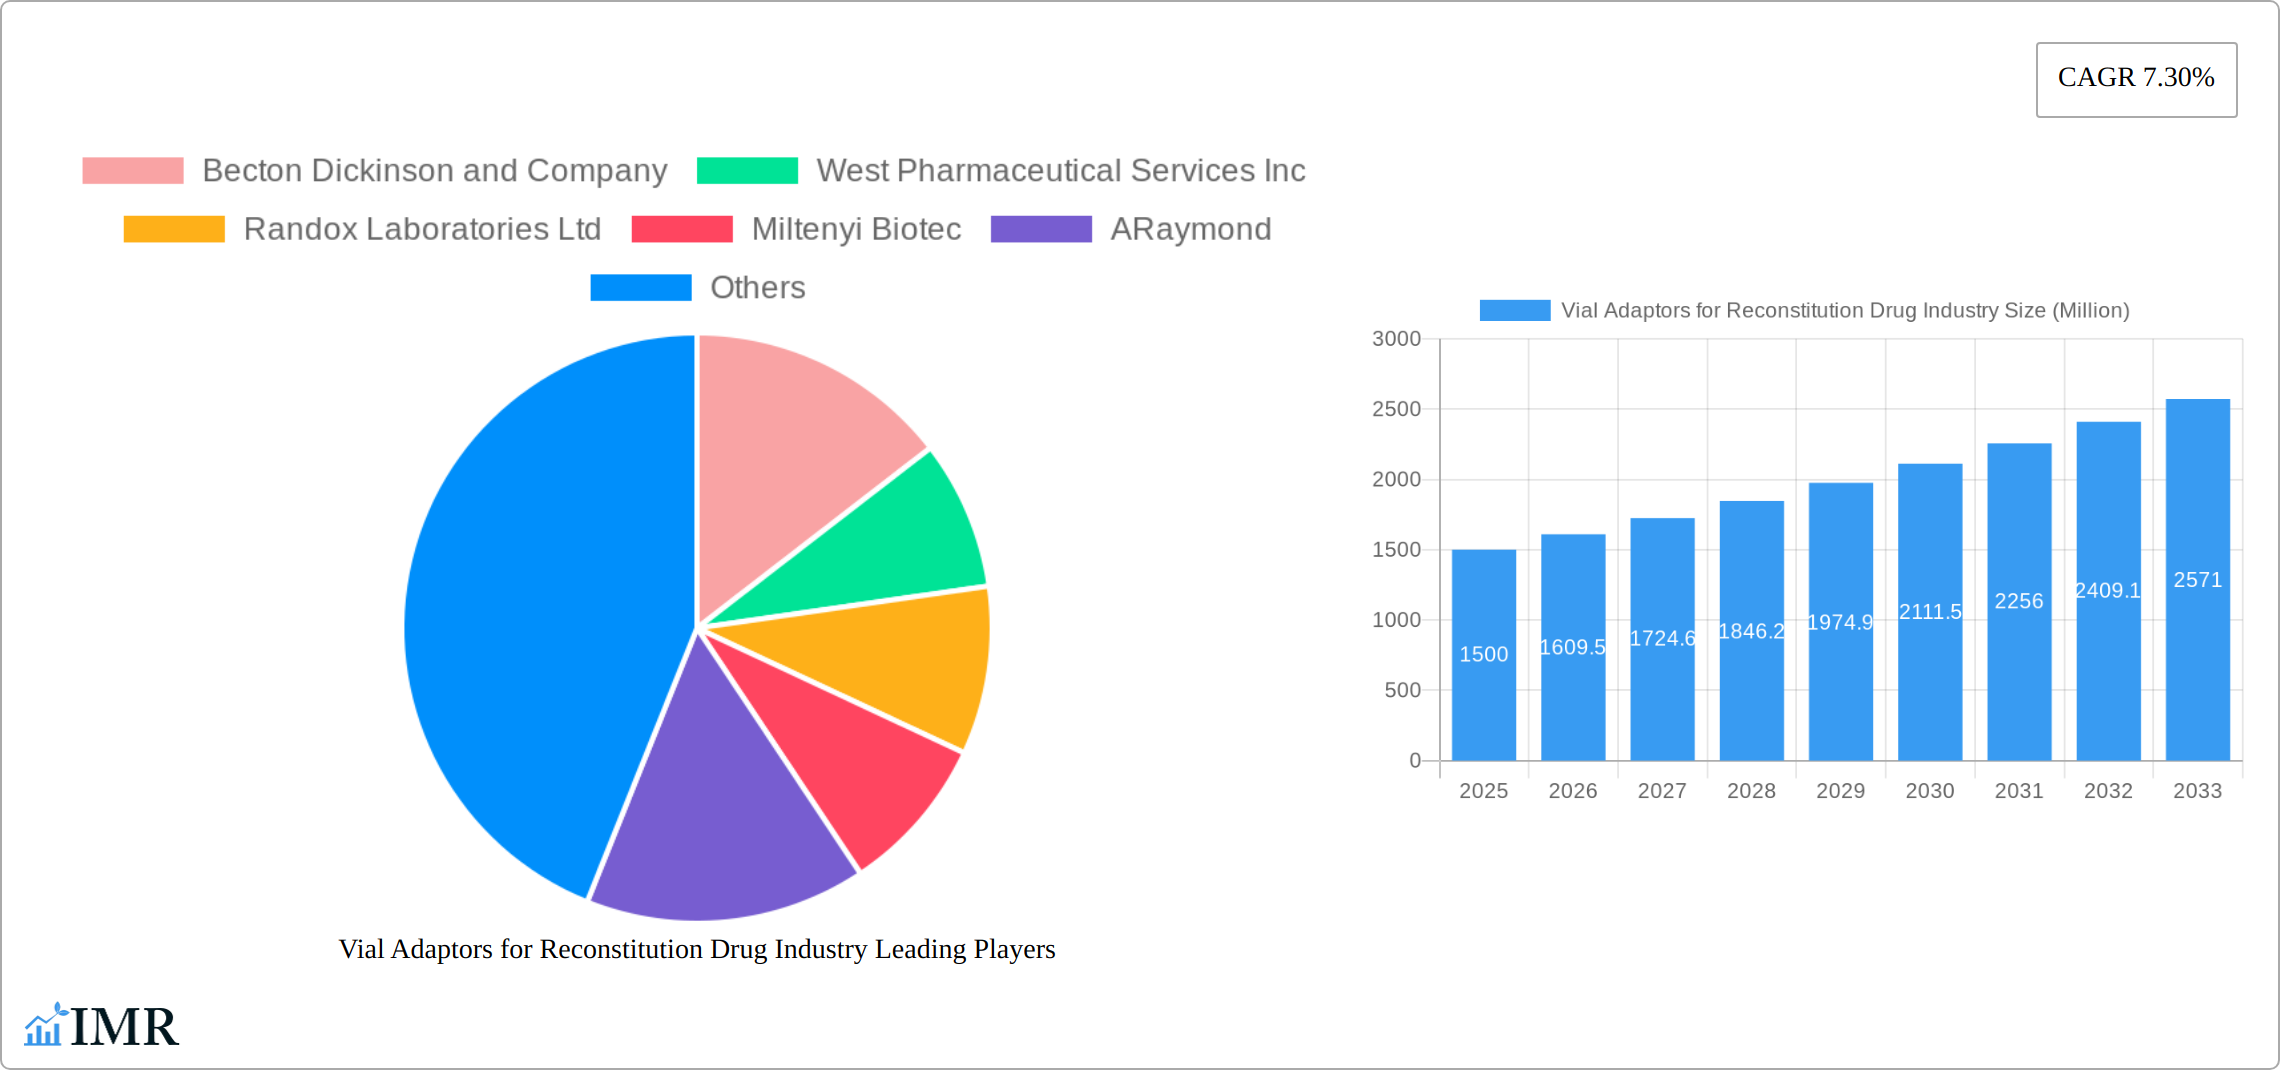
The global vial adaptors for reconstitution drug market, valued at approximately $1.5 billion in 2025, is projected to experience robust growth, driven by the increasing demand for injectable drugs and advancements in drug delivery systems. A Compound Annual Growth Rate (CAGR) of 7.3% from 2025 to 2033 indicates a significant expansion of this market, reaching an estimated value exceeding $2.5 billion by 2033. This growth is fueled by several key factors, including the rising prevalence of chronic diseases like autoimmune disorders, infectious diseases, and metabolic conditions necessitating injectable therapies. Furthermore, the ongoing development of novel drug formulations and the increasing adoption of convenient and safe reconstitution methods are boosting demand for vial adaptors. The market segmentation highlights the dominance of polycarbonate and silicon materials due to their biocompatibility and ease of use. Geographically, North America and Europe currently hold a significant market share, but the Asia-Pacific region is poised for rapid growth driven by increasing healthcare expenditure and rising adoption of advanced medical technologies. However, potential restraints include the stringent regulatory landscape surrounding medical devices and the potential for material degradation affecting drug integrity. Key players such as Becton Dickinson, West Pharmaceutical Services, and others are actively engaged in research and development to address these challenges and capitalize on the market's growth potential.
The market landscape is characterized by intense competition amongst established players and emerging companies. Strategic partnerships, mergers, and acquisitions are expected to shape the market dynamics. Companies are investing in improving product design, enhancing manufacturing processes, and expanding their product portfolios to cater to the evolving needs of pharmaceutical companies. The focus is on developing more efficient, user-friendly, and cost-effective vial adaptors with improved material compatibility to ensure the stability and integrity of the reconstituted drugs. This focus on innovation and the rising demand for injectable medications are expected to collectively drive the growth of the vial adaptors market throughout the forecast period, leading to substantial market expansion. Future growth will likely be influenced by technological advancements in material science, increasing automation in drug manufacturing, and the evolving regulatory framework.
Vial Adaptors for Reconstitution: A Comprehensive Market Report (2019-2033)
This in-depth report provides a comprehensive analysis of the Vial Adaptors for Reconstitution Drug Industry market, offering invaluable insights for stakeholders across the pharmaceutical and life sciences sectors. With a focus on market dynamics, growth trends, and key players, this report is essential for strategic decision-making. The study period covers 2019-2033, with 2025 as the base and estimated year. The forecast period extends from 2025-2033, while the historical period encompasses 2019-2024. The market size is projected in Million Units.
Vial Adaptors for Reconstitution Drug Industry Market Dynamics & Structure
The vial adaptors for reconstitution market, a critical component within pharmaceutical packaging and drug delivery systems, displays a moderately consolidated structure. Major players like Becton Dickinson, West Pharmaceutical Services, and Stevanato Group command significant market share, facing competition from numerous other companies. Market concentration is estimated at [Insert Percentage]% in 2025, with the top 5 players accounting for approximately [Insert Amount] Million units. This competitive landscape is further shaped by ongoing mergers and acquisitions, as seen in recent deals like the [Specific Deal 1] and [Specific Deal 2] partnerships.
Growth is fueled by technological advancements, particularly in biocompatible polymers and the automation of reconstitution processes. Stringent regulatory oversight from bodies like the FDA and EMA significantly impacts product development and manufacturing. Competitive pressure arises from substitutes such as pre-filled syringes and other innovative drug delivery systems. The primary end-users are pharmaceutical manufacturers, contract manufacturing organizations (CMOs), and hospitals. The dynamic competitive landscape underscores the need for continuous innovation and strategic partnerships to succeed in this market.
- Market Concentration (2025): [Insert Percentage]% (top 5 players)
- Key Innovation Drivers: Biocompatible polymers, automation, smart adaptors with integrated sensors
- Regulatory Landscape: FDA, EMA, and other relevant regional guidelines
- Competitive Substitutes: Pre-filled syringes, other advanced drug delivery systems
- M&A Activity: [Insert Number] significant deals in the last 5 years (estimated)
- Innovation Barriers: High R&D costs, stringent regulatory approvals, complex manufacturing processes
Vial Adaptors for Reconstitution Drug Industry Growth Trends & Insights
The global market for vial adaptors for reconstitution is experiencing robust growth, driven by the increasing prevalence of injectable drugs, advancements in drug delivery systems, and the rising demand for convenient and safe drug administration. The market size is projected to reach [Insert Amount] Million units by 2033, exhibiting a Compound Annual Growth Rate (CAGR) of [Insert Percentage]% during the forecast period. Market penetration stands at [Insert Percentage]% in developed regions and is poised for significant expansion in emerging economies. The integration of smart technologies, such as adaptors with embedded sensors for enhanced traceability and monitoring, is further accelerating market expansion. A growing emphasis on patient convenience and safety is also significantly contributing to this positive growth trajectory.
Dominant Regions, Countries, or Segments in Vial Adaptors for Reconstitution Drug Industry
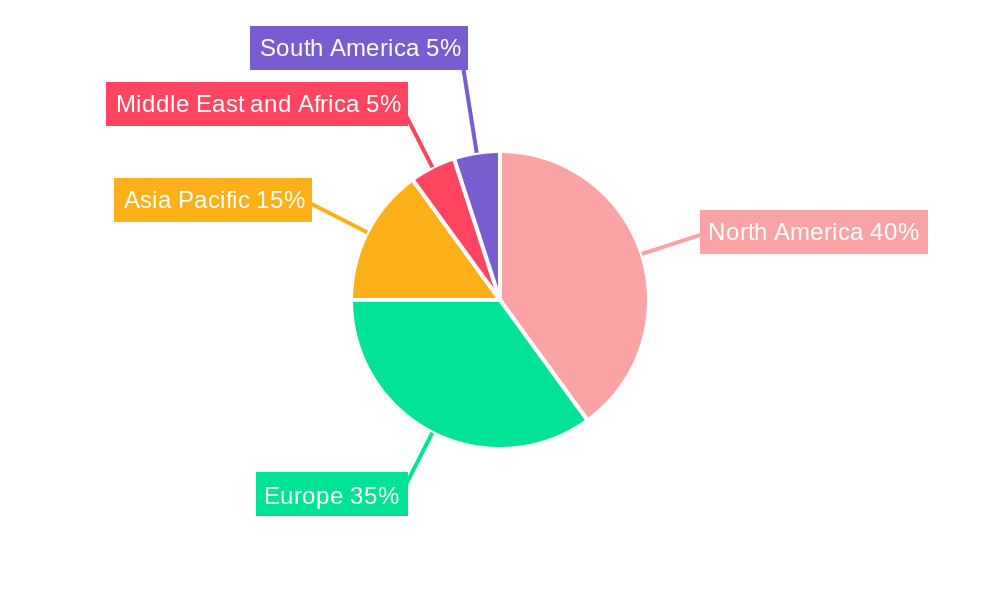
North America currently holds the largest market share, driven by factors such as a robust pharmaceutical industry, high adoption rates of advanced drug delivery systems, and strong regulatory support. Europe follows closely, contributing significantly due to a large pharmaceutical manufacturing base and advanced healthcare infrastructure. However, Asia-Pacific is expected to witness the fastest growth rate, propelled by increasing healthcare expenditure, rising prevalence of chronic diseases, and a growing pharmaceutical industry.
Material Segment: Polycarbonate and silicon currently dominate due to their biocompatibility, durability, and ease of sterilization. Polyethylene is also gaining traction due to its cost-effectiveness.
Therapeutic Area: Infectious diseases and autoimmune diseases currently lead, reflecting the significant demand for injectable medications within these therapeutic areas. Metabolic conditions are also a significant segment.
- North America: Strong pharmaceutical industry, high adoption rates.
- Europe: Large manufacturing base, advanced healthcare infrastructure.
- Asia-Pacific: Fastest growth, rising healthcare expenditure.
- Material: Polycarbonate (xx Million units), Silicon (xx Million units), Polyethylene (xx Million units)
- Therapeutic Area: Infectious Diseases (xx Million units), Autoimmune Diseases (xx Million units), Metabolic Conditions (xx Million units)
Vial Adaptors for Reconstitution Drug Industry Product Landscape
Vial adaptors are evolving from simple, single-use components to more sophisticated devices. Innovations include integrated needles, improved sealing mechanisms, and designs that minimize extractables and leachables. These advancements enhance the safety and efficacy of drug administration, particularly in sterile environments. Key performance metrics include leak resistance, sterility assurance, and ease of use. Unique selling propositions emphasize ease of use for healthcare professionals, sterility assurance, and enhanced patient safety.
Key Drivers, Barriers & Challenges in Vial Adaptors for Reconstitution Drug Industry
Key Drivers:
The market's growth is primarily driven by the increasing demand for injectable drugs, the rising prevalence of chronic diseases necessitating injectable therapies, and continuous advancements in product design. Stringent regulatory requirements prioritizing safety and efficacy further contribute to market expansion. The rising adoption of advanced drug delivery systems and a heightened focus on patient-centric design are also key drivers.
Challenges & Restraints:
Key challenges include navigating stringent regulatory approvals, competition from alternative drug delivery systems, and potential supply chain disruptions. Cost pressures, the necessity for continuous innovation, and high material costs coupled with complex manufacturing processes also pose significant hurdles to market growth. Maintaining a competitive edge requires substantial investment in R&D and efficient manufacturing processes.
Emerging Opportunities in Vial Adaptors for Reconstitution Drug Industry
Significant opportunities exist in developing biocompatible and biodegradable adaptors, incorporating smart technologies (such as integrated sensors and data logging capabilities), and expanding into new therapeutic areas. Untapped markets in developing economies present substantial growth potential. Furthermore, innovative applications tailored to personalized medicine and home healthcare are creating exciting new avenues. Advancements in pre-filled syringe technology and combination products offer synergistic potential for integration with vial adaptors, creating more efficient and user-friendly drug delivery systems.
Growth Accelerators in the Vial Adaptors for Reconstitution Drug Industry Industry
Long-term growth will be fueled by ongoing technological breakthroughs, including the development of novel materials and manufacturing processes. Strategic partnerships between pharmaceutical companies and adaptor manufacturers, focused on integrated drug delivery solutions, will play a critical role. Expansion into emerging markets and the development of customized adaptors tailored to specific therapeutic areas and drug formulations will further accelerate market expansion.
Key Players Shaping the Vial Adaptors for Reconstitution Drug Industry Market
- Becton Dickinson and Company
- West Pharmaceutical Services Inc
- Randox Laboratories Ltd
- Miltenyi Biotec
- ARaymond
- Stevanato Group
- Sartorius AG
- Baxter International Inc
- B Braun SE
- Thermo Fisher Scientific
- Simplivia
- Agilent Technologies
Notable Milestones in Vial Adaptors for Reconstitution Drug Industry Sector
- December 2022: Sartorius and BICO Group announce a technology, sales, and marketing cooperation agreement, expanding the market reach for advanced vial adaptor technologies.
- December 2021: Miltenyi Biotec expands its production capacity with a new plant in Germany, indicating increased production capabilities and market competitiveness.
In-Depth Vial Adaptors for Reconstitution Drug Industry Market Outlook
The future of the vial adaptors for reconstitution market is positive, with sustained growth driven by technological advancements, strategic partnerships, and broader applications across diverse therapeutic areas. Companies focused on developing innovative, cost-effective, and environmentally sustainable adaptors are well-positioned for success. Market expansion into emerging economies and the ongoing integration of smart technologies will continue to shape the long-term outlook, creating significant value for stakeholders throughout the value chain. A focus on sustainability and reducing the environmental impact of these products will also become increasingly important.
Vial Adaptors for Reconstitution Drug Industry Segmentation
-
1. Material
- 1.1. Polycarbonate
- 1.2. Silicon
- 1.3. Polyethylene
- 1.4. Other Materials
-
2. Therapeutic Area
- 2.1. Autoimmune Diseases
- 2.2. Infectious Diseases
- 2.3. Metabolic Conditions
- 2.4. Other Therapeutic Areas
Vial Adaptors for Reconstitution Drug Industry Segmentation By Geography
-
1. North America
- 1.1. United States
- 1.2. Canada
- 1.3. Mexico
-
2. Europe
- 2.1. Germany
- 2.2. United Kingdom
- 2.3. France
- 2.4. Italy
- 2.5. Spain
- 2.6. Rest of Europe
-
3. Asia Pacific
- 3.1. China
- 3.2. Japan
- 3.3. India
- 3.4. Australia
- 3.5. South Korea
- 3.6. Rest of Asia Pacific
-
4. Middle East and Africa
- 4.1. GCC
- 4.2. South Africa
- 4.3. Rest of Middle East and Africa
-
5. South America
- 5.1. Brazil
- 5.2. Argentina
- 5.3. Rest of South America
Vial Adaptors for Reconstitution Drug Industry REPORT HIGHLIGHTS
| Aspects | Details |
|---|---|
| Study Period | 2019-2033 |
| Base Year | 2024 |
| Estimated Year | 2025 |
| Forecast Period | 2025-2033 |
| Historical Period | 2019-2024 |
| Growth Rate | CAGR of 7.30% from 2019-2033 |
| Segmentation |
|
Table of Contents
- 1. Introduction
- 1.1. Research Scope
- 1.2. Market Segmentation
- 1.3. Research Methodology
- 1.4. Definitions and Assumptions
- 2. Executive Summary
- 2.1. Introduction
- 3. Market Dynamics
- 3.1. Introduction
- 3.2. Market Drivers
- 3.2.1. Increasing Prevalence of Infectious Diseases; Rising Geriatric Population; Increasing Awareness of the Advantages of the Vial Adaptors
- 3.3. Market Restrains
- 3.3.1. Availability of Substitutes
- 3.4. Market Trends
- 3.4.1. Infectious Diseases Segment is Expected to Hold a Significant Market Share Over the Forecast Period
- 4. Market Factor Analysis
- 4.1. Porters Five Forces
- 4.2. Supply/Value Chain
- 4.3. PESTEL analysis
- 4.4. Market Entropy
- 4.5. Patent/Trademark Analysis
- 5. Global Vial Adaptors for Reconstitution Drug Industry Analysis, Insights and Forecast, 2019-2031
- 5.1. Market Analysis, Insights and Forecast - by Material
- 5.1.1. Polycarbonate
- 5.1.2. Silicon
- 5.1.3. Polyethylene
- 5.1.4. Other Materials
- 5.2. Market Analysis, Insights and Forecast - by Therapeutic Area
- 5.2.1. Autoimmune Diseases
- 5.2.2. Infectious Diseases
- 5.2.3. Metabolic Conditions
- 5.2.4. Other Therapeutic Areas
- 5.3. Market Analysis, Insights and Forecast - by Region
- 5.3.1. North America
- 5.3.2. Europe
- 5.3.3. Asia Pacific
- 5.3.4. Middle East and Africa
- 5.3.5. South America
- 5.1. Market Analysis, Insights and Forecast - by Material
- 6. North America Vial Adaptors for Reconstitution Drug Industry Analysis, Insights and Forecast, 2019-2031
- 6.1. Market Analysis, Insights and Forecast - by Material
- 6.1.1. Polycarbonate
- 6.1.2. Silicon
- 6.1.3. Polyethylene
- 6.1.4. Other Materials
- 6.2. Market Analysis, Insights and Forecast - by Therapeutic Area
- 6.2.1. Autoimmune Diseases
- 6.2.2. Infectious Diseases
- 6.2.3. Metabolic Conditions
- 6.2.4. Other Therapeutic Areas
- 6.1. Market Analysis, Insights and Forecast - by Material
- 7. Europe Vial Adaptors for Reconstitution Drug Industry Analysis, Insights and Forecast, 2019-2031
- 7.1. Market Analysis, Insights and Forecast - by Material
- 7.1.1. Polycarbonate
- 7.1.2. Silicon
- 7.1.3. Polyethylene
- 7.1.4. Other Materials
- 7.2. Market Analysis, Insights and Forecast - by Therapeutic Area
- 7.2.1. Autoimmune Diseases
- 7.2.2. Infectious Diseases
- 7.2.3. Metabolic Conditions
- 7.2.4. Other Therapeutic Areas
- 7.1. Market Analysis, Insights and Forecast - by Material
- 8. Asia Pacific Vial Adaptors for Reconstitution Drug Industry Analysis, Insights and Forecast, 2019-2031
- 8.1. Market Analysis, Insights and Forecast - by Material
- 8.1.1. Polycarbonate
- 8.1.2. Silicon
- 8.1.3. Polyethylene
- 8.1.4. Other Materials
- 8.2. Market Analysis, Insights and Forecast - by Therapeutic Area
- 8.2.1. Autoimmune Diseases
- 8.2.2. Infectious Diseases
- 8.2.3. Metabolic Conditions
- 8.2.4. Other Therapeutic Areas
- 8.1. Market Analysis, Insights and Forecast - by Material
- 9. Middle East and Africa Vial Adaptors for Reconstitution Drug Industry Analysis, Insights and Forecast, 2019-2031
- 9.1. Market Analysis, Insights and Forecast - by Material
- 9.1.1. Polycarbonate
- 9.1.2. Silicon
- 9.1.3. Polyethylene
- 9.1.4. Other Materials
- 9.2. Market Analysis, Insights and Forecast - by Therapeutic Area
- 9.2.1. Autoimmune Diseases
- 9.2.2. Infectious Diseases
- 9.2.3. Metabolic Conditions
- 9.2.4. Other Therapeutic Areas
- 9.1. Market Analysis, Insights and Forecast - by Material
- 10. South America Vial Adaptors for Reconstitution Drug Industry Analysis, Insights and Forecast, 2019-2031
- 10.1. Market Analysis, Insights and Forecast - by Material
- 10.1.1. Polycarbonate
- 10.1.2. Silicon
- 10.1.3. Polyethylene
- 10.1.4. Other Materials
- 10.2. Market Analysis, Insights and Forecast - by Therapeutic Area
- 10.2.1. Autoimmune Diseases
- 10.2.2. Infectious Diseases
- 10.2.3. Metabolic Conditions
- 10.2.4. Other Therapeutic Areas
- 10.1. Market Analysis, Insights and Forecast - by Material
- 11. North America Vial Adaptors for Reconstitution Drug Industry Analysis, Insights and Forecast, 2019-2031
- 11.1. Market Analysis, Insights and Forecast - By Country/Sub-region
- 11.1.1 United States
- 11.1.2 Canada
- 11.1.3 Mexico
- 12. Europe Vial Adaptors for Reconstitution Drug Industry Analysis, Insights and Forecast, 2019-2031
- 12.1. Market Analysis, Insights and Forecast - By Country/Sub-region
- 12.1.1 Germany
- 12.1.2 United Kingdom
- 12.1.3 France
- 12.1.4 Italy
- 12.1.5 Spain
- 12.1.6 Rest of Europe
- 13. Asia Pacific Vial Adaptors for Reconstitution Drug Industry Analysis, Insights and Forecast, 2019-2031
- 13.1. Market Analysis, Insights and Forecast - By Country/Sub-region
- 13.1.1 China
- 13.1.2 Japan
- 13.1.3 India
- 13.1.4 Australia
- 13.1.5 South Korea
- 13.1.6 Rest of Asia Pacific
- 14. Middle East and Africa Vial Adaptors for Reconstitution Drug Industry Analysis, Insights and Forecast, 2019-2031
- 14.1. Market Analysis, Insights and Forecast - By Country/Sub-region
- 14.1.1 GCC
- 14.1.2 South Africa
- 14.1.3 Rest of Middle East and Africa
- 15. South America Vial Adaptors for Reconstitution Drug Industry Analysis, Insights and Forecast, 2019-2031
- 15.1. Market Analysis, Insights and Forecast - By Country/Sub-region
- 15.1.1 Brazil
- 15.1.2 Argentina
- 15.1.3 Rest of South America
- 16. Competitive Analysis
- 16.1. Global Market Share Analysis 2024
- 16.2. Company Profiles
- 16.2.1 Becton Dickinson and Company
- 16.2.1.1. Overview
- 16.2.1.2. Products
- 16.2.1.3. SWOT Analysis
- 16.2.1.4. Recent Developments
- 16.2.1.5. Financials (Based on Availability)
- 16.2.2 West Pharmaceutical Services Inc
- 16.2.2.1. Overview
- 16.2.2.2. Products
- 16.2.2.3. SWOT Analysis
- 16.2.2.4. Recent Developments
- 16.2.2.5. Financials (Based on Availability)
- 16.2.3 Randox Laboratories Ltd
- 16.2.3.1. Overview
- 16.2.3.2. Products
- 16.2.3.3. SWOT Analysis
- 16.2.3.4. Recent Developments
- 16.2.3.5. Financials (Based on Availability)
- 16.2.4 Miltenyi Biotec
- 16.2.4.1. Overview
- 16.2.4.2. Products
- 16.2.4.3. SWOT Analysis
- 16.2.4.4. Recent Developments
- 16.2.4.5. Financials (Based on Availability)
- 16.2.5 ARaymond
- 16.2.5.1. Overview
- 16.2.5.2. Products
- 16.2.5.3. SWOT Analysis
- 16.2.5.4. Recent Developments
- 16.2.5.5. Financials (Based on Availability)
- 16.2.6 Stevanato Group
- 16.2.6.1. Overview
- 16.2.6.2. Products
- 16.2.6.3. SWOT Analysis
- 16.2.6.4. Recent Developments
- 16.2.6.5. Financials (Based on Availability)
- 16.2.7 Sartorious AG
- 16.2.7.1. Overview
- 16.2.7.2. Products
- 16.2.7.3. SWOT Analysis
- 16.2.7.4. Recent Developments
- 16.2.7.5. Financials (Based on Availability)
- 16.2.8 Baxter International Inc
- 16.2.8.1. Overview
- 16.2.8.2. Products
- 16.2.8.3. SWOT Analysis
- 16.2.8.4. Recent Developments
- 16.2.8.5. Financials (Based on Availability)
- 16.2.9 B Braun SE
- 16.2.9.1. Overview
- 16.2.9.2. Products
- 16.2.9.3. SWOT Analysis
- 16.2.9.4. Recent Developments
- 16.2.9.5. Financials (Based on Availability)
- 16.2.10 Thermo Fisher Scientific
- 16.2.10.1. Overview
- 16.2.10.2. Products
- 16.2.10.3. SWOT Analysis
- 16.2.10.4. Recent Developments
- 16.2.10.5. Financials (Based on Availability)
- 16.2.11 Simplivia
- 16.2.11.1. Overview
- 16.2.11.2. Products
- 16.2.11.3. SWOT Analysis
- 16.2.11.4. Recent Developments
- 16.2.11.5. Financials (Based on Availability)
- 16.2.12 Agilent Technologies
- 16.2.12.1. Overview
- 16.2.12.2. Products
- 16.2.12.3. SWOT Analysis
- 16.2.12.4. Recent Developments
- 16.2.12.5. Financials (Based on Availability)
- 16.2.1 Becton Dickinson and Company
List of Figures
- Figure 1: Global Vial Adaptors for Reconstitution Drug Industry Revenue Breakdown (Million, %) by Region 2024 & 2032
- Figure 2: Global Vial Adaptors for Reconstitution Drug Industry Volume Breakdown (K Unit, %) by Region 2024 & 2032
- Figure 3: North America Vial Adaptors for Reconstitution Drug Industry Revenue (Million), by Country 2024 & 2032
- Figure 4: North America Vial Adaptors for Reconstitution Drug Industry Volume (K Unit), by Country 2024 & 2032
- Figure 5: North America Vial Adaptors for Reconstitution Drug Industry Revenue Share (%), by Country 2024 & 2032
- Figure 6: North America Vial Adaptors for Reconstitution Drug Industry Volume Share (%), by Country 2024 & 2032
- Figure 7: Europe Vial Adaptors for Reconstitution Drug Industry Revenue (Million), by Country 2024 & 2032
- Figure 8: Europe Vial Adaptors for Reconstitution Drug Industry Volume (K Unit), by Country 2024 & 2032
- Figure 9: Europe Vial Adaptors for Reconstitution Drug Industry Revenue Share (%), by Country 2024 & 2032
- Figure 10: Europe Vial Adaptors for Reconstitution Drug Industry Volume Share (%), by Country 2024 & 2032
- Figure 11: Asia Pacific Vial Adaptors for Reconstitution Drug Industry Revenue (Million), by Country 2024 & 2032
- Figure 12: Asia Pacific Vial Adaptors for Reconstitution Drug Industry Volume (K Unit), by Country 2024 & 2032
- Figure 13: Asia Pacific Vial Adaptors for Reconstitution Drug Industry Revenue Share (%), by Country 2024 & 2032
- Figure 14: Asia Pacific Vial Adaptors for Reconstitution Drug Industry Volume Share (%), by Country 2024 & 2032
- Figure 15: Middle East and Africa Vial Adaptors for Reconstitution Drug Industry Revenue (Million), by Country 2024 & 2032
- Figure 16: Middle East and Africa Vial Adaptors for Reconstitution Drug Industry Volume (K Unit), by Country 2024 & 2032
- Figure 17: Middle East and Africa Vial Adaptors for Reconstitution Drug Industry Revenue Share (%), by Country 2024 & 2032
- Figure 18: Middle East and Africa Vial Adaptors for Reconstitution Drug Industry Volume Share (%), by Country 2024 & 2032
- Figure 19: South America Vial Adaptors for Reconstitution Drug Industry Revenue (Million), by Country 2024 & 2032
- Figure 20: South America Vial Adaptors for Reconstitution Drug Industry Volume (K Unit), by Country 2024 & 2032
- Figure 21: South America Vial Adaptors for Reconstitution Drug Industry Revenue Share (%), by Country 2024 & 2032
- Figure 22: South America Vial Adaptors for Reconstitution Drug Industry Volume Share (%), by Country 2024 & 2032
- Figure 23: North America Vial Adaptors for Reconstitution Drug Industry Revenue (Million), by Material 2024 & 2032
- Figure 24: North America Vial Adaptors for Reconstitution Drug Industry Volume (K Unit), by Material 2024 & 2032
- Figure 25: North America Vial Adaptors for Reconstitution Drug Industry Revenue Share (%), by Material 2024 & 2032
- Figure 26: North America Vial Adaptors for Reconstitution Drug Industry Volume Share (%), by Material 2024 & 2032
- Figure 27: North America Vial Adaptors for Reconstitution Drug Industry Revenue (Million), by Therapeutic Area 2024 & 2032
- Figure 28: North America Vial Adaptors for Reconstitution Drug Industry Volume (K Unit), by Therapeutic Area 2024 & 2032
- Figure 29: North America Vial Adaptors for Reconstitution Drug Industry Revenue Share (%), by Therapeutic Area 2024 & 2032
- Figure 30: North America Vial Adaptors for Reconstitution Drug Industry Volume Share (%), by Therapeutic Area 2024 & 2032
- Figure 31: North America Vial Adaptors for Reconstitution Drug Industry Revenue (Million), by Country 2024 & 2032
- Figure 32: North America Vial Adaptors for Reconstitution Drug Industry Volume (K Unit), by Country 2024 & 2032
- Figure 33: North America Vial Adaptors for Reconstitution Drug Industry Revenue Share (%), by Country 2024 & 2032
- Figure 34: North America Vial Adaptors for Reconstitution Drug Industry Volume Share (%), by Country 2024 & 2032
- Figure 35: Europe Vial Adaptors for Reconstitution Drug Industry Revenue (Million), by Material 2024 & 2032
- Figure 36: Europe Vial Adaptors for Reconstitution Drug Industry Volume (K Unit), by Material 2024 & 2032
- Figure 37: Europe Vial Adaptors for Reconstitution Drug Industry Revenue Share (%), by Material 2024 & 2032
- Figure 38: Europe Vial Adaptors for Reconstitution Drug Industry Volume Share (%), by Material 2024 & 2032
- Figure 39: Europe Vial Adaptors for Reconstitution Drug Industry Revenue (Million), by Therapeutic Area 2024 & 2032
- Figure 40: Europe Vial Adaptors for Reconstitution Drug Industry Volume (K Unit), by Therapeutic Area 2024 & 2032
- Figure 41: Europe Vial Adaptors for Reconstitution Drug Industry Revenue Share (%), by Therapeutic Area 2024 & 2032
- Figure 42: Europe Vial Adaptors for Reconstitution Drug Industry Volume Share (%), by Therapeutic Area 2024 & 2032
- Figure 43: Europe Vial Adaptors for Reconstitution Drug Industry Revenue (Million), by Country 2024 & 2032
- Figure 44: Europe Vial Adaptors for Reconstitution Drug Industry Volume (K Unit), by Country 2024 & 2032
- Figure 45: Europe Vial Adaptors for Reconstitution Drug Industry Revenue Share (%), by Country 2024 & 2032
- Figure 46: Europe Vial Adaptors for Reconstitution Drug Industry Volume Share (%), by Country 2024 & 2032
- Figure 47: Asia Pacific Vial Adaptors for Reconstitution Drug Industry Revenue (Million), by Material 2024 & 2032
- Figure 48: Asia Pacific Vial Adaptors for Reconstitution Drug Industry Volume (K Unit), by Material 2024 & 2032
- Figure 49: Asia Pacific Vial Adaptors for Reconstitution Drug Industry Revenue Share (%), by Material 2024 & 2032
- Figure 50: Asia Pacific Vial Adaptors for Reconstitution Drug Industry Volume Share (%), by Material 2024 & 2032
- Figure 51: Asia Pacific Vial Adaptors for Reconstitution Drug Industry Revenue (Million), by Therapeutic Area 2024 & 2032
- Figure 52: Asia Pacific Vial Adaptors for Reconstitution Drug Industry Volume (K Unit), by Therapeutic Area 2024 & 2032
- Figure 53: Asia Pacific Vial Adaptors for Reconstitution Drug Industry Revenue Share (%), by Therapeutic Area 2024 & 2032
- Figure 54: Asia Pacific Vial Adaptors for Reconstitution Drug Industry Volume Share (%), by Therapeutic Area 2024 & 2032
- Figure 55: Asia Pacific Vial Adaptors for Reconstitution Drug Industry Revenue (Million), by Country 2024 & 2032
- Figure 56: Asia Pacific Vial Adaptors for Reconstitution Drug Industry Volume (K Unit), by Country 2024 & 2032
- Figure 57: Asia Pacific Vial Adaptors for Reconstitution Drug Industry Revenue Share (%), by Country 2024 & 2032
- Figure 58: Asia Pacific Vial Adaptors for Reconstitution Drug Industry Volume Share (%), by Country 2024 & 2032
- Figure 59: Middle East and Africa Vial Adaptors for Reconstitution Drug Industry Revenue (Million), by Material 2024 & 2032
- Figure 60: Middle East and Africa Vial Adaptors for Reconstitution Drug Industry Volume (K Unit), by Material 2024 & 2032
- Figure 61: Middle East and Africa Vial Adaptors for Reconstitution Drug Industry Revenue Share (%), by Material 2024 & 2032
- Figure 62: Middle East and Africa Vial Adaptors for Reconstitution Drug Industry Volume Share (%), by Material 2024 & 2032
- Figure 63: Middle East and Africa Vial Adaptors for Reconstitution Drug Industry Revenue (Million), by Therapeutic Area 2024 & 2032
- Figure 64: Middle East and Africa Vial Adaptors for Reconstitution Drug Industry Volume (K Unit), by Therapeutic Area 2024 & 2032
- Figure 65: Middle East and Africa Vial Adaptors for Reconstitution Drug Industry Revenue Share (%), by Therapeutic Area 2024 & 2032
- Figure 66: Middle East and Africa Vial Adaptors for Reconstitution Drug Industry Volume Share (%), by Therapeutic Area 2024 & 2032
- Figure 67: Middle East and Africa Vial Adaptors for Reconstitution Drug Industry Revenue (Million), by Country 2024 & 2032
- Figure 68: Middle East and Africa Vial Adaptors for Reconstitution Drug Industry Volume (K Unit), by Country 2024 & 2032
- Figure 69: Middle East and Africa Vial Adaptors for Reconstitution Drug Industry Revenue Share (%), by Country 2024 & 2032
- Figure 70: Middle East and Africa Vial Adaptors for Reconstitution Drug Industry Volume Share (%), by Country 2024 & 2032
- Figure 71: South America Vial Adaptors for Reconstitution Drug Industry Revenue (Million), by Material 2024 & 2032
- Figure 72: South America Vial Adaptors for Reconstitution Drug Industry Volume (K Unit), by Material 2024 & 2032
- Figure 73: South America Vial Adaptors for Reconstitution Drug Industry Revenue Share (%), by Material 2024 & 2032
- Figure 74: South America Vial Adaptors for Reconstitution Drug Industry Volume Share (%), by Material 2024 & 2032
- Figure 75: South America Vial Adaptors for Reconstitution Drug Industry Revenue (Million), by Therapeutic Area 2024 & 2032
- Figure 76: South America Vial Adaptors for Reconstitution Drug Industry Volume (K Unit), by Therapeutic Area 2024 & 2032
- Figure 77: South America Vial Adaptors for Reconstitution Drug Industry Revenue Share (%), by Therapeutic Area 2024 & 2032
- Figure 78: South America Vial Adaptors for Reconstitution Drug Industry Volume Share (%), by Therapeutic Area 2024 & 2032
- Figure 79: South America Vial Adaptors for Reconstitution Drug Industry Revenue (Million), by Country 2024 & 2032
- Figure 80: South America Vial Adaptors for Reconstitution Drug Industry Volume (K Unit), by Country 2024 & 2032
- Figure 81: South America Vial Adaptors for Reconstitution Drug Industry Revenue Share (%), by Country 2024 & 2032
- Figure 82: South America Vial Adaptors for Reconstitution Drug Industry Volume Share (%), by Country 2024 & 2032
List of Tables
- Table 1: Global Vial Adaptors for Reconstitution Drug Industry Revenue Million Forecast, by Region 2019 & 2032
- Table 2: Global Vial Adaptors for Reconstitution Drug Industry Volume K Unit Forecast, by Region 2019 & 2032
- Table 3: Global Vial Adaptors for Reconstitution Drug Industry Revenue Million Forecast, by Material 2019 & 2032
- Table 4: Global Vial Adaptors for Reconstitution Drug Industry Volume K Unit Forecast, by Material 2019 & 2032
- Table 5: Global Vial Adaptors for Reconstitution Drug Industry Revenue Million Forecast, by Therapeutic Area 2019 & 2032
- Table 6: Global Vial Adaptors for Reconstitution Drug Industry Volume K Unit Forecast, by Therapeutic Area 2019 & 2032
- Table 7: Global Vial Adaptors for Reconstitution Drug Industry Revenue Million Forecast, by Region 2019 & 2032
- Table 8: Global Vial Adaptors for Reconstitution Drug Industry Volume K Unit Forecast, by Region 2019 & 2032
- Table 9: Global Vial Adaptors for Reconstitution Drug Industry Revenue Million Forecast, by Country 2019 & 2032
- Table 10: Global Vial Adaptors for Reconstitution Drug Industry Volume K Unit Forecast, by Country 2019 & 2032
- Table 11: United States Vial Adaptors for Reconstitution Drug Industry Revenue (Million) Forecast, by Application 2019 & 2032
- Table 12: United States Vial Adaptors for Reconstitution Drug Industry Volume (K Unit) Forecast, by Application 2019 & 2032
- Table 13: Canada Vial Adaptors for Reconstitution Drug Industry Revenue (Million) Forecast, by Application 2019 & 2032
- Table 14: Canada Vial Adaptors for Reconstitution Drug Industry Volume (K Unit) Forecast, by Application 2019 & 2032
- Table 15: Mexico Vial Adaptors for Reconstitution Drug Industry Revenue (Million) Forecast, by Application 2019 & 2032
- Table 16: Mexico Vial Adaptors for Reconstitution Drug Industry Volume (K Unit) Forecast, by Application 2019 & 2032
- Table 17: Global Vial Adaptors for Reconstitution Drug Industry Revenue Million Forecast, by Country 2019 & 2032
- Table 18: Global Vial Adaptors for Reconstitution Drug Industry Volume K Unit Forecast, by Country 2019 & 2032
- Table 19: Germany Vial Adaptors for Reconstitution Drug Industry Revenue (Million) Forecast, by Application 2019 & 2032
- Table 20: Germany Vial Adaptors for Reconstitution Drug Industry Volume (K Unit) Forecast, by Application 2019 & 2032
- Table 21: United Kingdom Vial Adaptors for Reconstitution Drug Industry Revenue (Million) Forecast, by Application 2019 & 2032
- Table 22: United Kingdom Vial Adaptors for Reconstitution Drug Industry Volume (K Unit) Forecast, by Application 2019 & 2032
- Table 23: France Vial Adaptors for Reconstitution Drug Industry Revenue (Million) Forecast, by Application 2019 & 2032
- Table 24: France Vial Adaptors for Reconstitution Drug Industry Volume (K Unit) Forecast, by Application 2019 & 2032
- Table 25: Italy Vial Adaptors for Reconstitution Drug Industry Revenue (Million) Forecast, by Application 2019 & 2032
- Table 26: Italy Vial Adaptors for Reconstitution Drug Industry Volume (K Unit) Forecast, by Application 2019 & 2032
- Table 27: Spain Vial Adaptors for Reconstitution Drug Industry Revenue (Million) Forecast, by Application 2019 & 2032
- Table 28: Spain Vial Adaptors for Reconstitution Drug Industry Volume (K Unit) Forecast, by Application 2019 & 2032
- Table 29: Rest of Europe Vial Adaptors for Reconstitution Drug Industry Revenue (Million) Forecast, by Application 2019 & 2032
- Table 30: Rest of Europe Vial Adaptors for Reconstitution Drug Industry Volume (K Unit) Forecast, by Application 2019 & 2032
- Table 31: Global Vial Adaptors for Reconstitution Drug Industry Revenue Million Forecast, by Country 2019 & 2032
- Table 32: Global Vial Adaptors for Reconstitution Drug Industry Volume K Unit Forecast, by Country 2019 & 2032
- Table 33: China Vial Adaptors for Reconstitution Drug Industry Revenue (Million) Forecast, by Application 2019 & 2032
- Table 34: China Vial Adaptors for Reconstitution Drug Industry Volume (K Unit) Forecast, by Application 2019 & 2032
- Table 35: Japan Vial Adaptors for Reconstitution Drug Industry Revenue (Million) Forecast, by Application 2019 & 2032
- Table 36: Japan Vial Adaptors for Reconstitution Drug Industry Volume (K Unit) Forecast, by Application 2019 & 2032
- Table 37: India Vial Adaptors for Reconstitution Drug Industry Revenue (Million) Forecast, by Application 2019 & 2032
- Table 38: India Vial Adaptors for Reconstitution Drug Industry Volume (K Unit) Forecast, by Application 2019 & 2032
- Table 39: Australia Vial Adaptors for Reconstitution Drug Industry Revenue (Million) Forecast, by Application 2019 & 2032
- Table 40: Australia Vial Adaptors for Reconstitution Drug Industry Volume (K Unit) Forecast, by Application 2019 & 2032
- Table 41: South Korea Vial Adaptors for Reconstitution Drug Industry Revenue (Million) Forecast, by Application 2019 & 2032
- Table 42: South Korea Vial Adaptors for Reconstitution Drug Industry Volume (K Unit) Forecast, by Application 2019 & 2032
- Table 43: Rest of Asia Pacific Vial Adaptors for Reconstitution Drug Industry Revenue (Million) Forecast, by Application 2019 & 2032
- Table 44: Rest of Asia Pacific Vial Adaptors for Reconstitution Drug Industry Volume (K Unit) Forecast, by Application 2019 & 2032
- Table 45: Global Vial Adaptors for Reconstitution Drug Industry Revenue Million Forecast, by Country 2019 & 2032
- Table 46: Global Vial Adaptors for Reconstitution Drug Industry Volume K Unit Forecast, by Country 2019 & 2032
- Table 47: GCC Vial Adaptors for Reconstitution Drug Industry Revenue (Million) Forecast, by Application 2019 & 2032
- Table 48: GCC Vial Adaptors for Reconstitution Drug Industry Volume (K Unit) Forecast, by Application 2019 & 2032
- Table 49: South Africa Vial Adaptors for Reconstitution Drug Industry Revenue (Million) Forecast, by Application 2019 & 2032
- Table 50: South Africa Vial Adaptors for Reconstitution Drug Industry Volume (K Unit) Forecast, by Application 2019 & 2032
- Table 51: Rest of Middle East and Africa Vial Adaptors for Reconstitution Drug Industry Revenue (Million) Forecast, by Application 2019 & 2032
- Table 52: Rest of Middle East and Africa Vial Adaptors for Reconstitution Drug Industry Volume (K Unit) Forecast, by Application 2019 & 2032
- Table 53: Global Vial Adaptors for Reconstitution Drug Industry Revenue Million Forecast, by Country 2019 & 2032
- Table 54: Global Vial Adaptors for Reconstitution Drug Industry Volume K Unit Forecast, by Country 2019 & 2032
- Table 55: Brazil Vial Adaptors for Reconstitution Drug Industry Revenue (Million) Forecast, by Application 2019 & 2032
- Table 56: Brazil Vial Adaptors for Reconstitution Drug Industry Volume (K Unit) Forecast, by Application 2019 & 2032
- Table 57: Argentina Vial Adaptors for Reconstitution Drug Industry Revenue (Million) Forecast, by Application 2019 & 2032
- Table 58: Argentina Vial Adaptors for Reconstitution Drug Industry Volume (K Unit) Forecast, by Application 2019 & 2032
- Table 59: Rest of South America Vial Adaptors for Reconstitution Drug Industry Revenue (Million) Forecast, by Application 2019 & 2032
- Table 60: Rest of South America Vial Adaptors for Reconstitution Drug Industry Volume (K Unit) Forecast, by Application 2019 & 2032
- Table 61: Global Vial Adaptors for Reconstitution Drug Industry Revenue Million Forecast, by Material 2019 & 2032
- Table 62: Global Vial Adaptors for Reconstitution Drug Industry Volume K Unit Forecast, by Material 2019 & 2032
- Table 63: Global Vial Adaptors for Reconstitution Drug Industry Revenue Million Forecast, by Therapeutic Area 2019 & 2032
- Table 64: Global Vial Adaptors for Reconstitution Drug Industry Volume K Unit Forecast, by Therapeutic Area 2019 & 2032
- Table 65: Global Vial Adaptors for Reconstitution Drug Industry Revenue Million Forecast, by Country 2019 & 2032
- Table 66: Global Vial Adaptors for Reconstitution Drug Industry Volume K Unit Forecast, by Country 2019 & 2032
- Table 67: United States Vial Adaptors for Reconstitution Drug Industry Revenue (Million) Forecast, by Application 2019 & 2032
- Table 68: United States Vial Adaptors for Reconstitution Drug Industry Volume (K Unit) Forecast, by Application 2019 & 2032
- Table 69: Canada Vial Adaptors for Reconstitution Drug Industry Revenue (Million) Forecast, by Application 2019 & 2032
- Table 70: Canada Vial Adaptors for Reconstitution Drug Industry Volume (K Unit) Forecast, by Application 2019 & 2032
- Table 71: Mexico Vial Adaptors for Reconstitution Drug Industry Revenue (Million) Forecast, by Application 2019 & 2032
- Table 72: Mexico Vial Adaptors for Reconstitution Drug Industry Volume (K Unit) Forecast, by Application 2019 & 2032
- Table 73: Global Vial Adaptors for Reconstitution Drug Industry Revenue Million Forecast, by Material 2019 & 2032
- Table 74: Global Vial Adaptors for Reconstitution Drug Industry Volume K Unit Forecast, by Material 2019 & 2032
- Table 75: Global Vial Adaptors for Reconstitution Drug Industry Revenue Million Forecast, by Therapeutic Area 2019 & 2032
- Table 76: Global Vial Adaptors for Reconstitution Drug Industry Volume K Unit Forecast, by Therapeutic Area 2019 & 2032
- Table 77: Global Vial Adaptors for Reconstitution Drug Industry Revenue Million Forecast, by Country 2019 & 2032
- Table 78: Global Vial Adaptors for Reconstitution Drug Industry Volume K Unit Forecast, by Country 2019 & 2032
- Table 79: Germany Vial Adaptors for Reconstitution Drug Industry Revenue (Million) Forecast, by Application 2019 & 2032
- Table 80: Germany Vial Adaptors for Reconstitution Drug Industry Volume (K Unit) Forecast, by Application 2019 & 2032
- Table 81: United Kingdom Vial Adaptors for Reconstitution Drug Industry Revenue (Million) Forecast, by Application 2019 & 2032
- Table 82: United Kingdom Vial Adaptors for Reconstitution Drug Industry Volume (K Unit) Forecast, by Application 2019 & 2032
- Table 83: France Vial Adaptors for Reconstitution Drug Industry Revenue (Million) Forecast, by Application 2019 & 2032
- Table 84: France Vial Adaptors for Reconstitution Drug Industry Volume (K Unit) Forecast, by Application 2019 & 2032
- Table 85: Italy Vial Adaptors for Reconstitution Drug Industry Revenue (Million) Forecast, by Application 2019 & 2032
- Table 86: Italy Vial Adaptors for Reconstitution Drug Industry Volume (K Unit) Forecast, by Application 2019 & 2032
- Table 87: Spain Vial Adaptors for Reconstitution Drug Industry Revenue (Million) Forecast, by Application 2019 & 2032
- Table 88: Spain Vial Adaptors for Reconstitution Drug Industry Volume (K Unit) Forecast, by Application 2019 & 2032
- Table 89: Rest of Europe Vial Adaptors for Reconstitution Drug Industry Revenue (Million) Forecast, by Application 2019 & 2032
- Table 90: Rest of Europe Vial Adaptors for Reconstitution Drug Industry Volume (K Unit) Forecast, by Application 2019 & 2032
- Table 91: Global Vial Adaptors for Reconstitution Drug Industry Revenue Million Forecast, by Material 2019 & 2032
- Table 92: Global Vial Adaptors for Reconstitution Drug Industry Volume K Unit Forecast, by Material 2019 & 2032
- Table 93: Global Vial Adaptors for Reconstitution Drug Industry Revenue Million Forecast, by Therapeutic Area 2019 & 2032
- Table 94: Global Vial Adaptors for Reconstitution Drug Industry Volume K Unit Forecast, by Therapeutic Area 2019 & 2032
- Table 95: Global Vial Adaptors for Reconstitution Drug Industry Revenue Million Forecast, by Country 2019 & 2032
- Table 96: Global Vial Adaptors for Reconstitution Drug Industry Volume K Unit Forecast, by Country 2019 & 2032
- Table 97: China Vial Adaptors for Reconstitution Drug Industry Revenue (Million) Forecast, by Application 2019 & 2032
- Table 98: China Vial Adaptors for Reconstitution Drug Industry Volume (K Unit) Forecast, by Application 2019 & 2032
- Table 99: Japan Vial Adaptors for Reconstitution Drug Industry Revenue (Million) Forecast, by Application 2019 & 2032
- Table 100: Japan Vial Adaptors for Reconstitution Drug Industry Volume (K Unit) Forecast, by Application 2019 & 2032
- Table 101: India Vial Adaptors for Reconstitution Drug Industry Revenue (Million) Forecast, by Application 2019 & 2032
- Table 102: India Vial Adaptors for Reconstitution Drug Industry Volume (K Unit) Forecast, by Application 2019 & 2032
- Table 103: Australia Vial Adaptors for Reconstitution Drug Industry Revenue (Million) Forecast, by Application 2019 & 2032
- Table 104: Australia Vial Adaptors for Reconstitution Drug Industry Volume (K Unit) Forecast, by Application 2019 & 2032
- Table 105: South Korea Vial Adaptors for Reconstitution Drug Industry Revenue (Million) Forecast, by Application 2019 & 2032
- Table 106: South Korea Vial Adaptors for Reconstitution Drug Industry Volume (K Unit) Forecast, by Application 2019 & 2032
- Table 107: Rest of Asia Pacific Vial Adaptors for Reconstitution Drug Industry Revenue (Million) Forecast, by Application 2019 & 2032
- Table 108: Rest of Asia Pacific Vial Adaptors for Reconstitution Drug Industry Volume (K Unit) Forecast, by Application 2019 & 2032
- Table 109: Global Vial Adaptors for Reconstitution Drug Industry Revenue Million Forecast, by Material 2019 & 2032
- Table 110: Global Vial Adaptors for Reconstitution Drug Industry Volume K Unit Forecast, by Material 2019 & 2032
- Table 111: Global Vial Adaptors for Reconstitution Drug Industry Revenue Million Forecast, by Therapeutic Area 2019 & 2032
- Table 112: Global Vial Adaptors for Reconstitution Drug Industry Volume K Unit Forecast, by Therapeutic Area 2019 & 2032
- Table 113: Global Vial Adaptors for Reconstitution Drug Industry Revenue Million Forecast, by Country 2019 & 2032
- Table 114: Global Vial Adaptors for Reconstitution Drug Industry Volume K Unit Forecast, by Country 2019 & 2032
- Table 115: GCC Vial Adaptors for Reconstitution Drug Industry Revenue (Million) Forecast, by Application 2019 & 2032
- Table 116: GCC Vial Adaptors for Reconstitution Drug Industry Volume (K Unit) Forecast, by Application 2019 & 2032
- Table 117: South Africa Vial Adaptors for Reconstitution Drug Industry Revenue (Million) Forecast, by Application 2019 & 2032
- Table 118: South Africa Vial Adaptors for Reconstitution Drug Industry Volume (K Unit) Forecast, by Application 2019 & 2032
- Table 119: Rest of Middle East and Africa Vial Adaptors for Reconstitution Drug Industry Revenue (Million) Forecast, by Application 2019 & 2032
- Table 120: Rest of Middle East and Africa Vial Adaptors for Reconstitution Drug Industry Volume (K Unit) Forecast, by Application 2019 & 2032
- Table 121: Global Vial Adaptors for Reconstitution Drug Industry Revenue Million Forecast, by Material 2019 & 2032
- Table 122: Global Vial Adaptors for Reconstitution Drug Industry Volume K Unit Forecast, by Material 2019 & 2032
- Table 123: Global Vial Adaptors for Reconstitution Drug Industry Revenue Million Forecast, by Therapeutic Area 2019 & 2032
- Table 124: Global Vial Adaptors for Reconstitution Drug Industry Volume K Unit Forecast, by Therapeutic Area 2019 & 2032
- Table 125: Global Vial Adaptors for Reconstitution Drug Industry Revenue Million Forecast, by Country 2019 & 2032
- Table 126: Global Vial Adaptors for Reconstitution Drug Industry Volume K Unit Forecast, by Country 2019 & 2032
- Table 127: Brazil Vial Adaptors for Reconstitution Drug Industry Revenue (Million) Forecast, by Application 2019 & 2032
- Table 128: Brazil Vial Adaptors for Reconstitution Drug Industry Volume (K Unit) Forecast, by Application 2019 & 2032
- Table 129: Argentina Vial Adaptors for Reconstitution Drug Industry Revenue (Million) Forecast, by Application 2019 & 2032
- Table 130: Argentina Vial Adaptors for Reconstitution Drug Industry Volume (K Unit) Forecast, by Application 2019 & 2032
- Table 131: Rest of South America Vial Adaptors for Reconstitution Drug Industry Revenue (Million) Forecast, by Application 2019 & 2032
- Table 132: Rest of South America Vial Adaptors for Reconstitution Drug Industry Volume (K Unit) Forecast, by Application 2019 & 2032
Frequently Asked Questions
1. What is the projected Compound Annual Growth Rate (CAGR) of the Vial Adaptors for Reconstitution Drug Industry?
The projected CAGR is approximately 7.30%.
2. Which companies are prominent players in the Vial Adaptors for Reconstitution Drug Industry?
Key companies in the market include Becton Dickinson and Company, West Pharmaceutical Services Inc , Randox Laboratories Ltd, Miltenyi Biotec, ARaymond, Stevanato Group, Sartorious AG, Baxter International Inc, B Braun SE, Thermo Fisher Scientific, Simplivia, Agilent Technologies.
3. What are the main segments of the Vial Adaptors for Reconstitution Drug Industry?
The market segments include Material, Therapeutic Area.
4. Can you provide details about the market size?
The market size is estimated to be USD XX Million as of 2022.
5. What are some drivers contributing to market growth?
Increasing Prevalence of Infectious Diseases; Rising Geriatric Population; Increasing Awareness of the Advantages of the Vial Adaptors.
6. What are the notable trends driving market growth?
Infectious Diseases Segment is Expected to Hold a Significant Market Share Over the Forecast Period.
7. Are there any restraints impacting market growth?
Availability of Substitutes.
8. Can you provide examples of recent developments in the market?
Dec 2022: The life science group Sartorius and Sweden-based BICO Group, a provider of instruments and consumables for bioprinting, bioscience, and automation applications, agreed on a comprehensive technology as well as sales and marketing cooperation.
9. What pricing options are available for accessing the report?
Pricing options include single-user, multi-user, and enterprise licenses priced at USD 4750, USD 5250, and USD 8750 respectively.
10. Is the market size provided in terms of value or volume?
The market size is provided in terms of value, measured in Million and volume, measured in K Unit.
11. Are there any specific market keywords associated with the report?
Yes, the market keyword associated with the report is "Vial Adaptors for Reconstitution Drug Industry," which aids in identifying and referencing the specific market segment covered.
12. How do I determine which pricing option suits my needs best?
The pricing options vary based on user requirements and access needs. Individual users may opt for single-user licenses, while businesses requiring broader access may choose multi-user or enterprise licenses for cost-effective access to the report.
13. Are there any additional resources or data provided in the Vial Adaptors for Reconstitution Drug Industry report?
While the report offers comprehensive insights, it's advisable to review the specific contents or supplementary materials provided to ascertain if additional resources or data are available.
14. How can I stay updated on further developments or reports in the Vial Adaptors for Reconstitution Drug Industry?
To stay informed about further developments, trends, and reports in the Vial Adaptors for Reconstitution Drug Industry, consider subscribing to industry newsletters, following relevant companies and organizations, or regularly checking reputable industry news sources and publications.
Methodology
Step 1 - Identification of Relevant Samples Size from Population Database


Step 2 - Approaches for Defining Global Market Size (Value, Volume* & Price*)

Note*: In applicable scenarios
Step 3 - Data Sources
Primary Research
- Web Analytics
- Survey Reports
- Research Institute
- Latest Research Reports
- Opinion Leaders
Secondary Research
- Annual Reports
- White Paper
- Latest Press Release
- Industry Association
- Paid Database
- Investor Presentations

Step 4 - Data Triangulation
Involves using different sources of information in order to increase the validity of a study
These sources are likely to be stakeholders in a program - participants, other researchers, program staff, other community members, and so on.
Then we put all data in single framework & apply various statistical tools to find out the dynamic on the market.
During the analysis stage, feedback from the stakeholder groups would be compared to determine areas of agreement as well as areas of divergence
