

Key Insights
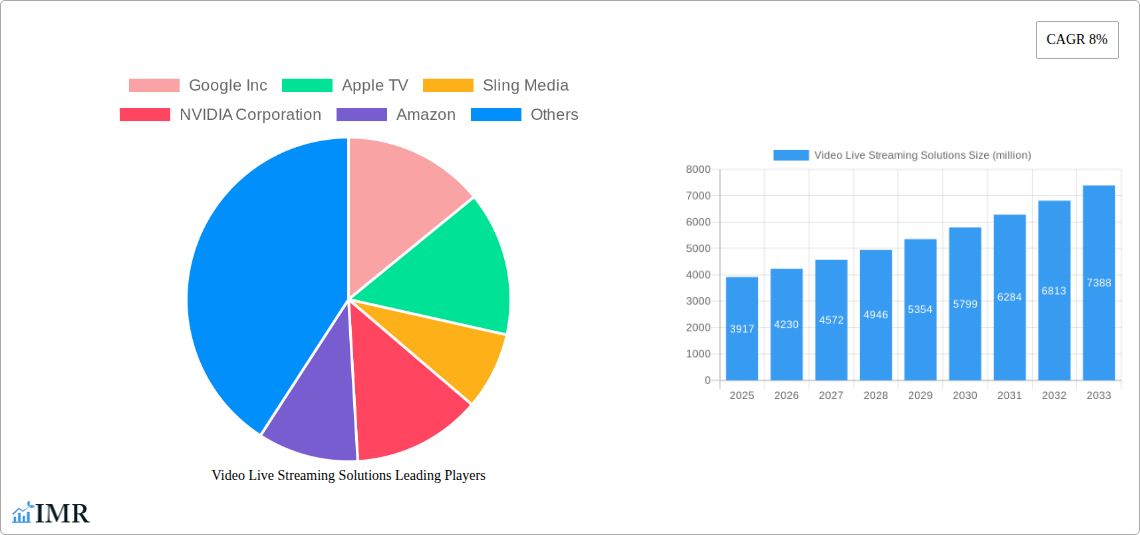
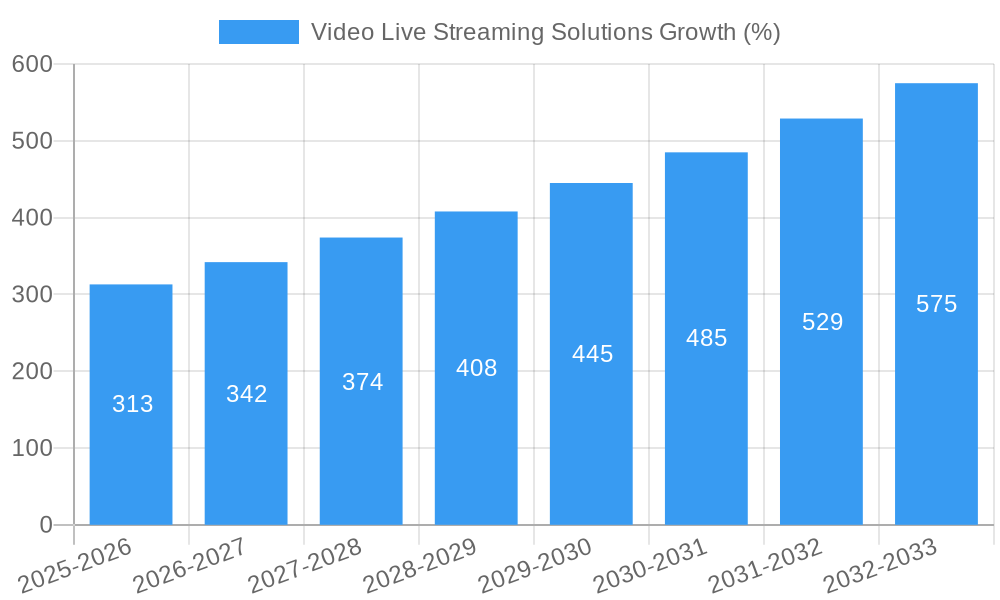
The global video live streaming solutions market, valued at $3.917 billion in 2025, is poised for significant growth, exhibiting a compound annual growth rate (CAGR) of 8% from 2025 to 2033. This robust expansion is driven by several key factors. The increasing adoption of high-speed internet and mobile broadband access globally provides the necessary infrastructure for seamless live streaming. Furthermore, the burgeoning popularity of social media platforms and their integration of live streaming functionalities fuels demand, allowing individuals and businesses to connect with audiences in real-time. The rise of e-commerce and the need for engaging product demonstrations and virtual events further contribute to market growth. Competition among major players like Google, Apple, Amazon, and others drives innovation and affordability, making live streaming solutions accessible to a broader range of users. The market is segmented by solution type (hardware, software, services), deployment mode (cloud, on-premises), and application (entertainment, education, business, etc.), each contributing to overall market dynamics. The increasing sophistication of live streaming technology, with features like interactive elements, improved video quality, and robust analytics, also play a pivotal role in market growth.
The market’s growth trajectory, however, is not without challenges. Concerns regarding data security and privacy, particularly surrounding user information and streaming content, represent a significant restraint. The need for substantial bandwidth for high-quality streaming can be a limiting factor in regions with limited internet infrastructure. Furthermore, the competitive landscape necessitates continuous innovation and adaptation to stay ahead in the rapidly evolving technological sphere. To navigate these challenges, providers are investing in robust security measures, developing solutions for bandwidth optimization, and focusing on user-friendly platforms to enhance the overall live streaming experience. The market's future success hinges on addressing these hurdles effectively while capitalizing on the ongoing digital transformation across various sectors.
Video Live Streaming Solutions Market Report: 2019-2033
This comprehensive report provides a detailed analysis of the Video Live Streaming Solutions market, encompassing market dynamics, growth trends, regional insights, product landscapes, key players, and future outlook. The study period spans from 2019 to 2033, with 2025 serving as the base and estimated year. The forecast period covers 2025-2033, and the historical period encompasses 2019-2024. The report caters to industry professionals, investors, and strategic decision-makers seeking in-depth knowledge of this rapidly evolving market. The total market size in 2025 is estimated at $XX billion.
Video Live Streaming Solutions Market Dynamics & Structure
This section analyzes the market's competitive landscape, technological advancements, regulatory influences, and market trends. The video live streaming solutions market is experiencing robust growth driven by increasing internet penetration, the rise of mobile video consumption, and the expanding adoption of cloud-based platforms.
Market Concentration: The market exhibits moderate concentration with several dominant players controlling significant market share. In 2025, the top 5 players held approximately XX% of the market share.
Technological Innovation Drivers: Advancements in video compression technologies (e.g., HEVC, VP9), the proliferation of 5G networks, and the development of sophisticated streaming platforms contribute to market expansion.
Regulatory Frameworks: Government regulations concerning data privacy, content moderation, and bandwidth allocation influence market growth trajectories. Compliance costs can act as a barrier to entry for smaller players.
Competitive Product Substitutes: Traditional broadcasting and on-demand video services pose a competitive threat. However, live streaming's unique real-time engagement differentiates it and fuels continued market growth.
End-User Demographics: The market caters to a diverse range of end-users including businesses, individuals, and educational institutions. The growth is primarily driven by the rising adoption of live streaming in entertainment, education, and corporate communications.
M&A Trends: The market has witnessed several mergers and acquisitions in recent years, with larger companies consolidating their position and acquiring smaller, specialized players. The volume of M&A deals in the historical period averaged approximately XX deals annually, indicating high sector activity.
- Market Share (2025): Top 5 players - XX%; Others - XX%
- Average Annual M&A Deals (2019-2024): XX
- Innovation Barriers: High initial investment costs for infrastructure, complexity of streaming technologies.
Video Live Streaming Solutions Growth Trends & Insights
The global video live streaming solutions market is expected to witness significant growth throughout the forecast period (2025-2033). Driven by factors such as increased internet penetration, rising mobile video consumption, and the expanding adoption of cloud-based streaming platforms, the market is poised for substantial expansion. The Compound Annual Growth Rate (CAGR) is projected to be XX% during the forecast period, with market penetration rates rising from XX% in 2025 to XX% by 2033. The shift in consumer preference towards on-demand and real-time content significantly impacts the market dynamics. Technological disruptions, such as the adoption of 5G and advancements in video streaming technologies, further propel market growth. The integration of live streaming into various industries, like gaming, e-commerce, and education, expands the market potential. Market size is expected to reach $XX billion by 2033.
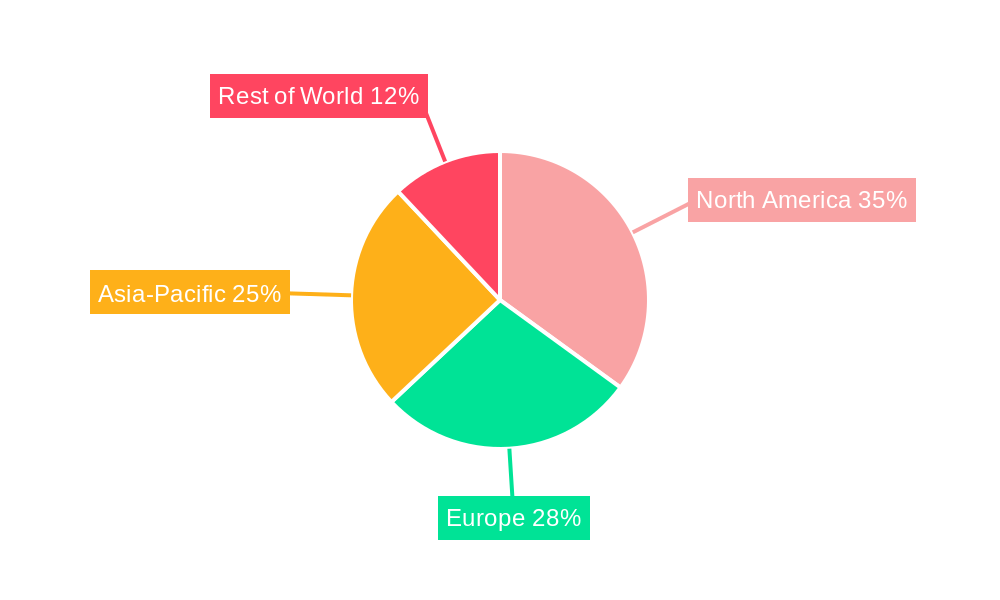
Dominant Regions, Countries, or Segments in Video Live Streaming Solutions
North America currently holds the largest market share, driven by robust infrastructure, high internet penetration, and a strong technological base. Asia-Pacific is projected to witness significant growth over the next decade due to rapidly increasing internet usage and smartphone adoption. The Entertainment segment holds a dominant position within the market.
- Key Drivers (North America): Developed infrastructure, high internet penetration, substantial technological advancements, strong consumer adoption.
- Key Drivers (Asia-Pacific): Rapid increase in internet and smartphone penetration, expanding middle class, increasing consumer spending on entertainment.
- Key Drivers (Entertainment Segment): High demand for live streaming of sporting events, concerts, and other entertainment content; the rise of social media influencers.
Video Live Streaming Solutions Product Landscape
The market offers a diverse range of solutions, including encoding/decoding software, cloud-based streaming platforms, content delivery networks (CDNs), and hardware encoders. These solutions cater to various applications and performance metrics, such as latency, scalability, and bitrate. Unique selling propositions often center around ease of use, affordability, and specialized features tailored for specific use cases. Advancements in AI-powered features (e.g., automated content moderation, personalized recommendations) enhance user experience and further fuel market growth.
Key Drivers, Barriers & Challenges in Video Live Streaming Solutions
Key Drivers:
- Increasing internet and mobile penetration
- Rising demand for real-time interactive content
- Technological advancements in video streaming technologies
- Growing adoption of cloud-based solutions
Challenges:
- High infrastructure costs
- Bandwidth limitations in certain regions
- Regulatory compliance and content moderation issues
- Competitive landscape with established players
Emerging Opportunities in Video Live Streaming Solutions
- Expansion into untapped markets (e.g., rural areas with improving infrastructure)
- Integration with emerging technologies (e.g., VR/AR, IoT)
- Growth in niche applications (e.g., remote healthcare, online education)
- Development of personalized and interactive streaming experiences.
Growth Accelerators in the Video Live Streaming Solutions Industry
Technological breakthroughs in video compression, 5G network expansion, and the growing adoption of cloud-based platforms are all major growth catalysts. Strategic partnerships between technology providers and content creators further enhance market reach. Market expansion strategies focusing on emerging economies hold substantial growth potential.
Key Players Shaping the Video Live Streaming Solutions Market
- Google Inc
- Apple TV
- Sling Media
- NVIDIA Corporation
- Amazon
- Wowza Media Systems, LLC.
- Telestream, LLC
- Sonic Foundry
- Qumu Enterprise Video
- DigiVive Services Pvt. Ltd.
- Haivision
- IBM
- Livestream
- Ooyala, Inc
- Polycom
Notable Milestones in Video Live Streaming Solutions Sector
- 2020: Significant increase in live streaming adoption due to COVID-19 lockdowns.
- 2021: Launch of several new cloud-based streaming platforms with enhanced features.
- 2022: Major investments in 5G infrastructure globally.
- 2023: Increased focus on AI-powered video analytics and personalized recommendations.
- 2024: Several mergers and acquisitions within the sector.
In-Depth Video Live Streaming Solutions Market Outlook
The video live streaming solutions market exhibits strong long-term growth prospects, driven by continued technological innovation, expanding internet penetration, and evolving consumer preferences. Strategic partnerships and expansion into untapped markets will further fuel growth. Focus on enhancing user experiences through personalized content and interactive features is essential for sustained success in this dynamic market. The market is predicted to see consistent growth in the coming years, with potential for significant market expansion through integration with metaverse technologies and further penetration into emerging markets.
Video Live Streaming Solutions Segmentation
-
1. Application
- 1.1. Gaming
- 1.2. Government
- 1.3. Education
- 1.4. Media and Entertainment
- 1.5. Retail
- 1.6. Healthcare
- 1.7. Others
-
2. Type
- 2.1. Publishing
- 2.2. Delivery and Distribution
- 2.3. Editing and Transcoding
- 2.4. Video Security
- 2.5. Analytics
- 2.6. Archiving
- 2.7. Captioning
Video Live Streaming Solutions Segmentation By Geography
-
1. North America
- 1.1. United States
- 1.2. Canada
- 1.3. Mexico
-
2. South America
- 2.1. Brazil
- 2.2. Argentina
- 2.3. Rest of South America
-
3. Europe
- 3.1. United Kingdom
- 3.2. Germany
- 3.3. France
- 3.4. Italy
- 3.5. Spain
- 3.6. Russia
- 3.7. Benelux
- 3.8. Nordics
- 3.9. Rest of Europe
-
4. Middle East & Africa
- 4.1. Turkey
- 4.2. Israel
- 4.3. GCC
- 4.4. North Africa
- 4.5. South Africa
- 4.6. Rest of Middle East & Africa
-
5. Asia Pacific
- 5.1. China
- 5.2. India
- 5.3. Japan
- 5.4. South Korea
- 5.5. ASEAN
- 5.6. Oceania
- 5.7. Rest of Asia Pacific
Video Live Streaming Solutions REPORT HIGHLIGHTS
| Aspects | Details |
|---|---|
| Study Period | 2019-2033 |
| Base Year | 2024 |
| Estimated Year | 2025 |
| Forecast Period | 2025-2033 |
| Historical Period | 2019-2024 |
| Growth Rate | CAGR of 8% from 2019-2033 |
| Segmentation |
|
Table of Contents
- 1. Introduction
- 1.1. Research Scope
- 1.2. Market Segmentation
- 1.3. Research Methodology
- 1.4. Definitions and Assumptions
- 2. Executive Summary
- 2.1. Introduction
- 3. Market Dynamics
- 3.1. Introduction
- 3.2. Market Drivers
- 3.3. Market Restrains
- 3.4. Market Trends
- 4. Market Factor Analysis
- 4.1. Porters Five Forces
- 4.2. Supply/Value Chain
- 4.3. PESTEL analysis
- 4.4. Market Entropy
- 4.5. Patent/Trademark Analysis
- 5. Global Video Live Streaming Solutions Analysis, Insights and Forecast, 2019-2031
- 5.1. Market Analysis, Insights and Forecast - by Application
- 5.1.1. Gaming
- 5.1.2. Government
- 5.1.3. Education
- 5.1.4. Media and Entertainment
- 5.1.5. Retail
- 5.1.6. Healthcare
- 5.1.7. Others
- 5.2. Market Analysis, Insights and Forecast - by Type
- 5.2.1. Publishing
- 5.2.2. Delivery and Distribution
- 5.2.3. Editing and Transcoding
- 5.2.4. Video Security
- 5.2.5. Analytics
- 5.2.6. Archiving
- 5.2.7. Captioning
- 5.3. Market Analysis, Insights and Forecast - by Region
- 5.3.1. North America
- 5.3.2. South America
- 5.3.3. Europe
- 5.3.4. Middle East & Africa
- 5.3.5. Asia Pacific
- 5.1. Market Analysis, Insights and Forecast - by Application
- 6. North America Video Live Streaming Solutions Analysis, Insights and Forecast, 2019-2031
- 6.1. Market Analysis, Insights and Forecast - by Application
- 6.1.1. Gaming
- 6.1.2. Government
- 6.1.3. Education
- 6.1.4. Media and Entertainment
- 6.1.5. Retail
- 6.1.6. Healthcare
- 6.1.7. Others
- 6.2. Market Analysis, Insights and Forecast - by Type
- 6.2.1. Publishing
- 6.2.2. Delivery and Distribution
- 6.2.3. Editing and Transcoding
- 6.2.4. Video Security
- 6.2.5. Analytics
- 6.2.6. Archiving
- 6.2.7. Captioning
- 6.1. Market Analysis, Insights and Forecast - by Application
- 7. South America Video Live Streaming Solutions Analysis, Insights and Forecast, 2019-2031
- 7.1. Market Analysis, Insights and Forecast - by Application
- 7.1.1. Gaming
- 7.1.2. Government
- 7.1.3. Education
- 7.1.4. Media and Entertainment
- 7.1.5. Retail
- 7.1.6. Healthcare
- 7.1.7. Others
- 7.2. Market Analysis, Insights and Forecast - by Type
- 7.2.1. Publishing
- 7.2.2. Delivery and Distribution
- 7.2.3. Editing and Transcoding
- 7.2.4. Video Security
- 7.2.5. Analytics
- 7.2.6. Archiving
- 7.2.7. Captioning
- 7.1. Market Analysis, Insights and Forecast - by Application
- 8. Europe Video Live Streaming Solutions Analysis, Insights and Forecast, 2019-2031
- 8.1. Market Analysis, Insights and Forecast - by Application
- 8.1.1. Gaming
- 8.1.2. Government
- 8.1.3. Education
- 8.1.4. Media and Entertainment
- 8.1.5. Retail
- 8.1.6. Healthcare
- 8.1.7. Others
- 8.2. Market Analysis, Insights and Forecast - by Type
- 8.2.1. Publishing
- 8.2.2. Delivery and Distribution
- 8.2.3. Editing and Transcoding
- 8.2.4. Video Security
- 8.2.5. Analytics
- 8.2.6. Archiving
- 8.2.7. Captioning
- 8.1. Market Analysis, Insights and Forecast - by Application
- 9. Middle East & Africa Video Live Streaming Solutions Analysis, Insights and Forecast, 2019-2031
- 9.1. Market Analysis, Insights and Forecast - by Application
- 9.1.1. Gaming
- 9.1.2. Government
- 9.1.3. Education
- 9.1.4. Media and Entertainment
- 9.1.5. Retail
- 9.1.6. Healthcare
- 9.1.7. Others
- 9.2. Market Analysis, Insights and Forecast - by Type
- 9.2.1. Publishing
- 9.2.2. Delivery and Distribution
- 9.2.3. Editing and Transcoding
- 9.2.4. Video Security
- 9.2.5. Analytics
- 9.2.6. Archiving
- 9.2.7. Captioning
- 9.1. Market Analysis, Insights and Forecast - by Application
- 10. Asia Pacific Video Live Streaming Solutions Analysis, Insights and Forecast, 2019-2031
- 10.1. Market Analysis, Insights and Forecast - by Application
- 10.1.1. Gaming
- 10.1.2. Government
- 10.1.3. Education
- 10.1.4. Media and Entertainment
- 10.1.5. Retail
- 10.1.6. Healthcare
- 10.1.7. Others
- 10.2. Market Analysis, Insights and Forecast - by Type
- 10.2.1. Publishing
- 10.2.2. Delivery and Distribution
- 10.2.3. Editing and Transcoding
- 10.2.4. Video Security
- 10.2.5. Analytics
- 10.2.6. Archiving
- 10.2.7. Captioning
- 10.1. Market Analysis, Insights and Forecast - by Application
- 11. Competitive Analysis
- 11.1. Global Market Share Analysis 2024
- 11.2. Company Profiles
- 11.2.1 Google Inc
- 11.2.1.1. Overview
- 11.2.1.2. Products
- 11.2.1.3. SWOT Analysis
- 11.2.1.4. Recent Developments
- 11.2.1.5. Financials (Based on Availability)
- 11.2.2 Apple TV
- 11.2.2.1. Overview
- 11.2.2.2. Products
- 11.2.2.3. SWOT Analysis
- 11.2.2.4. Recent Developments
- 11.2.2.5. Financials (Based on Availability)
- 11.2.3 Sling Media
- 11.2.3.1. Overview
- 11.2.3.2. Products
- 11.2.3.3. SWOT Analysis
- 11.2.3.4. Recent Developments
- 11.2.3.5. Financials (Based on Availability)
- 11.2.4 NVIDIA Corporation
- 11.2.4.1. Overview
- 11.2.4.2. Products
- 11.2.4.3. SWOT Analysis
- 11.2.4.4. Recent Developments
- 11.2.4.5. Financials (Based on Availability)
- 11.2.5 Amazon
- 11.2.5.1. Overview
- 11.2.5.2. Products
- 11.2.5.3. SWOT Analysis
- 11.2.5.4. Recent Developments
- 11.2.5.5. Financials (Based on Availability)
- 11.2.6 Wowza Media Systems LLC.
- 11.2.6.1. Overview
- 11.2.6.2. Products
- 11.2.6.3. SWOT Analysis
- 11.2.6.4. Recent Developments
- 11.2.6.5. Financials (Based on Availability)
- 11.2.7 Telestream LLC
- 11.2.7.1. Overview
- 11.2.7.2. Products
- 11.2.7.3. SWOT Analysis
- 11.2.7.4. Recent Developments
- 11.2.7.5. Financials (Based on Availability)
- 11.2.8 Sonic Foundry
- 11.2.8.1. Overview
- 11.2.8.2. Products
- 11.2.8.3. SWOT Analysis
- 11.2.8.4. Recent Developments
- 11.2.8.5. Financials (Based on Availability)
- 11.2.9 Qumu Enterprise Video
- 11.2.9.1. Overview
- 11.2.9.2. Products
- 11.2.9.3. SWOT Analysis
- 11.2.9.4. Recent Developments
- 11.2.9.5. Financials (Based on Availability)
- 11.2.10 DigiVive Services Pvt. Ltd.
- 11.2.10.1. Overview
- 11.2.10.2. Products
- 11.2.10.3. SWOT Analysis
- 11.2.10.4. Recent Developments
- 11.2.10.5. Financials (Based on Availability)
- 11.2.11 Haivision
- 11.2.11.1. Overview
- 11.2.11.2. Products
- 11.2.11.3. SWOT Analysis
- 11.2.11.4. Recent Developments
- 11.2.11.5. Financials (Based on Availability)
- 11.2.12 IBM
- 11.2.12.1. Overview
- 11.2.12.2. Products
- 11.2.12.3. SWOT Analysis
- 11.2.12.4. Recent Developments
- 11.2.12.5. Financials (Based on Availability)
- 11.2.13 Livestream
- 11.2.13.1. Overview
- 11.2.13.2. Products
- 11.2.13.3. SWOT Analysis
- 11.2.13.4. Recent Developments
- 11.2.13.5. Financials (Based on Availability)
- 11.2.14 Ooyala Inc
- 11.2.14.1. Overview
- 11.2.14.2. Products
- 11.2.14.3. SWOT Analysis
- 11.2.14.4. Recent Developments
- 11.2.14.5. Financials (Based on Availability)
- 11.2.15 Polycom
- 11.2.15.1. Overview
- 11.2.15.2. Products
- 11.2.15.3. SWOT Analysis
- 11.2.15.4. Recent Developments
- 11.2.15.5. Financials (Based on Availability)
- 11.2.1 Google Inc
List of Figures
- Figure 1: Global Video Live Streaming Solutions Revenue Breakdown (million, %) by Region 2024 & 2032
- Figure 2: North America Video Live Streaming Solutions Revenue (million), by Application 2024 & 2032
- Figure 3: North America Video Live Streaming Solutions Revenue Share (%), by Application 2024 & 2032
- Figure 4: North America Video Live Streaming Solutions Revenue (million), by Type 2024 & 2032
- Figure 5: North America Video Live Streaming Solutions Revenue Share (%), by Type 2024 & 2032
- Figure 6: North America Video Live Streaming Solutions Revenue (million), by Country 2024 & 2032
- Figure 7: North America Video Live Streaming Solutions Revenue Share (%), by Country 2024 & 2032
- Figure 8: South America Video Live Streaming Solutions Revenue (million), by Application 2024 & 2032
- Figure 9: South America Video Live Streaming Solutions Revenue Share (%), by Application 2024 & 2032
- Figure 10: South America Video Live Streaming Solutions Revenue (million), by Type 2024 & 2032
- Figure 11: South America Video Live Streaming Solutions Revenue Share (%), by Type 2024 & 2032
- Figure 12: South America Video Live Streaming Solutions Revenue (million), by Country 2024 & 2032
- Figure 13: South America Video Live Streaming Solutions Revenue Share (%), by Country 2024 & 2032
- Figure 14: Europe Video Live Streaming Solutions Revenue (million), by Application 2024 & 2032
- Figure 15: Europe Video Live Streaming Solutions Revenue Share (%), by Application 2024 & 2032
- Figure 16: Europe Video Live Streaming Solutions Revenue (million), by Type 2024 & 2032
- Figure 17: Europe Video Live Streaming Solutions Revenue Share (%), by Type 2024 & 2032
- Figure 18: Europe Video Live Streaming Solutions Revenue (million), by Country 2024 & 2032
- Figure 19: Europe Video Live Streaming Solutions Revenue Share (%), by Country 2024 & 2032
- Figure 20: Middle East & Africa Video Live Streaming Solutions Revenue (million), by Application 2024 & 2032
- Figure 21: Middle East & Africa Video Live Streaming Solutions Revenue Share (%), by Application 2024 & 2032
- Figure 22: Middle East & Africa Video Live Streaming Solutions Revenue (million), by Type 2024 & 2032
- Figure 23: Middle East & Africa Video Live Streaming Solutions Revenue Share (%), by Type 2024 & 2032
- Figure 24: Middle East & Africa Video Live Streaming Solutions Revenue (million), by Country 2024 & 2032
- Figure 25: Middle East & Africa Video Live Streaming Solutions Revenue Share (%), by Country 2024 & 2032
- Figure 26: Asia Pacific Video Live Streaming Solutions Revenue (million), by Application 2024 & 2032
- Figure 27: Asia Pacific Video Live Streaming Solutions Revenue Share (%), by Application 2024 & 2032
- Figure 28: Asia Pacific Video Live Streaming Solutions Revenue (million), by Type 2024 & 2032
- Figure 29: Asia Pacific Video Live Streaming Solutions Revenue Share (%), by Type 2024 & 2032
- Figure 30: Asia Pacific Video Live Streaming Solutions Revenue (million), by Country 2024 & 2032
- Figure 31: Asia Pacific Video Live Streaming Solutions Revenue Share (%), by Country 2024 & 2032
List of Tables
- Table 1: Global Video Live Streaming Solutions Revenue million Forecast, by Region 2019 & 2032
- Table 2: Global Video Live Streaming Solutions Revenue million Forecast, by Application 2019 & 2032
- Table 3: Global Video Live Streaming Solutions Revenue million Forecast, by Type 2019 & 2032
- Table 4: Global Video Live Streaming Solutions Revenue million Forecast, by Region 2019 & 2032
- Table 5: Global Video Live Streaming Solutions Revenue million Forecast, by Application 2019 & 2032
- Table 6: Global Video Live Streaming Solutions Revenue million Forecast, by Type 2019 & 2032
- Table 7: Global Video Live Streaming Solutions Revenue million Forecast, by Country 2019 & 2032
- Table 8: United States Video Live Streaming Solutions Revenue (million) Forecast, by Application 2019 & 2032
- Table 9: Canada Video Live Streaming Solutions Revenue (million) Forecast, by Application 2019 & 2032
- Table 10: Mexico Video Live Streaming Solutions Revenue (million) Forecast, by Application 2019 & 2032
- Table 11: Global Video Live Streaming Solutions Revenue million Forecast, by Application 2019 & 2032
- Table 12: Global Video Live Streaming Solutions Revenue million Forecast, by Type 2019 & 2032
- Table 13: Global Video Live Streaming Solutions Revenue million Forecast, by Country 2019 & 2032
- Table 14: Brazil Video Live Streaming Solutions Revenue (million) Forecast, by Application 2019 & 2032
- Table 15: Argentina Video Live Streaming Solutions Revenue (million) Forecast, by Application 2019 & 2032
- Table 16: Rest of South America Video Live Streaming Solutions Revenue (million) Forecast, by Application 2019 & 2032
- Table 17: Global Video Live Streaming Solutions Revenue million Forecast, by Application 2019 & 2032
- Table 18: Global Video Live Streaming Solutions Revenue million Forecast, by Type 2019 & 2032
- Table 19: Global Video Live Streaming Solutions Revenue million Forecast, by Country 2019 & 2032
- Table 20: United Kingdom Video Live Streaming Solutions Revenue (million) Forecast, by Application 2019 & 2032
- Table 21: Germany Video Live Streaming Solutions Revenue (million) Forecast, by Application 2019 & 2032
- Table 22: France Video Live Streaming Solutions Revenue (million) Forecast, by Application 2019 & 2032
- Table 23: Italy Video Live Streaming Solutions Revenue (million) Forecast, by Application 2019 & 2032
- Table 24: Spain Video Live Streaming Solutions Revenue (million) Forecast, by Application 2019 & 2032
- Table 25: Russia Video Live Streaming Solutions Revenue (million) Forecast, by Application 2019 & 2032
- Table 26: Benelux Video Live Streaming Solutions Revenue (million) Forecast, by Application 2019 & 2032
- Table 27: Nordics Video Live Streaming Solutions Revenue (million) Forecast, by Application 2019 & 2032
- Table 28: Rest of Europe Video Live Streaming Solutions Revenue (million) Forecast, by Application 2019 & 2032
- Table 29: Global Video Live Streaming Solutions Revenue million Forecast, by Application 2019 & 2032
- Table 30: Global Video Live Streaming Solutions Revenue million Forecast, by Type 2019 & 2032
- Table 31: Global Video Live Streaming Solutions Revenue million Forecast, by Country 2019 & 2032
- Table 32: Turkey Video Live Streaming Solutions Revenue (million) Forecast, by Application 2019 & 2032
- Table 33: Israel Video Live Streaming Solutions Revenue (million) Forecast, by Application 2019 & 2032
- Table 34: GCC Video Live Streaming Solutions Revenue (million) Forecast, by Application 2019 & 2032
- Table 35: North Africa Video Live Streaming Solutions Revenue (million) Forecast, by Application 2019 & 2032
- Table 36: South Africa Video Live Streaming Solutions Revenue (million) Forecast, by Application 2019 & 2032
- Table 37: Rest of Middle East & Africa Video Live Streaming Solutions Revenue (million) Forecast, by Application 2019 & 2032
- Table 38: Global Video Live Streaming Solutions Revenue million Forecast, by Application 2019 & 2032
- Table 39: Global Video Live Streaming Solutions Revenue million Forecast, by Type 2019 & 2032
- Table 40: Global Video Live Streaming Solutions Revenue million Forecast, by Country 2019 & 2032
- Table 41: China Video Live Streaming Solutions Revenue (million) Forecast, by Application 2019 & 2032
- Table 42: India Video Live Streaming Solutions Revenue (million) Forecast, by Application 2019 & 2032
- Table 43: Japan Video Live Streaming Solutions Revenue (million) Forecast, by Application 2019 & 2032
- Table 44: South Korea Video Live Streaming Solutions Revenue (million) Forecast, by Application 2019 & 2032
- Table 45: ASEAN Video Live Streaming Solutions Revenue (million) Forecast, by Application 2019 & 2032
- Table 46: Oceania Video Live Streaming Solutions Revenue (million) Forecast, by Application 2019 & 2032
- Table 47: Rest of Asia Pacific Video Live Streaming Solutions Revenue (million) Forecast, by Application 2019 & 2032
Frequently Asked Questions
1. What is the projected Compound Annual Growth Rate (CAGR) of the Video Live Streaming Solutions?
The projected CAGR is approximately 8%.
2. Which companies are prominent players in the Video Live Streaming Solutions?
Key companies in the market include Google Inc, Apple TV, Sling Media, NVIDIA Corporation, Amazon, Wowza Media Systems, LLC., Telestream, LLC, Sonic Foundry, Qumu Enterprise Video, DigiVive Services Pvt. Ltd., Haivision, IBM, Livestream, Ooyala, Inc, Polycom.
3. What are the main segments of the Video Live Streaming Solutions?
The market segments include Application, Type.
4. Can you provide details about the market size?
The market size is estimated to be USD 3917 million as of 2022.
5. What are some drivers contributing to market growth?
N/A
6. What are the notable trends driving market growth?
N/A
7. Are there any restraints impacting market growth?
N/A
8. Can you provide examples of recent developments in the market?
N/A
9. What pricing options are available for accessing the report?
Pricing options include single-user, multi-user, and enterprise licenses priced at USD 2900.00, USD 4350.00, and USD 5800.00 respectively.
10. Is the market size provided in terms of value or volume?
The market size is provided in terms of value, measured in million.
11. Are there any specific market keywords associated with the report?
Yes, the market keyword associated with the report is "Video Live Streaming Solutions," which aids in identifying and referencing the specific market segment covered.
12. How do I determine which pricing option suits my needs best?
The pricing options vary based on user requirements and access needs. Individual users may opt for single-user licenses, while businesses requiring broader access may choose multi-user or enterprise licenses for cost-effective access to the report.
13. Are there any additional resources or data provided in the Video Live Streaming Solutions report?
While the report offers comprehensive insights, it's advisable to review the specific contents or supplementary materials provided to ascertain if additional resources or data are available.
14. How can I stay updated on further developments or reports in the Video Live Streaming Solutions?
To stay informed about further developments, trends, and reports in the Video Live Streaming Solutions, consider subscribing to industry newsletters, following relevant companies and organizations, or regularly checking reputable industry news sources and publications.
Methodology
Step 1 - Identification of Relevant Samples Size from Population Database


Step 2 - Approaches for Defining Global Market Size (Value, Volume* & Price*)

Note*: In applicable scenarios
Step 3 - Data Sources
Primary Research
- Web Analytics
- Survey Reports
- Research Institute
- Latest Research Reports
- Opinion Leaders
Secondary Research
- Annual Reports
- White Paper
- Latest Press Release
- Industry Association
- Paid Database
- Investor Presentations

Step 4 - Data Triangulation
Involves using different sources of information in order to increase the validity of a study
These sources are likely to be stakeholders in a program - participants, other researchers, program staff, other community members, and so on.
Then we put all data in single framework & apply various statistical tools to find out the dynamic on the market.
During the analysis stage, feedback from the stakeholder groups would be compared to determine areas of agreement as well as areas of divergence
