

Key Insights
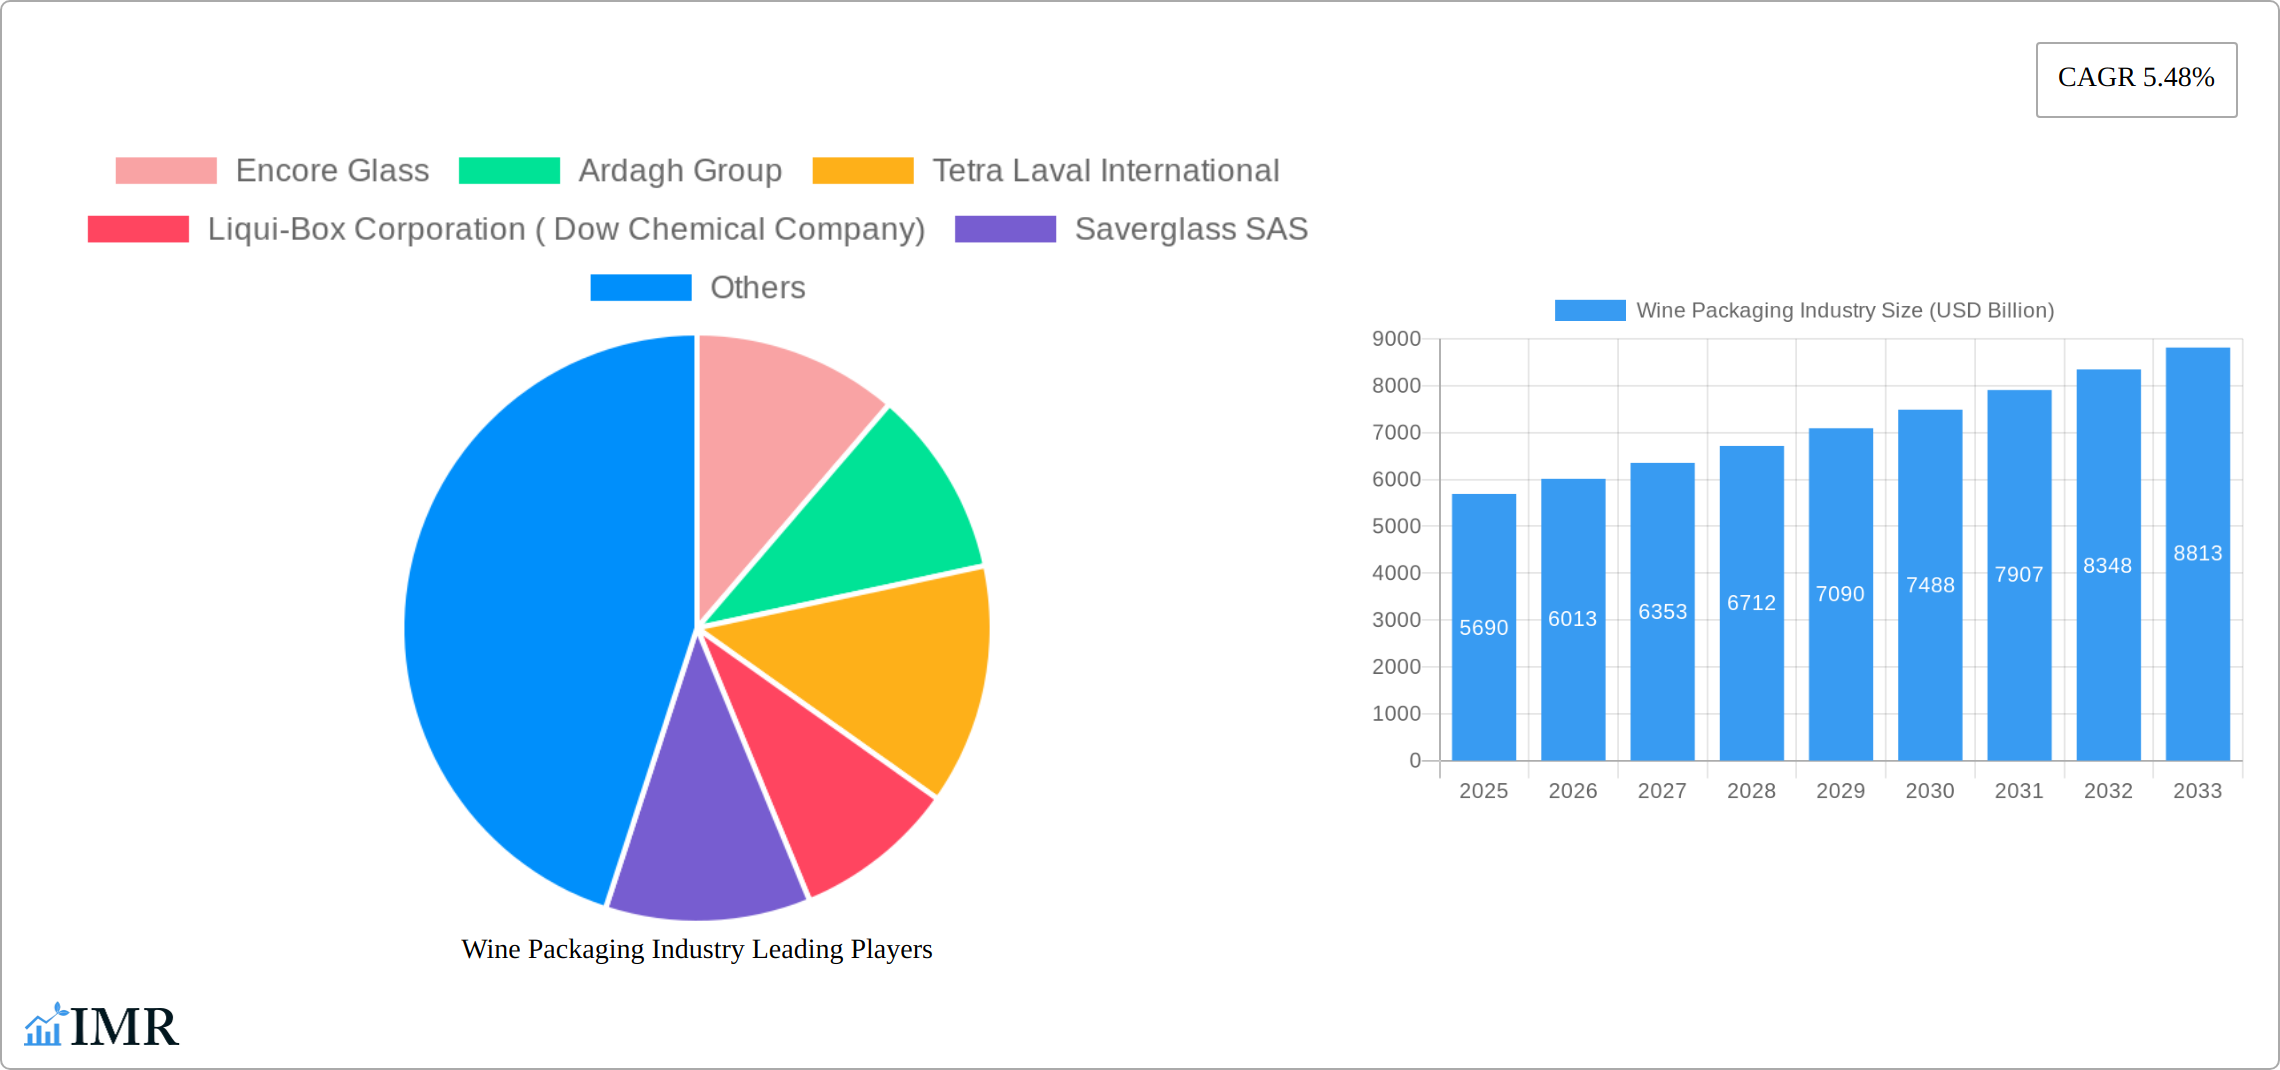
The global wine packaging market, valued at $5.69 billion in 2025, is projected to experience robust growth, driven by several key factors. The increasing popularity of wine, particularly among younger demographics, fuels demand for innovative and attractive packaging solutions. Sustainability concerns are also significantly impacting the market, with consumers increasingly favoring eco-friendly options like lightweight glass bottles and recycled materials. This trend is pushing manufacturers to invest in sustainable packaging technologies and materials, leading to a shift away from traditional heavy glass bottles towards lighter alternatives and increased adoption of bag-in-box packaging. Furthermore, the growth of e-commerce and direct-to-consumer wine sales necessitates robust and safe packaging to prevent damage during transit. Premiumization within the wine industry, with the rise of craft wines and high-end labels, also drives demand for sophisticated packaging designs that enhance brand perception and shelf appeal. The market is segmented by material type (glass, plastic, metal, paperboard) and product type (glass bottles, plastic bottles, bag-in-box, other), with glass bottles currently holding the largest market share due to their association with premium quality. However, plastic and bag-in-box packaging are gaining traction due to their cost-effectiveness and environmental advantages in certain segments. Competition among major players, including Encore Glass, Ardagh Group, Tetra Laval International, and others, is intense, with companies constantly striving to innovate and differentiate their offerings. Regional variations exist, with North America and Europe currently leading the market, while Asia-Pacific is expected to witness significant growth in the coming years due to rising disposable incomes and evolving consumer preferences.
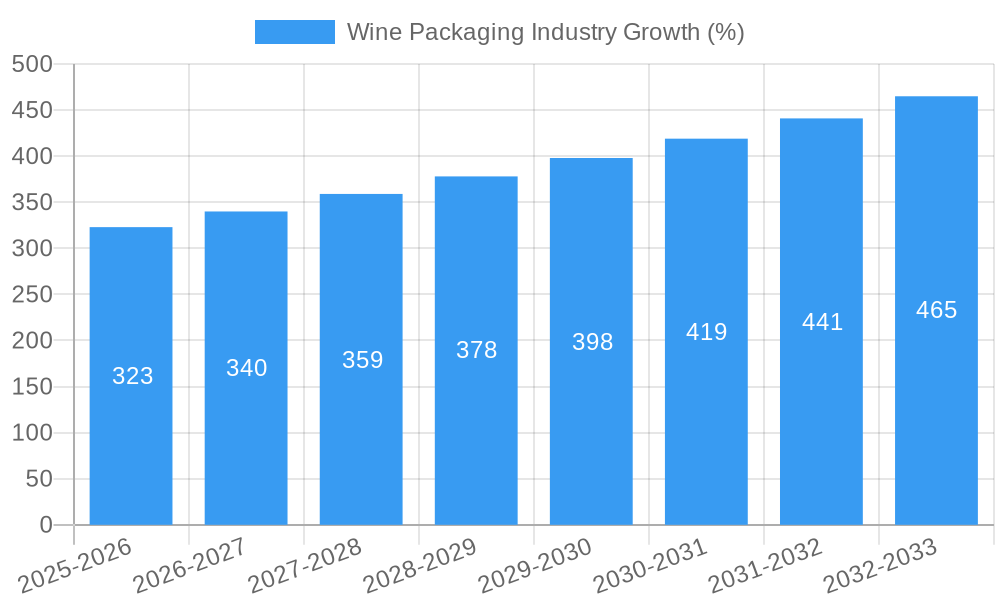
The 5.48% CAGR projected for the market indicates continuous growth through 2033. This growth is likely to be influenced by technological advancements in packaging materials and design, further emphasizing sustainable practices, and the ongoing evolution of consumer preferences and buying habits. Specific regional growth will be influenced by local economic conditions, regulatory changes concerning packaging materials, and varying degrees of consumer adoption of sustainable packaging options. The competitive landscape will continue to see mergers and acquisitions, strategic partnerships, and innovation in areas like lightweighting, improved barrier properties, and enhanced labeling technologies. Companies will need to effectively adapt to these changes and cater to the evolving needs of both producers and consumers to maintain market share and profitability.
Wine Packaging Industry Market Report: 2019-2033
This comprehensive report provides an in-depth analysis of the global wine packaging market, encompassing historical data (2019-2024), current estimations (2025), and future projections (2025-2033). The report is crucial for industry professionals, investors, and stakeholders seeking to understand market dynamics, growth trends, and key players shaping this lucrative sector. The market is expected to reach xx Billion USD by 2033.
Wine Packaging Industry Market Dynamics & Structure
The wine packaging market is characterized by moderate concentration, with several large players holding significant market share. The industry is driven by technological innovation in materials, sustainable packaging solutions, and evolving consumer preferences. Stringent regulatory frameworks regarding material safety and sustainability also influence market dynamics. Competitive pressures exist from substitute materials and packaging types, necessitating continuous innovation. Mergers and acquisitions (M&A) activity is relatively frequent, as larger players seek to expand their market presence and product portfolios. The historical period (2019-2024) showed an average of xx M&A deals per year, with a total market value of xx Billion USD.
- Market Concentration: Moderately concentrated, with top 5 players holding approximately xx% market share.
- Technological Drivers: Lightweighting, sustainable materials (recycled glass, bioplastics), improved barrier properties, and innovative closures.
- Regulatory Landscape: Increasingly stringent regulations regarding material safety, recyclability, and environmental impact.
- Competitive Substitutes: Alternative packaging formats (e.g., cans, pouches) are increasing competition.
- End-User Demographics: Growing demand from premium wine segments and e-commerce channels drives market expansion.
- M&A Activity: Consolidation is expected to continue, driven by cost efficiencies and broader market access.
Wine Packaging Industry Growth Trends & Insights
The wine packaging market exhibits robust growth, driven by several factors including the increasing global wine consumption, the preference for premium wines, and the growth of e-commerce wine sales. The market witnessed a CAGR of xx% during the historical period (2019-2024), and this growth is projected to continue at a CAGR of xx% during the forecast period (2025-2033). Technological advancements, such as lighter weight bottles and sustainable packaging solutions, are further fueling market expansion. Consumer preference for eco-friendly options drives the adoption of sustainable materials. Market penetration of sustainable packaging materials is expected to increase from xx% in 2025 to xx% by 2033.
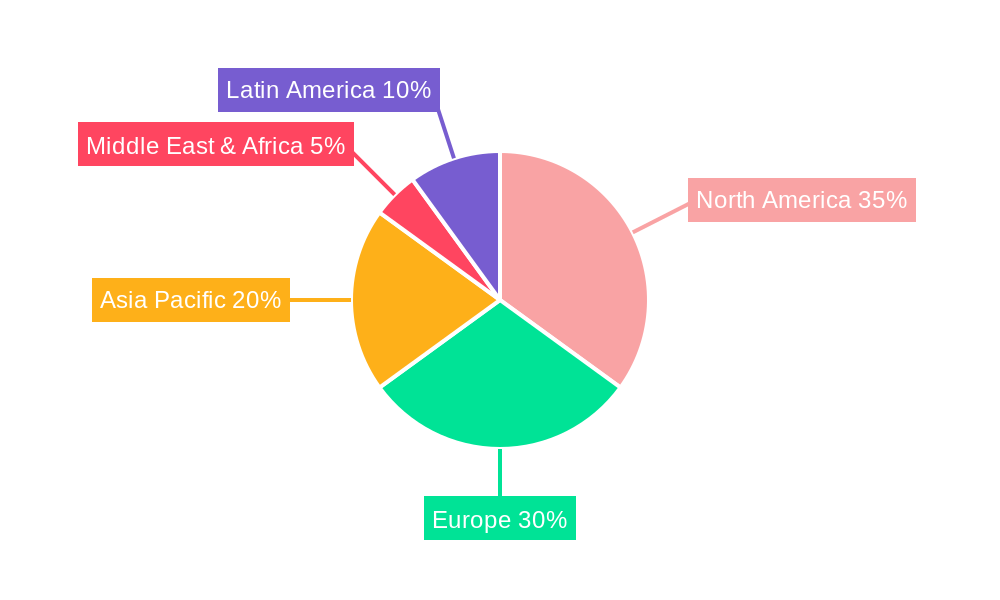
Dominant Regions, Countries, or Segments in Wine Packaging Industry
The North American and European regions currently dominate the wine packaging market, driven by established wine production and consumption. However, significant growth opportunities exist in the Asia-Pacific region due to rising disposable incomes and changing consumer preferences.
Leading Segments:
- Material Type: Glass remains the dominant material, followed by plastic and paperboard. Growth in the paperboard segment is driven by the rising demand for sustainable packaging solutions.
- Product Type: Glass bottles hold the largest market share, while the bag-in-box segment shows significant growth potential due to cost-effectiveness and convenience.
Key Drivers:
- Strong wine production and consumption: High demand drives packaging requirement.
- Growing E-commerce sales: Demands sturdy packaging for shipping.
- Shifting Consumer Preferences: Sustainability concerns are increasing demand for eco-friendly solutions.
Wine Packaging Industry Product Landscape
The wine packaging market offers a diverse range of products, including glass bottles, plastic bottles, bag-in-box packaging, and other innovative formats. Recent product innovations focus on sustainability, lightweighting, and improved barrier properties to enhance shelf life and reduce environmental impact. Key features include lighter weight glass bottles, improved closures that prevent leakage and oxidation, and bio-based plastics for environmentally conscious consumers.
Key Drivers, Barriers & Challenges in Wine Packaging Industry
Key Drivers:
- Rising wine consumption globally.
- Growing demand for premium wine packaging.
- Increasing preference for sustainable and eco-friendly packaging.
- Technological advancements in packaging materials and designs.
Key Challenges:
- Fluctuating raw material prices.
- Stringent environmental regulations and compliance costs.
- Intense competition among existing players.
- Supply chain disruptions impacting packaging availability and lead times.
Emerging Opportunities in Wine Packaging Industry
Emerging opportunities include the growth of e-commerce wine sales, increased demand for sustainable packaging materials, and the development of innovative packaging solutions designed to enhance the consumer experience. Expansion into untapped markets in emerging economies and the creation of unique and premium packaging options are key areas for growth.
Growth Accelerators in the Wine Packaging Industry Industry
Long-term growth in the wine packaging industry will be driven by collaborative partnerships between packaging suppliers and wine producers to develop innovative solutions, focusing on sustainable materials and enhanced product protection. Technological breakthroughs in barrier technology and lightweighting will also contribute to market expansion. Strategic acquisitions and expansion into new markets will further accelerate growth.
Key Players Shaping the Wine Packaging Industry Market
- Encore Glass
- Ardagh Group
- Tetra Laval International
- Liqui-Box Corporation (Dow Chemical Company)
- Saverglass SAS
- Scholle Corporation
- TricorBraun Incorporate
- Ball Corporation
- G3 Enterprises
- Maverick Enterprises
- Guala Closures
- Owens-Illinois Group
- International Paper
Notable Milestones in Wine Packaging Industry Sector
- December 2022: Orora Glass wins WIIA Packaging & Design award for its lightweight sparkling wine bottle.
- November 2022: Smurfit Kappa launches a sustainable eCommerce wine packaging solution.
In-Depth Wine Packaging Industry Market Outlook
The future of the wine packaging market is bright, with continued growth driven by technological innovation, sustainability initiatives, and the evolving demands of consumers. Strategic partnerships and investments in research and development will play a crucial role in shaping the market landscape. The focus on sustainable and eco-friendly solutions will remain a key driver, with opportunities for companies that can provide innovative and cost-effective solutions.
Wine Packaging Industry Segmentation
-
1. Material Type
- 1.1. Glass
- 1.2. Plastic
- 1.3. Metal
- 1.4. Paper Board
-
2. Product Type
- 2.1. Glass Bottles
- 2.2. Plastic Bottles
- 2.3. Bag in Box
- 2.4. Other Product Types
Wine Packaging Industry Segmentation By Geography
-
1. North America
- 1.1. United States
- 1.2. Canada
-
2. Europe
- 2.1. United Kingdom
- 2.2. Germany
- 2.3. Italy
- 2.4. France
- 2.5. Spain
- 2.6. Rest of Europe
-
3. Asia Pacific
- 3.1. China
- 3.2. Japan
- 3.3. Australia and New Zealand
- 3.4. Rest of Asia Pacific
- 4. Latin America
- 5. Middle East and Africa
Wine Packaging Industry REPORT HIGHLIGHTS
| Aspects | Details |
|---|---|
| Study Period | 2019-2033 |
| Base Year | 2024 |
| Estimated Year | 2025 |
| Forecast Period | 2025-2033 |
| Historical Period | 2019-2024 |
| Growth Rate | CAGR of 5.48% from 2019-2033 |
| Segmentation |
|
Table of Contents
- 1. Introduction
- 1.1. Research Scope
- 1.2. Market Segmentation
- 1.3. Research Methodology
- 1.4. Definitions and Assumptions
- 2. Executive Summary
- 2.1. Introduction
- 3. Market Dynamics
- 3.1. Introduction
- 3.2. Market Drivers
- 3.2.1. Innovative Packaging and Attractive Marketing
- 3.3. Market Restrains
- 3.3.1. Stringent Government Regulations over Single-Use Plastic-based Packaging
- 3.4. Market Trends
- 3.4.1. Growing Consumption of Premium Wines
- 4. Market Factor Analysis
- 4.1. Porters Five Forces
- 4.2. Supply/Value Chain
- 4.3. PESTEL analysis
- 4.4. Market Entropy
- 4.5. Patent/Trademark Analysis
- 5. Global Wine Packaging Industry Analysis, Insights and Forecast, 2019-2031
- 5.1. Market Analysis, Insights and Forecast - by Material Type
- 5.1.1. Glass
- 5.1.2. Plastic
- 5.1.3. Metal
- 5.1.4. Paper Board
- 5.2. Market Analysis, Insights and Forecast - by Product Type
- 5.2.1. Glass Bottles
- 5.2.2. Plastic Bottles
- 5.2.3. Bag in Box
- 5.2.4. Other Product Types
- 5.3. Market Analysis, Insights and Forecast - by Region
- 5.3.1. North America
- 5.3.2. Europe
- 5.3.3. Asia Pacific
- 5.3.4. Latin America
- 5.3.5. Middle East and Africa
- 5.1. Market Analysis, Insights and Forecast - by Material Type
- 6. North America Wine Packaging Industry Analysis, Insights and Forecast, 2019-2031
- 6.1. Market Analysis, Insights and Forecast - by Material Type
- 6.1.1. Glass
- 6.1.2. Plastic
- 6.1.3. Metal
- 6.1.4. Paper Board
- 6.2. Market Analysis, Insights and Forecast - by Product Type
- 6.2.1. Glass Bottles
- 6.2.2. Plastic Bottles
- 6.2.3. Bag in Box
- 6.2.4. Other Product Types
- 6.1. Market Analysis, Insights and Forecast - by Material Type
- 7. Europe Wine Packaging Industry Analysis, Insights and Forecast, 2019-2031
- 7.1. Market Analysis, Insights and Forecast - by Material Type
- 7.1.1. Glass
- 7.1.2. Plastic
- 7.1.3. Metal
- 7.1.4. Paper Board
- 7.2. Market Analysis, Insights and Forecast - by Product Type
- 7.2.1. Glass Bottles
- 7.2.2. Plastic Bottles
- 7.2.3. Bag in Box
- 7.2.4. Other Product Types
- 7.1. Market Analysis, Insights and Forecast - by Material Type
- 8. Asia Pacific Wine Packaging Industry Analysis, Insights and Forecast, 2019-2031
- 8.1. Market Analysis, Insights and Forecast - by Material Type
- 8.1.1. Glass
- 8.1.2. Plastic
- 8.1.3. Metal
- 8.1.4. Paper Board
- 8.2. Market Analysis, Insights and Forecast - by Product Type
- 8.2.1. Glass Bottles
- 8.2.2. Plastic Bottles
- 8.2.3. Bag in Box
- 8.2.4. Other Product Types
- 8.1. Market Analysis, Insights and Forecast - by Material Type
- 9. Latin America Wine Packaging Industry Analysis, Insights and Forecast, 2019-2031
- 9.1. Market Analysis, Insights and Forecast - by Material Type
- 9.1.1. Glass
- 9.1.2. Plastic
- 9.1.3. Metal
- 9.1.4. Paper Board
- 9.2. Market Analysis, Insights and Forecast - by Product Type
- 9.2.1. Glass Bottles
- 9.2.2. Plastic Bottles
- 9.2.3. Bag in Box
- 9.2.4. Other Product Types
- 9.1. Market Analysis, Insights and Forecast - by Material Type
- 10. Middle East and Africa Wine Packaging Industry Analysis, Insights and Forecast, 2019-2031
- 10.1. Market Analysis, Insights and Forecast - by Material Type
- 10.1.1. Glass
- 10.1.2. Plastic
- 10.1.3. Metal
- 10.1.4. Paper Board
- 10.2. Market Analysis, Insights and Forecast - by Product Type
- 10.2.1. Glass Bottles
- 10.2.2. Plastic Bottles
- 10.2.3. Bag in Box
- 10.2.4. Other Product Types
- 10.1. Market Analysis, Insights and Forecast - by Material Type
- 11. North America Wine Packaging Industry Analysis, Insights and Forecast, 2019-2031
- 11.1. Market Analysis, Insights and Forecast - By Country/Sub-region
- 11.1.1 United States
- 11.1.2 Canada
- 11.1.3 Mexico
- 12. Middle East & Africa Wine Packaging Industry Analysis, Insights and Forecast, 2019-2031
- 12.1. Market Analysis, Insights and Forecast - By Country/Sub-region
- 12.1.1 UAE
- 12.1.2 South Africa
- 12.1.3 Saudi Arabia
- 12.1.4 Rest of Middle East Africa
- 13. Asia Pacific Wine Packaging Industry Analysis, Insights and Forecast, 2019-2031
- 13.1. Market Analysis, Insights and Forecast - By Country/Sub-region
- 13.1.1 China
- 13.1.2 Japan
- 13.1.3 India
- 13.1.4 South Korea
- 13.1.5 Taiwan
- 13.1.6 South East Asia
- 13.1.7 Australia
- 13.1.8 Rest of Asia-Pacific
- 14. Europe Wine Packaging Industry Analysis, Insights and Forecast, 2019-2031
- 14.1. Market Analysis, Insights and Forecast - By Country/Sub-region
- 14.1.1 Germany
- 14.1.2 France
- 14.1.3 Italy
- 14.1.4 United Kingdom
- 14.1.5 Spain
- 14.1.6 Nordics
- 14.1.7 Benelux
- 14.1.8 Rest of Europe
- 15. Latin America Wine Packaging Industry Analysis, Insights and Forecast, 2019-2031
- 15.1. Market Analysis, Insights and Forecast - By Country/Sub-region
- 15.1.1 Brazil
- 15.1.2 Argentina
- 15.1.3 Rest of South America
- 16. Competitive Analysis
- 16.1. Global Market Share Analysis 2024
- 16.2. Company Profiles
- 16.2.1 Encore Glass
- 16.2.1.1. Overview
- 16.2.1.2. Products
- 16.2.1.3. SWOT Analysis
- 16.2.1.4. Recent Developments
- 16.2.1.5. Financials (Based on Availability)
- 16.2.2 Ardagh Group
- 16.2.2.1. Overview
- 16.2.2.2. Products
- 16.2.2.3. SWOT Analysis
- 16.2.2.4. Recent Developments
- 16.2.2.5. Financials (Based on Availability)
- 16.2.3 Tetra Laval International
- 16.2.3.1. Overview
- 16.2.3.2. Products
- 16.2.3.3. SWOT Analysis
- 16.2.3.4. Recent Developments
- 16.2.3.5. Financials (Based on Availability)
- 16.2.4 Liqui-Box Corporation ( Dow Chemical Company)
- 16.2.4.1. Overview
- 16.2.4.2. Products
- 16.2.4.3. SWOT Analysis
- 16.2.4.4. Recent Developments
- 16.2.4.5. Financials (Based on Availability)
- 16.2.5 Saverglass SAS
- 16.2.5.1. Overview
- 16.2.5.2. Products
- 16.2.5.3. SWOT Analysis
- 16.2.5.4. Recent Developments
- 16.2.5.5. Financials (Based on Availability)
- 16.2.6 Scholle Corporation
- 16.2.6.1. Overview
- 16.2.6.2. Products
- 16.2.6.3. SWOT Analysis
- 16.2.6.4. Recent Developments
- 16.2.6.5. Financials (Based on Availability)
- 16.2.7 TricorBraun Incorporate
- 16.2.7.1. Overview
- 16.2.7.2. Products
- 16.2.7.3. SWOT Analysis
- 16.2.7.4. Recent Developments
- 16.2.7.5. Financials (Based on Availability)
- 16.2.8 Ball Corporation
- 16.2.8.1. Overview
- 16.2.8.2. Products
- 16.2.8.3. SWOT Analysis
- 16.2.8.4. Recent Developments
- 16.2.8.5. Financials (Based on Availability)
- 16.2.9 G3 Enterprises
- 16.2.9.1. Overview
- 16.2.9.2. Products
- 16.2.9.3. SWOT Analysis
- 16.2.9.4. Recent Developments
- 16.2.9.5. Financials (Based on Availability)
- 16.2.10 Maverick Enterprises
- 16.2.10.1. Overview
- 16.2.10.2. Products
- 16.2.10.3. SWOT Analysis
- 16.2.10.4. Recent Developments
- 16.2.10.5. Financials (Based on Availability)
- 16.2.11 Guala Closures
- 16.2.11.1. Overview
- 16.2.11.2. Products
- 16.2.11.3. SWOT Analysis
- 16.2.11.4. Recent Developments
- 16.2.11.5. Financials (Based on Availability)
- 16.2.12 Owens-Illinois Group
- 16.2.12.1. Overview
- 16.2.12.2. Products
- 16.2.12.3. SWOT Analysis
- 16.2.12.4. Recent Developments
- 16.2.12.5. Financials (Based on Availability)
- 16.2.13 International Paper
- 16.2.13.1. Overview
- 16.2.13.2. Products
- 16.2.13.3. SWOT Analysis
- 16.2.13.4. Recent Developments
- 16.2.13.5. Financials (Based on Availability)
- 16.2.1 Encore Glass
List of Figures
- Figure 1: Global Wine Packaging Industry Revenue Breakdown (USD Billion, %) by Region 2024 & 2032
- Figure 2: Global Wine Packaging Industry Volume Breakdown (K Tons, %) by Region 2024 & 2032
- Figure 3: North America Wine Packaging Industry Revenue (USD Billion), by Country 2024 & 2032
- Figure 4: North America Wine Packaging Industry Volume (K Tons), by Country 2024 & 2032
- Figure 5: North America Wine Packaging Industry Revenue Share (%), by Country 2024 & 2032
- Figure 6: North America Wine Packaging Industry Volume Share (%), by Country 2024 & 2032
- Figure 7: Middle East & Africa Wine Packaging Industry Revenue (USD Billion), by Country 2024 & 2032
- Figure 8: Middle East & Africa Wine Packaging Industry Volume (K Tons), by Country 2024 & 2032
- Figure 9: Middle East & Africa Wine Packaging Industry Revenue Share (%), by Country 2024 & 2032
- Figure 10: Middle East & Africa Wine Packaging Industry Volume Share (%), by Country 2024 & 2032
- Figure 11: Asia Pacific Wine Packaging Industry Revenue (USD Billion), by Country 2024 & 2032
- Figure 12: Asia Pacific Wine Packaging Industry Volume (K Tons), by Country 2024 & 2032
- Figure 13: Asia Pacific Wine Packaging Industry Revenue Share (%), by Country 2024 & 2032
- Figure 14: Asia Pacific Wine Packaging Industry Volume Share (%), by Country 2024 & 2032
- Figure 15: Europe Wine Packaging Industry Revenue (USD Billion), by Country 2024 & 2032
- Figure 16: Europe Wine Packaging Industry Volume (K Tons), by Country 2024 & 2032
- Figure 17: Europe Wine Packaging Industry Revenue Share (%), by Country 2024 & 2032
- Figure 18: Europe Wine Packaging Industry Volume Share (%), by Country 2024 & 2032
- Figure 19: Latin America Wine Packaging Industry Revenue (USD Billion), by Country 2024 & 2032
- Figure 20: Latin America Wine Packaging Industry Volume (K Tons), by Country 2024 & 2032
- Figure 21: Latin America Wine Packaging Industry Revenue Share (%), by Country 2024 & 2032
- Figure 22: Latin America Wine Packaging Industry Volume Share (%), by Country 2024 & 2032
- Figure 23: North America Wine Packaging Industry Revenue (USD Billion), by Material Type 2024 & 2032
- Figure 24: North America Wine Packaging Industry Volume (K Tons), by Material Type 2024 & 2032
- Figure 25: North America Wine Packaging Industry Revenue Share (%), by Material Type 2024 & 2032
- Figure 26: North America Wine Packaging Industry Volume Share (%), by Material Type 2024 & 2032
- Figure 27: North America Wine Packaging Industry Revenue (USD Billion), by Product Type 2024 & 2032
- Figure 28: North America Wine Packaging Industry Volume (K Tons), by Product Type 2024 & 2032
- Figure 29: North America Wine Packaging Industry Revenue Share (%), by Product Type 2024 & 2032
- Figure 30: North America Wine Packaging Industry Volume Share (%), by Product Type 2024 & 2032
- Figure 31: North America Wine Packaging Industry Revenue (USD Billion), by Country 2024 & 2032
- Figure 32: North America Wine Packaging Industry Volume (K Tons), by Country 2024 & 2032
- Figure 33: North America Wine Packaging Industry Revenue Share (%), by Country 2024 & 2032
- Figure 34: North America Wine Packaging Industry Volume Share (%), by Country 2024 & 2032
- Figure 35: Europe Wine Packaging Industry Revenue (USD Billion), by Material Type 2024 & 2032
- Figure 36: Europe Wine Packaging Industry Volume (K Tons), by Material Type 2024 & 2032
- Figure 37: Europe Wine Packaging Industry Revenue Share (%), by Material Type 2024 & 2032
- Figure 38: Europe Wine Packaging Industry Volume Share (%), by Material Type 2024 & 2032
- Figure 39: Europe Wine Packaging Industry Revenue (USD Billion), by Product Type 2024 & 2032
- Figure 40: Europe Wine Packaging Industry Volume (K Tons), by Product Type 2024 & 2032
- Figure 41: Europe Wine Packaging Industry Revenue Share (%), by Product Type 2024 & 2032
- Figure 42: Europe Wine Packaging Industry Volume Share (%), by Product Type 2024 & 2032
- Figure 43: Europe Wine Packaging Industry Revenue (USD Billion), by Country 2024 & 2032
- Figure 44: Europe Wine Packaging Industry Volume (K Tons), by Country 2024 & 2032
- Figure 45: Europe Wine Packaging Industry Revenue Share (%), by Country 2024 & 2032
- Figure 46: Europe Wine Packaging Industry Volume Share (%), by Country 2024 & 2032
- Figure 47: Asia Pacific Wine Packaging Industry Revenue (USD Billion), by Material Type 2024 & 2032
- Figure 48: Asia Pacific Wine Packaging Industry Volume (K Tons), by Material Type 2024 & 2032
- Figure 49: Asia Pacific Wine Packaging Industry Revenue Share (%), by Material Type 2024 & 2032
- Figure 50: Asia Pacific Wine Packaging Industry Volume Share (%), by Material Type 2024 & 2032
- Figure 51: Asia Pacific Wine Packaging Industry Revenue (USD Billion), by Product Type 2024 & 2032
- Figure 52: Asia Pacific Wine Packaging Industry Volume (K Tons), by Product Type 2024 & 2032
- Figure 53: Asia Pacific Wine Packaging Industry Revenue Share (%), by Product Type 2024 & 2032
- Figure 54: Asia Pacific Wine Packaging Industry Volume Share (%), by Product Type 2024 & 2032
- Figure 55: Asia Pacific Wine Packaging Industry Revenue (USD Billion), by Country 2024 & 2032
- Figure 56: Asia Pacific Wine Packaging Industry Volume (K Tons), by Country 2024 & 2032
- Figure 57: Asia Pacific Wine Packaging Industry Revenue Share (%), by Country 2024 & 2032
- Figure 58: Asia Pacific Wine Packaging Industry Volume Share (%), by Country 2024 & 2032
- Figure 59: Latin America Wine Packaging Industry Revenue (USD Billion), by Material Type 2024 & 2032
- Figure 60: Latin America Wine Packaging Industry Volume (K Tons), by Material Type 2024 & 2032
- Figure 61: Latin America Wine Packaging Industry Revenue Share (%), by Material Type 2024 & 2032
- Figure 62: Latin America Wine Packaging Industry Volume Share (%), by Material Type 2024 & 2032
- Figure 63: Latin America Wine Packaging Industry Revenue (USD Billion), by Product Type 2024 & 2032
- Figure 64: Latin America Wine Packaging Industry Volume (K Tons), by Product Type 2024 & 2032
- Figure 65: Latin America Wine Packaging Industry Revenue Share (%), by Product Type 2024 & 2032
- Figure 66: Latin America Wine Packaging Industry Volume Share (%), by Product Type 2024 & 2032
- Figure 67: Latin America Wine Packaging Industry Revenue (USD Billion), by Country 2024 & 2032
- Figure 68: Latin America Wine Packaging Industry Volume (K Tons), by Country 2024 & 2032
- Figure 69: Latin America Wine Packaging Industry Revenue Share (%), by Country 2024 & 2032
- Figure 70: Latin America Wine Packaging Industry Volume Share (%), by Country 2024 & 2032
- Figure 71: Middle East and Africa Wine Packaging Industry Revenue (USD Billion), by Material Type 2024 & 2032
- Figure 72: Middle East and Africa Wine Packaging Industry Volume (K Tons), by Material Type 2024 & 2032
- Figure 73: Middle East and Africa Wine Packaging Industry Revenue Share (%), by Material Type 2024 & 2032
- Figure 74: Middle East and Africa Wine Packaging Industry Volume Share (%), by Material Type 2024 & 2032
- Figure 75: Middle East and Africa Wine Packaging Industry Revenue (USD Billion), by Product Type 2024 & 2032
- Figure 76: Middle East and Africa Wine Packaging Industry Volume (K Tons), by Product Type 2024 & 2032
- Figure 77: Middle East and Africa Wine Packaging Industry Revenue Share (%), by Product Type 2024 & 2032
- Figure 78: Middle East and Africa Wine Packaging Industry Volume Share (%), by Product Type 2024 & 2032
- Figure 79: Middle East and Africa Wine Packaging Industry Revenue (USD Billion), by Country 2024 & 2032
- Figure 80: Middle East and Africa Wine Packaging Industry Volume (K Tons), by Country 2024 & 2032
- Figure 81: Middle East and Africa Wine Packaging Industry Revenue Share (%), by Country 2024 & 2032
- Figure 82: Middle East and Africa Wine Packaging Industry Volume Share (%), by Country 2024 & 2032
List of Tables
- Table 1: Global Wine Packaging Industry Revenue USD Billion Forecast, by Region 2019 & 2032
- Table 2: Global Wine Packaging Industry Volume K Tons Forecast, by Region 2019 & 2032
- Table 3: Global Wine Packaging Industry Revenue USD Billion Forecast, by Material Type 2019 & 2032
- Table 4: Global Wine Packaging Industry Volume K Tons Forecast, by Material Type 2019 & 2032
- Table 5: Global Wine Packaging Industry Revenue USD Billion Forecast, by Product Type 2019 & 2032
- Table 6: Global Wine Packaging Industry Volume K Tons Forecast, by Product Type 2019 & 2032
- Table 7: Global Wine Packaging Industry Revenue USD Billion Forecast, by Region 2019 & 2032
- Table 8: Global Wine Packaging Industry Volume K Tons Forecast, by Region 2019 & 2032
- Table 9: Global Wine Packaging Industry Revenue USD Billion Forecast, by Country 2019 & 2032
- Table 10: Global Wine Packaging Industry Volume K Tons Forecast, by Country 2019 & 2032
- Table 11: United States Wine Packaging Industry Revenue (USD Billion) Forecast, by Application 2019 & 2032
- Table 12: United States Wine Packaging Industry Volume (K Tons) Forecast, by Application 2019 & 2032
- Table 13: Canada Wine Packaging Industry Revenue (USD Billion) Forecast, by Application 2019 & 2032
- Table 14: Canada Wine Packaging Industry Volume (K Tons) Forecast, by Application 2019 & 2032
- Table 15: Mexico Wine Packaging Industry Revenue (USD Billion) Forecast, by Application 2019 & 2032
- Table 16: Mexico Wine Packaging Industry Volume (K Tons) Forecast, by Application 2019 & 2032
- Table 17: Global Wine Packaging Industry Revenue USD Billion Forecast, by Country 2019 & 2032
- Table 18: Global Wine Packaging Industry Volume K Tons Forecast, by Country 2019 & 2032
- Table 19: UAE Wine Packaging Industry Revenue (USD Billion) Forecast, by Application 2019 & 2032
- Table 20: UAE Wine Packaging Industry Volume (K Tons) Forecast, by Application 2019 & 2032
- Table 21: South Africa Wine Packaging Industry Revenue (USD Billion) Forecast, by Application 2019 & 2032
- Table 22: South Africa Wine Packaging Industry Volume (K Tons) Forecast, by Application 2019 & 2032
- Table 23: Saudi Arabia Wine Packaging Industry Revenue (USD Billion) Forecast, by Application 2019 & 2032
- Table 24: Saudi Arabia Wine Packaging Industry Volume (K Tons) Forecast, by Application 2019 & 2032
- Table 25: Rest of Middle East Africa Wine Packaging Industry Revenue (USD Billion) Forecast, by Application 2019 & 2032
- Table 26: Rest of Middle East Africa Wine Packaging Industry Volume (K Tons) Forecast, by Application 2019 & 2032
- Table 27: Global Wine Packaging Industry Revenue USD Billion Forecast, by Country 2019 & 2032
- Table 28: Global Wine Packaging Industry Volume K Tons Forecast, by Country 2019 & 2032
- Table 29: China Wine Packaging Industry Revenue (USD Billion) Forecast, by Application 2019 & 2032
- Table 30: China Wine Packaging Industry Volume (K Tons) Forecast, by Application 2019 & 2032
- Table 31: Japan Wine Packaging Industry Revenue (USD Billion) Forecast, by Application 2019 & 2032
- Table 32: Japan Wine Packaging Industry Volume (K Tons) Forecast, by Application 2019 & 2032
- Table 33: India Wine Packaging Industry Revenue (USD Billion) Forecast, by Application 2019 & 2032
- Table 34: India Wine Packaging Industry Volume (K Tons) Forecast, by Application 2019 & 2032
- Table 35: South Korea Wine Packaging Industry Revenue (USD Billion) Forecast, by Application 2019 & 2032
- Table 36: South Korea Wine Packaging Industry Volume (K Tons) Forecast, by Application 2019 & 2032
- Table 37: Taiwan Wine Packaging Industry Revenue (USD Billion) Forecast, by Application 2019 & 2032
- Table 38: Taiwan Wine Packaging Industry Volume (K Tons) Forecast, by Application 2019 & 2032
- Table 39: South East Asia Wine Packaging Industry Revenue (USD Billion) Forecast, by Application 2019 & 2032
- Table 40: South East Asia Wine Packaging Industry Volume (K Tons) Forecast, by Application 2019 & 2032
- Table 41: Australia Wine Packaging Industry Revenue (USD Billion) Forecast, by Application 2019 & 2032
- Table 42: Australia Wine Packaging Industry Volume (K Tons) Forecast, by Application 2019 & 2032
- Table 43: Rest of Asia-Pacific Wine Packaging Industry Revenue (USD Billion) Forecast, by Application 2019 & 2032
- Table 44: Rest of Asia-Pacific Wine Packaging Industry Volume (K Tons) Forecast, by Application 2019 & 2032
- Table 45: Global Wine Packaging Industry Revenue USD Billion Forecast, by Country 2019 & 2032
- Table 46: Global Wine Packaging Industry Volume K Tons Forecast, by Country 2019 & 2032
- Table 47: Germany Wine Packaging Industry Revenue (USD Billion) Forecast, by Application 2019 & 2032
- Table 48: Germany Wine Packaging Industry Volume (K Tons) Forecast, by Application 2019 & 2032
- Table 49: France Wine Packaging Industry Revenue (USD Billion) Forecast, by Application 2019 & 2032
- Table 50: France Wine Packaging Industry Volume (K Tons) Forecast, by Application 2019 & 2032
- Table 51: Italy Wine Packaging Industry Revenue (USD Billion) Forecast, by Application 2019 & 2032
- Table 52: Italy Wine Packaging Industry Volume (K Tons) Forecast, by Application 2019 & 2032
- Table 53: United Kingdom Wine Packaging Industry Revenue (USD Billion) Forecast, by Application 2019 & 2032
- Table 54: United Kingdom Wine Packaging Industry Volume (K Tons) Forecast, by Application 2019 & 2032
- Table 55: Spain Wine Packaging Industry Revenue (USD Billion) Forecast, by Application 2019 & 2032
- Table 56: Spain Wine Packaging Industry Volume (K Tons) Forecast, by Application 2019 & 2032
- Table 57: Nordics Wine Packaging Industry Revenue (USD Billion) Forecast, by Application 2019 & 2032
- Table 58: Nordics Wine Packaging Industry Volume (K Tons) Forecast, by Application 2019 & 2032
- Table 59: Benelux Wine Packaging Industry Revenue (USD Billion) Forecast, by Application 2019 & 2032
- Table 60: Benelux Wine Packaging Industry Volume (K Tons) Forecast, by Application 2019 & 2032
- Table 61: Rest of Europe Wine Packaging Industry Revenue (USD Billion) Forecast, by Application 2019 & 2032
- Table 62: Rest of Europe Wine Packaging Industry Volume (K Tons) Forecast, by Application 2019 & 2032
- Table 63: Global Wine Packaging Industry Revenue USD Billion Forecast, by Country 2019 & 2032
- Table 64: Global Wine Packaging Industry Volume K Tons Forecast, by Country 2019 & 2032
- Table 65: Brazil Wine Packaging Industry Revenue (USD Billion) Forecast, by Application 2019 & 2032
- Table 66: Brazil Wine Packaging Industry Volume (K Tons) Forecast, by Application 2019 & 2032
- Table 67: Argentina Wine Packaging Industry Revenue (USD Billion) Forecast, by Application 2019 & 2032
- Table 68: Argentina Wine Packaging Industry Volume (K Tons) Forecast, by Application 2019 & 2032
- Table 69: Rest of South America Wine Packaging Industry Revenue (USD Billion) Forecast, by Application 2019 & 2032
- Table 70: Rest of South America Wine Packaging Industry Volume (K Tons) Forecast, by Application 2019 & 2032
- Table 71: Global Wine Packaging Industry Revenue USD Billion Forecast, by Material Type 2019 & 2032
- Table 72: Global Wine Packaging Industry Volume K Tons Forecast, by Material Type 2019 & 2032
- Table 73: Global Wine Packaging Industry Revenue USD Billion Forecast, by Product Type 2019 & 2032
- Table 74: Global Wine Packaging Industry Volume K Tons Forecast, by Product Type 2019 & 2032
- Table 75: Global Wine Packaging Industry Revenue USD Billion Forecast, by Country 2019 & 2032
- Table 76: Global Wine Packaging Industry Volume K Tons Forecast, by Country 2019 & 2032
- Table 77: United States Wine Packaging Industry Revenue (USD Billion) Forecast, by Application 2019 & 2032
- Table 78: United States Wine Packaging Industry Volume (K Tons) Forecast, by Application 2019 & 2032
- Table 79: Canada Wine Packaging Industry Revenue (USD Billion) Forecast, by Application 2019 & 2032
- Table 80: Canada Wine Packaging Industry Volume (K Tons) Forecast, by Application 2019 & 2032
- Table 81: Global Wine Packaging Industry Revenue USD Billion Forecast, by Material Type 2019 & 2032
- Table 82: Global Wine Packaging Industry Volume K Tons Forecast, by Material Type 2019 & 2032
- Table 83: Global Wine Packaging Industry Revenue USD Billion Forecast, by Product Type 2019 & 2032
- Table 84: Global Wine Packaging Industry Volume K Tons Forecast, by Product Type 2019 & 2032
- Table 85: Global Wine Packaging Industry Revenue USD Billion Forecast, by Country 2019 & 2032
- Table 86: Global Wine Packaging Industry Volume K Tons Forecast, by Country 2019 & 2032
- Table 87: United Kingdom Wine Packaging Industry Revenue (USD Billion) Forecast, by Application 2019 & 2032
- Table 88: United Kingdom Wine Packaging Industry Volume (K Tons) Forecast, by Application 2019 & 2032
- Table 89: Germany Wine Packaging Industry Revenue (USD Billion) Forecast, by Application 2019 & 2032
- Table 90: Germany Wine Packaging Industry Volume (K Tons) Forecast, by Application 2019 & 2032
- Table 91: Italy Wine Packaging Industry Revenue (USD Billion) Forecast, by Application 2019 & 2032
- Table 92: Italy Wine Packaging Industry Volume (K Tons) Forecast, by Application 2019 & 2032
- Table 93: France Wine Packaging Industry Revenue (USD Billion) Forecast, by Application 2019 & 2032
- Table 94: France Wine Packaging Industry Volume (K Tons) Forecast, by Application 2019 & 2032
- Table 95: Spain Wine Packaging Industry Revenue (USD Billion) Forecast, by Application 2019 & 2032
- Table 96: Spain Wine Packaging Industry Volume (K Tons) Forecast, by Application 2019 & 2032
- Table 97: Rest of Europe Wine Packaging Industry Revenue (USD Billion) Forecast, by Application 2019 & 2032
- Table 98: Rest of Europe Wine Packaging Industry Volume (K Tons) Forecast, by Application 2019 & 2032
- Table 99: Global Wine Packaging Industry Revenue USD Billion Forecast, by Material Type 2019 & 2032
- Table 100: Global Wine Packaging Industry Volume K Tons Forecast, by Material Type 2019 & 2032
- Table 101: Global Wine Packaging Industry Revenue USD Billion Forecast, by Product Type 2019 & 2032
- Table 102: Global Wine Packaging Industry Volume K Tons Forecast, by Product Type 2019 & 2032
- Table 103: Global Wine Packaging Industry Revenue USD Billion Forecast, by Country 2019 & 2032
- Table 104: Global Wine Packaging Industry Volume K Tons Forecast, by Country 2019 & 2032
- Table 105: China Wine Packaging Industry Revenue (USD Billion) Forecast, by Application 2019 & 2032
- Table 106: China Wine Packaging Industry Volume (K Tons) Forecast, by Application 2019 & 2032
- Table 107: Japan Wine Packaging Industry Revenue (USD Billion) Forecast, by Application 2019 & 2032
- Table 108: Japan Wine Packaging Industry Volume (K Tons) Forecast, by Application 2019 & 2032
- Table 109: Australia and New Zealand Wine Packaging Industry Revenue (USD Billion) Forecast, by Application 2019 & 2032
- Table 110: Australia and New Zealand Wine Packaging Industry Volume (K Tons) Forecast, by Application 2019 & 2032
- Table 111: Rest of Asia Pacific Wine Packaging Industry Revenue (USD Billion) Forecast, by Application 2019 & 2032
- Table 112: Rest of Asia Pacific Wine Packaging Industry Volume (K Tons) Forecast, by Application 2019 & 2032
- Table 113: Global Wine Packaging Industry Revenue USD Billion Forecast, by Material Type 2019 & 2032
- Table 114: Global Wine Packaging Industry Volume K Tons Forecast, by Material Type 2019 & 2032
- Table 115: Global Wine Packaging Industry Revenue USD Billion Forecast, by Product Type 2019 & 2032
- Table 116: Global Wine Packaging Industry Volume K Tons Forecast, by Product Type 2019 & 2032
- Table 117: Global Wine Packaging Industry Revenue USD Billion Forecast, by Country 2019 & 2032
- Table 118: Global Wine Packaging Industry Volume K Tons Forecast, by Country 2019 & 2032
- Table 119: Global Wine Packaging Industry Revenue USD Billion Forecast, by Material Type 2019 & 2032
- Table 120: Global Wine Packaging Industry Volume K Tons Forecast, by Material Type 2019 & 2032
- Table 121: Global Wine Packaging Industry Revenue USD Billion Forecast, by Product Type 2019 & 2032
- Table 122: Global Wine Packaging Industry Volume K Tons Forecast, by Product Type 2019 & 2032
- Table 123: Global Wine Packaging Industry Revenue USD Billion Forecast, by Country 2019 & 2032
- Table 124: Global Wine Packaging Industry Volume K Tons Forecast, by Country 2019 & 2032
Frequently Asked Questions
1. What is the projected Compound Annual Growth Rate (CAGR) of the Wine Packaging Industry?
The projected CAGR is approximately 5.48%.
2. Which companies are prominent players in the Wine Packaging Industry?
Key companies in the market include Encore Glass, Ardagh Group, Tetra Laval International, Liqui-Box Corporation ( Dow Chemical Company), Saverglass SAS, Scholle Corporation, TricorBraun Incorporate, Ball Corporation, G3 Enterprises, Maverick Enterprises, Guala Closures, Owens-Illinois Group, International Paper.
3. What are the main segments of the Wine Packaging Industry?
The market segments include Material Type, Product Type.
4. Can you provide details about the market size?
The market size is estimated to be USD 5.69 USD Billion as of 2022.
5. What are some drivers contributing to market growth?
Innovative Packaging and Attractive Marketing.
6. What are the notable trends driving market growth?
Growing Consumption of Premium Wines.
7. Are there any restraints impacting market growth?
Stringent Government Regulations over Single-Use Plastic-based Packaging.
8. Can you provide examples of recent developments in the market?
December 2022: In the Wine Industry Impacts Awards (WIIA) announced in December 2022, presented by the Wine Industry Suppliers Association (WISA), Orora Glass took out the top prize in the Packaging & Design category for its lightweight sparkling wine bottle. It was described as a fantastic and sustainable packaging alternative for sparkling beverages, 100 grams lighter than the brand's standard sparkling bottle yet having the same diameter, height, and GV rating.
9. What pricing options are available for accessing the report?
Pricing options include single-user, multi-user, and enterprise licenses priced at USD 4750, USD 5250, and USD 8750 respectively.
10. Is the market size provided in terms of value or volume?
The market size is provided in terms of value, measured in USD Billion and volume, measured in K Tons.
11. Are there any specific market keywords associated with the report?
Yes, the market keyword associated with the report is "Wine Packaging Industry," which aids in identifying and referencing the specific market segment covered.
12. How do I determine which pricing option suits my needs best?
The pricing options vary based on user requirements and access needs. Individual users may opt for single-user licenses, while businesses requiring broader access may choose multi-user or enterprise licenses for cost-effective access to the report.
13. Are there any additional resources or data provided in the Wine Packaging Industry report?
While the report offers comprehensive insights, it's advisable to review the specific contents or supplementary materials provided to ascertain if additional resources or data are available.
14. How can I stay updated on further developments or reports in the Wine Packaging Industry?
To stay informed about further developments, trends, and reports in the Wine Packaging Industry, consider subscribing to industry newsletters, following relevant companies and organizations, or regularly checking reputable industry news sources and publications.
Methodology
Step 1 - Identification of Relevant Samples Size from Population Database


Step 2 - Approaches for Defining Global Market Size (Value, Volume* & Price*)

Note*: In applicable scenarios
Step 3 - Data Sources
Primary Research
- Web Analytics
- Survey Reports
- Research Institute
- Latest Research Reports
- Opinion Leaders
Secondary Research
- Annual Reports
- White Paper
- Latest Press Release
- Industry Association
- Paid Database
- Investor Presentations

Step 4 - Data Triangulation
Involves using different sources of information in order to increase the validity of a study
These sources are likely to be stakeholders in a program - participants, other researchers, program staff, other community members, and so on.
Then we put all data in single framework & apply various statistical tools to find out the dynamic on the market.
During the analysis stage, feedback from the stakeholder groups would be compared to determine areas of agreement as well as areas of divergence
