

Key Insights
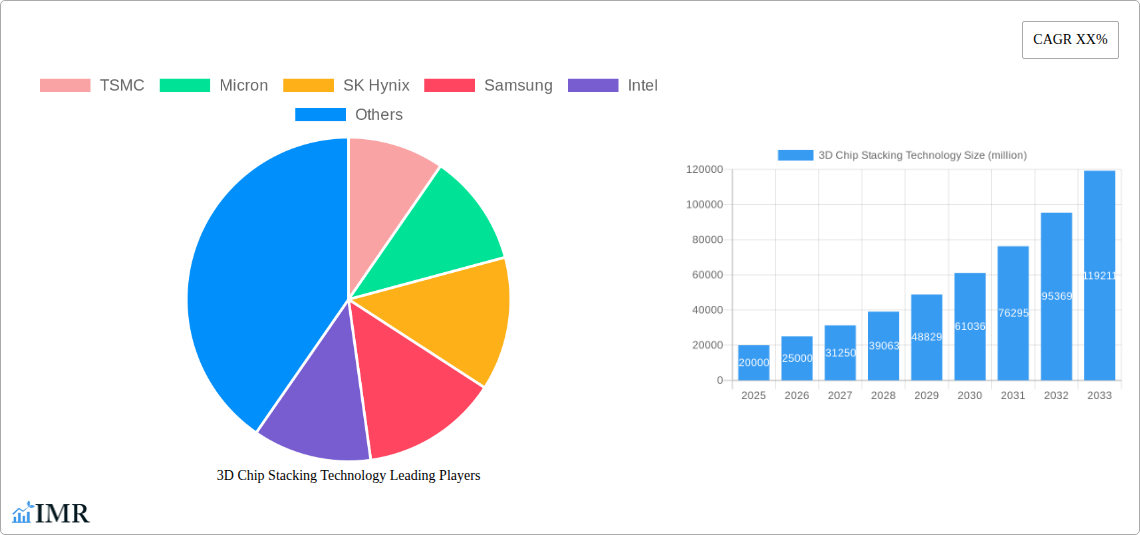
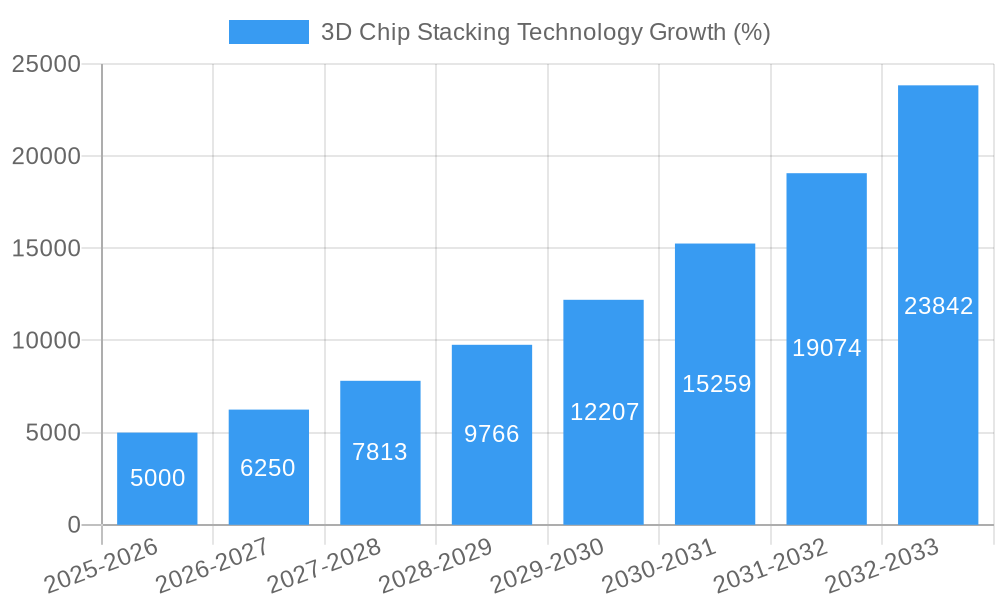
The 3D chip stacking market is experiencing robust growth, driven by the increasing demand for higher performance, smaller form factor, and lower power consumption in electronic devices. The market, estimated at $20 billion in 2025, is projected to achieve a Compound Annual Growth Rate (CAGR) of 25% from 2025 to 2033, reaching approximately $100 billion by 2033. This expansion is fueled by several key factors. Firstly, the miniaturization trend in electronics necessitates innovative packaging solutions, with 3D stacking offering a pathway to increased functionality within reduced space. Secondly, advancements in semiconductor manufacturing technologies are enabling the development of more complex and efficient 3D stacked chips. Thirdly, the surging demand for high-performance computing (HPC), artificial intelligence (AI), and 5G/6G communication technologies significantly boosts the market for these advanced chips. Major players like TSMC, Samsung, Intel, Micron, SK Hynix, ASE Technology, and Amkor Technology are heavily investing in research and development, fueling the market's expansion.
However, challenges remain. High manufacturing costs associated with the intricate processes involved in 3D chip stacking present a restraint. Furthermore, thermal management becomes increasingly critical as more chips are stacked, requiring innovative cooling solutions. Despite these hurdles, the long-term outlook for 3D chip stacking remains highly positive, particularly considering the continuous advancements in materials science and packaging technologies that are addressing these limitations. The market segmentation is primarily based on technology type (through-silicon vias (TSVs), etc.), application (high-performance computing, mobile devices, automotive, etc.), and geography, each demonstrating unique growth trajectories influenced by regional technological adoption rates and market demand.
3D Chip Stacking Technology Market Report: 2019-2033
This comprehensive report provides a detailed analysis of the 3D Chip Stacking Technology market, encompassing market dynamics, growth trends, regional dominance, product landscape, key players, and future outlook. The study period covers 2019-2033, with a base year of 2025 and a forecast period of 2025-2033. This report is invaluable for industry professionals, investors, and anyone seeking a deep understanding of this rapidly evolving sector. The parent market is the Semiconductor Industry, while the child market is Advanced Packaging Technologies.
3D Chip Stacking Technology Market Dynamics & Structure
This section analyzes the market's competitive landscape, technological advancements, regulatory environment, and market forces influencing its evolution. The global 3D chip stacking market size in 2025 is estimated at $XX billion.
- Market Concentration: The market is moderately concentrated, with key players like TSMC, Samsung, Intel, and Micron holding significant market share. TSMC and Samsung are estimated to collectively hold approximately 60% of the market share in 2025. Smaller players like ASE Technology and Amkor Technology focus on outsourced assembly and testing services.
- Technological Innovation: Continuous advancements in Through-Silicon Vias (TSV), wafer-level packaging (WLP), and 3D IC integration are key drivers of market growth. Innovation in materials science and manufacturing processes are crucial for reducing costs and enhancing performance.
- Regulatory Framework: Government regulations concerning data security, environmental standards, and intellectual property rights influence market operations. Recent regulatory shifts in specific regions may impact the growth trajectory.
- Competitive Product Substitutes: While no direct substitutes exist, 2.5D packaging and advanced 2D interconnects pose some competitive pressure. The advantages of 3D stacking in terms of performance and power efficiency often outweigh these alternatives.
- End-User Demographics: The primary end-users include the consumer electronics, automotive, high-performance computing (HPC), and data center sectors. The demand from HPC and data centers is significantly driving market growth.
- M&A Trends: The industry has witnessed a moderate level of M&A activity in recent years, with major players strategically acquiring smaller companies to bolster their technological capabilities and expand market reach. An estimated xx M&A deals were concluded in the historical period (2019-2024).
3D Chip Stacking Technology Growth Trends & Insights
The 3D chip stacking technology market is experiencing substantial growth, driven by the increasing demand for higher performance, lower power consumption, and smaller form factor electronic devices. This section provides a comprehensive analysis of market size evolution, adoption rates, technological disruptions, and consumer behavior shifts, leveraging market research data and expert insights.
The market witnessed a CAGR of xx% during the historical period (2019-2024), and is projected to grow at a CAGR of xx% during the forecast period (2025-2033). Market penetration in the consumer electronics segment is approximately xx% in 2025, expected to reach xx% by 2033. Technological disruptions, such as advancements in TSV technology and heterogeneous integration, are expected to further accelerate market growth. The increasing adoption of AI and 5G technologies is creating a strong demand for high-performance computing, fueling the adoption of 3D chip stacking. Consumer preferences are shifting towards smaller, more powerful devices, making 3D chip stacking a crucial technology.
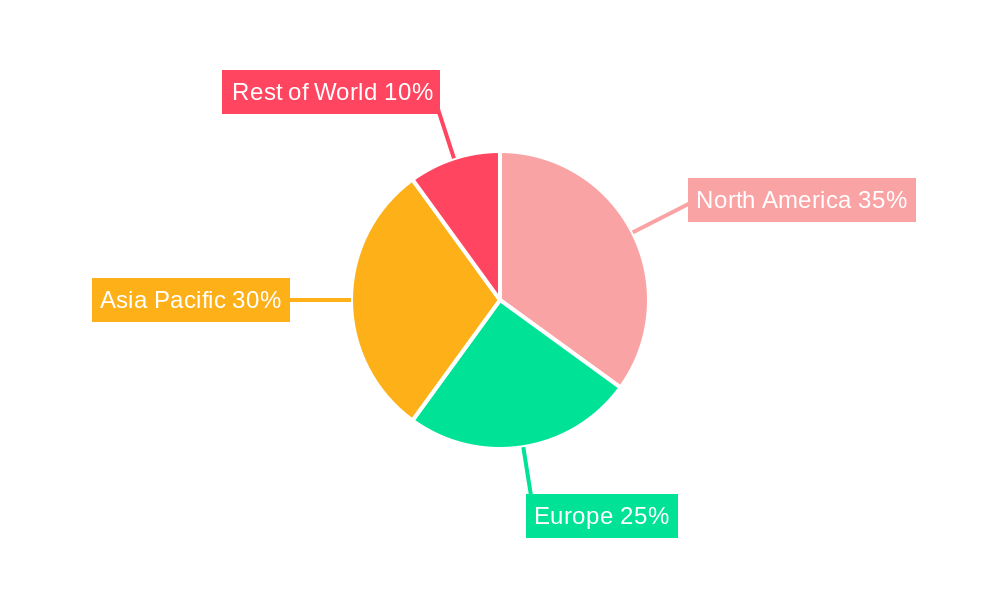
Dominant Regions, Countries, or Segments in 3D Chip Stacking Technology
This section identifies leading regions and segments driving market growth. Asia (especially Taiwan, South Korea, and China) dominates the market, accounting for approximately 75% of the global market share in 2025.
- Key Drivers in Asia:
- Strong government support for semiconductor industries.
- Well-established manufacturing infrastructure and supply chains.
- High concentration of leading semiconductor companies.
- North America: While holding a smaller market share compared to Asia, North America demonstrates robust growth, driven by a strong demand from the HPC and data center sectors.
- Europe: The European market is characterized by a relatively slower growth rate compared to Asia and North America, primarily due to lower investment in semiconductor manufacturing.
The HPC segment is projected to be the fastest-growing segment, with an anticipated CAGR of xx% from 2025 to 2033, driven by increasing demand for high-performance computing capabilities in data centers and artificial intelligence applications.
3D Chip Stacking Technology Product Landscape
3D chip stacking technology encompasses various approaches, including Through-Silicon Vias (TSV), wafer-level packaging (WLP), and system-in-package (SiP). Each method offers unique advantages in terms of performance, cost-effectiveness, and scalability, leading to a diverse product landscape that caters to different application requirements. Ongoing innovations focus on increasing the density of interconnects, improving thermal management, and enhancing signal integrity. These advancements drive the adoption of 3D chip stacking across diverse sectors.
Key Drivers, Barriers & Challenges in 3D Chip Stacking Technology
Key Drivers:
- Increasing demand for higher performance and power efficiency in electronic devices. This is particularly driven by the growth of mobile devices, high-performance computing, and artificial intelligence.
- Advancements in TSV and packaging technologies: These innovations make 3D chip stacking more cost-effective and feasible.
- Government support and investments in semiconductor research and development.
Key Challenges:
- High manufacturing costs: The complexity of 3D chip stacking makes manufacturing expensive, impacting market penetration.
- Technical complexities: Challenges related to thermal management, signal integrity, and yield remain hurdles to wider adoption.
- Supply chain disruptions: Global supply chain disruptions can impact the availability of materials and manufacturing capacity, especially with the increasing demand.
Emerging Opportunities in 3D Chip Stacking Technology
Emerging opportunities include applications in:
- Automotive electronics: 3D chip stacking allows for smaller, more powerful electronics in vehicles, leading to advancements in autonomous driving and advanced driver-assistance systems.
- Healthcare devices: Miniaturized, high-performance medical implants and diagnostic tools are becoming increasingly viable due to 3D stacking.
- 5G and beyond: The demand for higher bandwidth and lower latency in 5G and future wireless technologies necessitates 3D chip stacking for improved performance and power efficiency.
Growth Accelerators in the 3D Chip Stacking Technology Industry
Technological breakthroughs in materials science, packaging technologies, and advanced manufacturing processes are significantly accelerating market growth. Strategic partnerships between semiconductor manufacturers and packaging companies are streamlining the supply chain and driving innovation. Market expansion into new applications such as automotive electronics, IoT devices, and high-bandwidth communication systems is further propelling market expansion.
Key Players Shaping the 3D Chip Stacking Technology Market
Notable Milestones in 3D Chip Stacking Technology Sector
- 2020: Samsung successfully mass-produced 7nm-based EUV 3D NAND flash memory chips.
- 2021: TSMC launched its advanced 3D packaging technology, enhancing performance and density.
- 2022: Intel announced significant advancements in its Foveros 3D packaging technology.
- 2023: Several companies unveiled new 3D chip stacking solutions for automotive applications.
In-Depth 3D Chip Stacking Technology Market Outlook
The 3D chip stacking technology market is poised for significant growth, driven by the increasing demand for high-performance, low-power electronics. Continued advancements in packaging technologies, coupled with expanding applications in diverse sectors, will contribute to a robust market outlook. Strategic partnerships and investments in research and development will further propel market expansion, creating significant opportunities for industry players. The market is expected to reach $xx billion by 2033, demonstrating a strong potential for investors and industry participants alike.
3D Chip Stacking Technology Segmentation
-
1. Application
- 1.1. DRAM
- 1.2. CPUs
- 1.3. GPUs
- 1.4. Others
-
2. Types
- 2.1. Through-Silicon Via (TSV)
- 2.2. Die-to-Die Bonding
- 2.3. Others
3D Chip Stacking Technology Segmentation By Geography
-
1. North America
- 1.1. United States
- 1.2. Canada
- 1.3. Mexico
-
2. South America
- 2.1. Brazil
- 2.2. Argentina
- 2.3. Rest of South America
-
3. Europe
- 3.1. United Kingdom
- 3.2. Germany
- 3.3. France
- 3.4. Italy
- 3.5. Spain
- 3.6. Russia
- 3.7. Benelux
- 3.8. Nordics
- 3.9. Rest of Europe
-
4. Middle East & Africa
- 4.1. Turkey
- 4.2. Israel
- 4.3. GCC
- 4.4. North Africa
- 4.5. South Africa
- 4.6. Rest of Middle East & Africa
-
5. Asia Pacific
- 5.1. China
- 5.2. India
- 5.3. Japan
- 5.4. South Korea
- 5.5. ASEAN
- 5.6. Oceania
- 5.7. Rest of Asia Pacific
3D Chip Stacking Technology REPORT HIGHLIGHTS
| Aspects | Details |
|---|---|
| Study Period | 2019-2033 |
| Base Year | 2024 |
| Estimated Year | 2025 |
| Forecast Period | 2025-2033 |
| Historical Period | 2019-2024 |
| Growth Rate | CAGR of XX% from 2019-2033 |
| Segmentation |
|
Table of Contents
- 1. Introduction
- 1.1. Research Scope
- 1.2. Market Segmentation
- 1.3. Research Methodology
- 1.4. Definitions and Assumptions
- 2. Executive Summary
- 2.1. Introduction
- 3. Market Dynamics
- 3.1. Introduction
- 3.2. Market Drivers
- 3.3. Market Restrains
- 3.4. Market Trends
- 4. Market Factor Analysis
- 4.1. Porters Five Forces
- 4.2. Supply/Value Chain
- 4.3. PESTEL analysis
- 4.4. Market Entropy
- 4.5. Patent/Trademark Analysis
- 5. Global 3D Chip Stacking Technology Analysis, Insights and Forecast, 2019-2031
- 5.1. Market Analysis, Insights and Forecast - by Application
- 5.1.1. DRAM
- 5.1.2. CPUs
- 5.1.3. GPUs
- 5.1.4. Others
- 5.2. Market Analysis, Insights and Forecast - by Types
- 5.2.1. Through-Silicon Via (TSV)
- 5.2.2. Die-to-Die Bonding
- 5.2.3. Others
- 5.3. Market Analysis, Insights and Forecast - by Region
- 5.3.1. North America
- 5.3.2. South America
- 5.3.3. Europe
- 5.3.4. Middle East & Africa
- 5.3.5. Asia Pacific
- 5.1. Market Analysis, Insights and Forecast - by Application
- 6. North America 3D Chip Stacking Technology Analysis, Insights and Forecast, 2019-2031
- 6.1. Market Analysis, Insights and Forecast - by Application
- 6.1.1. DRAM
- 6.1.2. CPUs
- 6.1.3. GPUs
- 6.1.4. Others
- 6.2. Market Analysis, Insights and Forecast - by Types
- 6.2.1. Through-Silicon Via (TSV)
- 6.2.2. Die-to-Die Bonding
- 6.2.3. Others
- 6.1. Market Analysis, Insights and Forecast - by Application
- 7. South America 3D Chip Stacking Technology Analysis, Insights and Forecast, 2019-2031
- 7.1. Market Analysis, Insights and Forecast - by Application
- 7.1.1. DRAM
- 7.1.2. CPUs
- 7.1.3. GPUs
- 7.1.4. Others
- 7.2. Market Analysis, Insights and Forecast - by Types
- 7.2.1. Through-Silicon Via (TSV)
- 7.2.2. Die-to-Die Bonding
- 7.2.3. Others
- 7.1. Market Analysis, Insights and Forecast - by Application
- 8. Europe 3D Chip Stacking Technology Analysis, Insights and Forecast, 2019-2031
- 8.1. Market Analysis, Insights and Forecast - by Application
- 8.1.1. DRAM
- 8.1.2. CPUs
- 8.1.3. GPUs
- 8.1.4. Others
- 8.2. Market Analysis, Insights and Forecast - by Types
- 8.2.1. Through-Silicon Via (TSV)
- 8.2.2. Die-to-Die Bonding
- 8.2.3. Others
- 8.1. Market Analysis, Insights and Forecast - by Application
- 9. Middle East & Africa 3D Chip Stacking Technology Analysis, Insights and Forecast, 2019-2031
- 9.1. Market Analysis, Insights and Forecast - by Application
- 9.1.1. DRAM
- 9.1.2. CPUs
- 9.1.3. GPUs
- 9.1.4. Others
- 9.2. Market Analysis, Insights and Forecast - by Types
- 9.2.1. Through-Silicon Via (TSV)
- 9.2.2. Die-to-Die Bonding
- 9.2.3. Others
- 9.1. Market Analysis, Insights and Forecast - by Application
- 10. Asia Pacific 3D Chip Stacking Technology Analysis, Insights and Forecast, 2019-2031
- 10.1. Market Analysis, Insights and Forecast - by Application
- 10.1.1. DRAM
- 10.1.2. CPUs
- 10.1.3. GPUs
- 10.1.4. Others
- 10.2. Market Analysis, Insights and Forecast - by Types
- 10.2.1. Through-Silicon Via (TSV)
- 10.2.2. Die-to-Die Bonding
- 10.2.3. Others
- 10.1. Market Analysis, Insights and Forecast - by Application
- 11. Competitive Analysis
- 11.1. Global Market Share Analysis 2024
- 11.2. Company Profiles
- 11.2.1 TSMC
- 11.2.1.1. Overview
- 11.2.1.2. Products
- 11.2.1.3. SWOT Analysis
- 11.2.1.4. Recent Developments
- 11.2.1.5. Financials (Based on Availability)
- 11.2.2 Micron
- 11.2.2.1. Overview
- 11.2.2.2. Products
- 11.2.2.3. SWOT Analysis
- 11.2.2.4. Recent Developments
- 11.2.2.5. Financials (Based on Availability)
- 11.2.3 SK Hynix
- 11.2.3.1. Overview
- 11.2.3.2. Products
- 11.2.3.3. SWOT Analysis
- 11.2.3.4. Recent Developments
- 11.2.3.5. Financials (Based on Availability)
- 11.2.4 Samsung
- 11.2.4.1. Overview
- 11.2.4.2. Products
- 11.2.4.3. SWOT Analysis
- 11.2.4.4. Recent Developments
- 11.2.4.5. Financials (Based on Availability)
- 11.2.5 Intel
- 11.2.5.1. Overview
- 11.2.5.2. Products
- 11.2.5.3. SWOT Analysis
- 11.2.5.4. Recent Developments
- 11.2.5.5. Financials (Based on Availability)
- 11.2.6 ASE Technology
- 11.2.6.1. Overview
- 11.2.6.2. Products
- 11.2.6.3. SWOT Analysis
- 11.2.6.4. Recent Developments
- 11.2.6.5. Financials (Based on Availability)
- 11.2.7 Amkor Technology
- 11.2.7.1. Overview
- 11.2.7.2. Products
- 11.2.7.3. SWOT Analysis
- 11.2.7.4. Recent Developments
- 11.2.7.5. Financials (Based on Availability)
- 11.2.1 TSMC
List of Figures
- Figure 1: Global 3D Chip Stacking Technology Revenue Breakdown (million, %) by Region 2024 & 2032
- Figure 2: North America 3D Chip Stacking Technology Revenue (million), by Application 2024 & 2032
- Figure 3: North America 3D Chip Stacking Technology Revenue Share (%), by Application 2024 & 2032
- Figure 4: North America 3D Chip Stacking Technology Revenue (million), by Types 2024 & 2032
- Figure 5: North America 3D Chip Stacking Technology Revenue Share (%), by Types 2024 & 2032
- Figure 6: North America 3D Chip Stacking Technology Revenue (million), by Country 2024 & 2032
- Figure 7: North America 3D Chip Stacking Technology Revenue Share (%), by Country 2024 & 2032
- Figure 8: South America 3D Chip Stacking Technology Revenue (million), by Application 2024 & 2032
- Figure 9: South America 3D Chip Stacking Technology Revenue Share (%), by Application 2024 & 2032
- Figure 10: South America 3D Chip Stacking Technology Revenue (million), by Types 2024 & 2032
- Figure 11: South America 3D Chip Stacking Technology Revenue Share (%), by Types 2024 & 2032
- Figure 12: South America 3D Chip Stacking Technology Revenue (million), by Country 2024 & 2032
- Figure 13: South America 3D Chip Stacking Technology Revenue Share (%), by Country 2024 & 2032
- Figure 14: Europe 3D Chip Stacking Technology Revenue (million), by Application 2024 & 2032
- Figure 15: Europe 3D Chip Stacking Technology Revenue Share (%), by Application 2024 & 2032
- Figure 16: Europe 3D Chip Stacking Technology Revenue (million), by Types 2024 & 2032
- Figure 17: Europe 3D Chip Stacking Technology Revenue Share (%), by Types 2024 & 2032
- Figure 18: Europe 3D Chip Stacking Technology Revenue (million), by Country 2024 & 2032
- Figure 19: Europe 3D Chip Stacking Technology Revenue Share (%), by Country 2024 & 2032
- Figure 20: Middle East & Africa 3D Chip Stacking Technology Revenue (million), by Application 2024 & 2032
- Figure 21: Middle East & Africa 3D Chip Stacking Technology Revenue Share (%), by Application 2024 & 2032
- Figure 22: Middle East & Africa 3D Chip Stacking Technology Revenue (million), by Types 2024 & 2032
- Figure 23: Middle East & Africa 3D Chip Stacking Technology Revenue Share (%), by Types 2024 & 2032
- Figure 24: Middle East & Africa 3D Chip Stacking Technology Revenue (million), by Country 2024 & 2032
- Figure 25: Middle East & Africa 3D Chip Stacking Technology Revenue Share (%), by Country 2024 & 2032
- Figure 26: Asia Pacific 3D Chip Stacking Technology Revenue (million), by Application 2024 & 2032
- Figure 27: Asia Pacific 3D Chip Stacking Technology Revenue Share (%), by Application 2024 & 2032
- Figure 28: Asia Pacific 3D Chip Stacking Technology Revenue (million), by Types 2024 & 2032
- Figure 29: Asia Pacific 3D Chip Stacking Technology Revenue Share (%), by Types 2024 & 2032
- Figure 30: Asia Pacific 3D Chip Stacking Technology Revenue (million), by Country 2024 & 2032
- Figure 31: Asia Pacific 3D Chip Stacking Technology Revenue Share (%), by Country 2024 & 2032
List of Tables
- Table 1: Global 3D Chip Stacking Technology Revenue million Forecast, by Region 2019 & 2032
- Table 2: Global 3D Chip Stacking Technology Revenue million Forecast, by Application 2019 & 2032
- Table 3: Global 3D Chip Stacking Technology Revenue million Forecast, by Types 2019 & 2032
- Table 4: Global 3D Chip Stacking Technology Revenue million Forecast, by Region 2019 & 2032
- Table 5: Global 3D Chip Stacking Technology Revenue million Forecast, by Application 2019 & 2032
- Table 6: Global 3D Chip Stacking Technology Revenue million Forecast, by Types 2019 & 2032
- Table 7: Global 3D Chip Stacking Technology Revenue million Forecast, by Country 2019 & 2032
- Table 8: United States 3D Chip Stacking Technology Revenue (million) Forecast, by Application 2019 & 2032
- Table 9: Canada 3D Chip Stacking Technology Revenue (million) Forecast, by Application 2019 & 2032
- Table 10: Mexico 3D Chip Stacking Technology Revenue (million) Forecast, by Application 2019 & 2032
- Table 11: Global 3D Chip Stacking Technology Revenue million Forecast, by Application 2019 & 2032
- Table 12: Global 3D Chip Stacking Technology Revenue million Forecast, by Types 2019 & 2032
- Table 13: Global 3D Chip Stacking Technology Revenue million Forecast, by Country 2019 & 2032
- Table 14: Brazil 3D Chip Stacking Technology Revenue (million) Forecast, by Application 2019 & 2032
- Table 15: Argentina 3D Chip Stacking Technology Revenue (million) Forecast, by Application 2019 & 2032
- Table 16: Rest of South America 3D Chip Stacking Technology Revenue (million) Forecast, by Application 2019 & 2032
- Table 17: Global 3D Chip Stacking Technology Revenue million Forecast, by Application 2019 & 2032
- Table 18: Global 3D Chip Stacking Technology Revenue million Forecast, by Types 2019 & 2032
- Table 19: Global 3D Chip Stacking Technology Revenue million Forecast, by Country 2019 & 2032
- Table 20: United Kingdom 3D Chip Stacking Technology Revenue (million) Forecast, by Application 2019 & 2032
- Table 21: Germany 3D Chip Stacking Technology Revenue (million) Forecast, by Application 2019 & 2032
- Table 22: France 3D Chip Stacking Technology Revenue (million) Forecast, by Application 2019 & 2032
- Table 23: Italy 3D Chip Stacking Technology Revenue (million) Forecast, by Application 2019 & 2032
- Table 24: Spain 3D Chip Stacking Technology Revenue (million) Forecast, by Application 2019 & 2032
- Table 25: Russia 3D Chip Stacking Technology Revenue (million) Forecast, by Application 2019 & 2032
- Table 26: Benelux 3D Chip Stacking Technology Revenue (million) Forecast, by Application 2019 & 2032
- Table 27: Nordics 3D Chip Stacking Technology Revenue (million) Forecast, by Application 2019 & 2032
- Table 28: Rest of Europe 3D Chip Stacking Technology Revenue (million) Forecast, by Application 2019 & 2032
- Table 29: Global 3D Chip Stacking Technology Revenue million Forecast, by Application 2019 & 2032
- Table 30: Global 3D Chip Stacking Technology Revenue million Forecast, by Types 2019 & 2032
- Table 31: Global 3D Chip Stacking Technology Revenue million Forecast, by Country 2019 & 2032
- Table 32: Turkey 3D Chip Stacking Technology Revenue (million) Forecast, by Application 2019 & 2032
- Table 33: Israel 3D Chip Stacking Technology Revenue (million) Forecast, by Application 2019 & 2032
- Table 34: GCC 3D Chip Stacking Technology Revenue (million) Forecast, by Application 2019 & 2032
- Table 35: North Africa 3D Chip Stacking Technology Revenue (million) Forecast, by Application 2019 & 2032
- Table 36: South Africa 3D Chip Stacking Technology Revenue (million) Forecast, by Application 2019 & 2032
- Table 37: Rest of Middle East & Africa 3D Chip Stacking Technology Revenue (million) Forecast, by Application 2019 & 2032
- Table 38: Global 3D Chip Stacking Technology Revenue million Forecast, by Application 2019 & 2032
- Table 39: Global 3D Chip Stacking Technology Revenue million Forecast, by Types 2019 & 2032
- Table 40: Global 3D Chip Stacking Technology Revenue million Forecast, by Country 2019 & 2032
- Table 41: China 3D Chip Stacking Technology Revenue (million) Forecast, by Application 2019 & 2032
- Table 42: India 3D Chip Stacking Technology Revenue (million) Forecast, by Application 2019 & 2032
- Table 43: Japan 3D Chip Stacking Technology Revenue (million) Forecast, by Application 2019 & 2032
- Table 44: South Korea 3D Chip Stacking Technology Revenue (million) Forecast, by Application 2019 & 2032
- Table 45: ASEAN 3D Chip Stacking Technology Revenue (million) Forecast, by Application 2019 & 2032
- Table 46: Oceania 3D Chip Stacking Technology Revenue (million) Forecast, by Application 2019 & 2032
- Table 47: Rest of Asia Pacific 3D Chip Stacking Technology Revenue (million) Forecast, by Application 2019 & 2032
Frequently Asked Questions
1. What is the projected Compound Annual Growth Rate (CAGR) of the 3D Chip Stacking Technology?
The projected CAGR is approximately XX%.
2. Which companies are prominent players in the 3D Chip Stacking Technology?
Key companies in the market include TSMC, Micron, SK Hynix, Samsung, Intel, ASE Technology, Amkor Technology.
3. What are the main segments of the 3D Chip Stacking Technology?
The market segments include Application, Types.
4. Can you provide details about the market size?
The market size is estimated to be USD XXX million as of 2022.
5. What are some drivers contributing to market growth?
N/A
6. What are the notable trends driving market growth?
N/A
7. Are there any restraints impacting market growth?
N/A
8. Can you provide examples of recent developments in the market?
N/A
9. What pricing options are available for accessing the report?
Pricing options include single-user, multi-user, and enterprise licenses priced at USD 2900.00, USD 4350.00, and USD 5800.00 respectively.
10. Is the market size provided in terms of value or volume?
The market size is provided in terms of value, measured in million.
11. Are there any specific market keywords associated with the report?
Yes, the market keyword associated with the report is "3D Chip Stacking Technology," which aids in identifying and referencing the specific market segment covered.
12. How do I determine which pricing option suits my needs best?
The pricing options vary based on user requirements and access needs. Individual users may opt for single-user licenses, while businesses requiring broader access may choose multi-user or enterprise licenses for cost-effective access to the report.
13. Are there any additional resources or data provided in the 3D Chip Stacking Technology report?
While the report offers comprehensive insights, it's advisable to review the specific contents or supplementary materials provided to ascertain if additional resources or data are available.
14. How can I stay updated on further developments or reports in the 3D Chip Stacking Technology?
To stay informed about further developments, trends, and reports in the 3D Chip Stacking Technology, consider subscribing to industry newsletters, following relevant companies and organizations, or regularly checking reputable industry news sources and publications.
Methodology
Step 1 - Identification of Relevant Samples Size from Population Database


Step 2 - Approaches for Defining Global Market Size (Value, Volume* & Price*)

Note*: In applicable scenarios
Step 3 - Data Sources
Primary Research
- Web Analytics
- Survey Reports
- Research Institute
- Latest Research Reports
- Opinion Leaders
Secondary Research
- Annual Reports
- White Paper
- Latest Press Release
- Industry Association
- Paid Database
- Investor Presentations

Step 4 - Data Triangulation
Involves using different sources of information in order to increase the validity of a study
These sources are likely to be stakeholders in a program - participants, other researchers, program staff, other community members, and so on.
Then we put all data in single framework & apply various statistical tools to find out the dynamic on the market.
During the analysis stage, feedback from the stakeholder groups would be compared to determine areas of agreement as well as areas of divergence
