

Key Insights
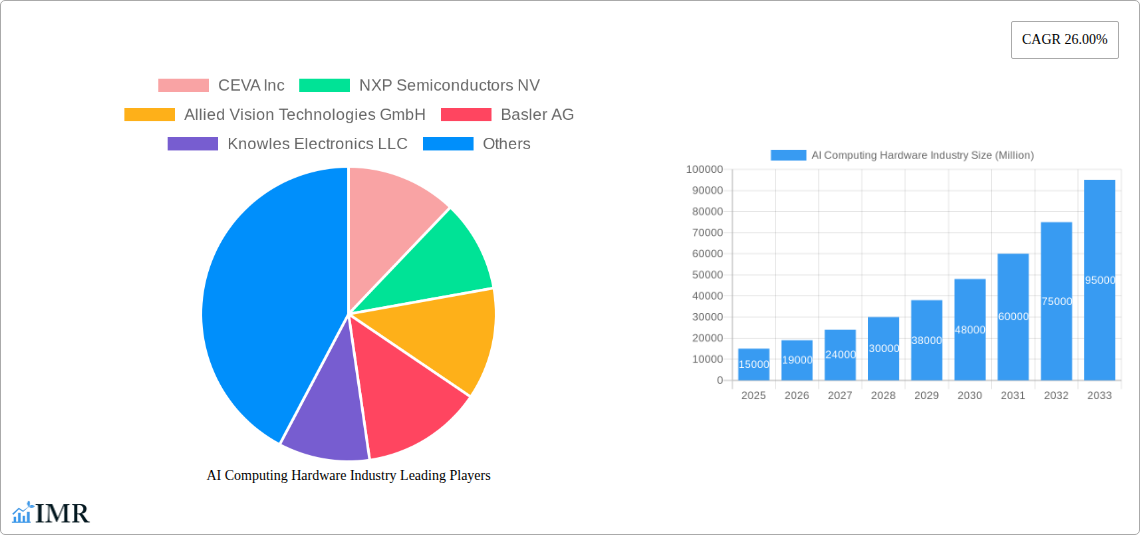
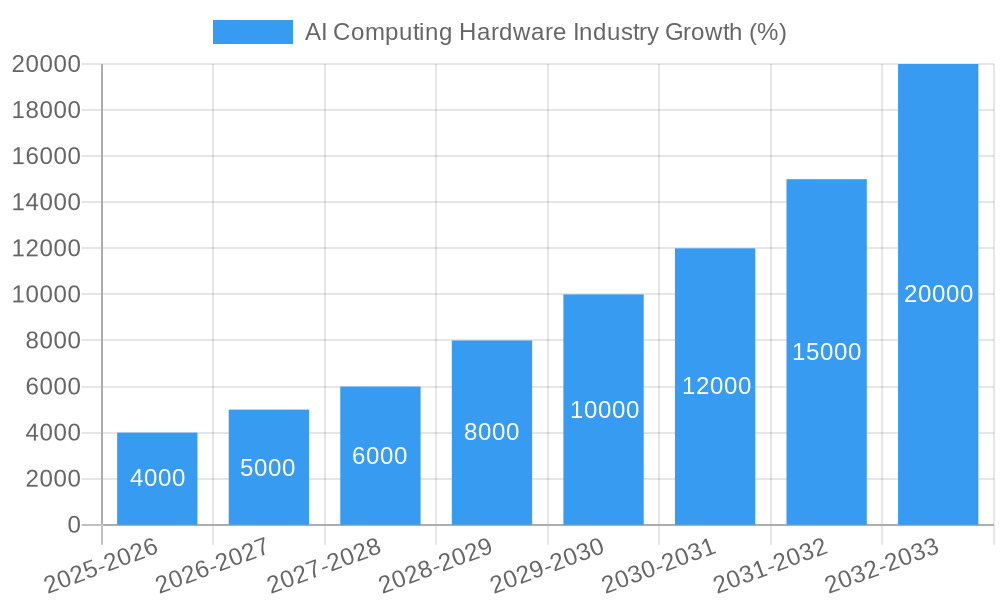
The AI computing hardware market is experiencing explosive growth, projected to reach a substantial size driven by the increasing adoption of artificial intelligence across diverse sectors. A compound annual growth rate (CAGR) of 26% from 2025 to 2033 signifies a significant expansion, fueled by several key factors. The burgeoning demand for advanced processing capabilities in applications such as autonomous vehicles, medical imaging, and sophisticated financial modeling is a primary driver. Furthermore, technological advancements in processor architecture, memory technologies, and specialized hardware accelerators are continuously improving performance and efficiency, making AI solutions more accessible and cost-effective. The market segmentation reveals strong growth across various processor types, with stand-alone and embedded vision and sound processors leading the charge. End-user sectors like automotive, healthcare, and BFSI are demonstrating particularly robust adoption rates, further contributing to market expansion. While challenges such as high initial investment costs and the need for specialized expertise may act as restraints, the overall market trajectory remains strongly positive.
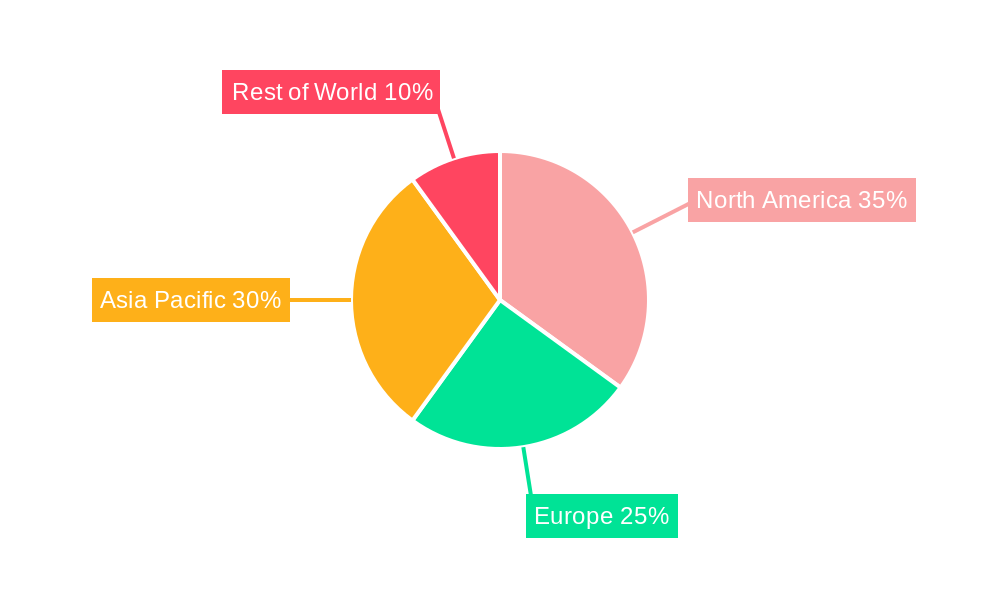
This robust growth is geographically dispersed, with North America and Asia-Pacific expected to be leading markets due to strong technological innovation and significant investments in AI infrastructure. Europe is also anticipated to experience healthy growth, driven by a rapidly expanding digital economy. However, variations in regulatory environments and technological adoption rates across different regions may lead to variations in market penetration. The competitive landscape is marked by a diverse mix of established semiconductor companies, specialized AI hardware vendors, and software providers, leading to increased innovation and competition. This competition will likely drive down costs and accelerate the development of more efficient and powerful AI computing hardware, ultimately benefiting end-users and further propelling market growth in the coming years.
AI Computing Hardware Industry Market Report: 2019-2033
This comprehensive report provides an in-depth analysis of the AI Computing Hardware market, encompassing its dynamics, growth trends, dominant segments, and key players. The study period covers 2019-2033, with a base year of 2025 and a forecast period of 2025-2033. The report leverages extensive primary and secondary research to deliver actionable insights for industry professionals, investors, and strategists. This report is invaluable for understanding the evolution of this rapidly expanding market, covering both parent markets (AI hardware) and child markets (vision and sound processing).
AI Computing Hardware Industry Market Dynamics & Structure
The AI computing hardware market is characterized by a moderately concentrated structure, with key players vying for market share through technological innovation and strategic acquisitions. The market size in 2025 is estimated at xx Million units, expected to reach xx Million units by 2033. Technological advancements, particularly in AI algorithms and chip design, are primary growth drivers. Stringent regulatory frameworks surrounding data privacy and security influence market development. Competitive substitutes, such as traditional computing hardware, exert pressure, albeit limited given AI's unique capabilities. M&A activity has been moderate, with an estimated xx deals in the historical period (2019-2024), consolidating market share and enhancing technological capabilities.
- Market Concentration: Moderately concentrated, with top 5 players holding approximately xx% market share in 2025.
- Technological Innovation Drivers: Advancements in deep learning algorithms, neuromorphic computing, and specialized AI accelerators.
- Regulatory Frameworks: Data privacy regulations (GDPR, CCPA) and security standards influence product development and adoption.
- Competitive Substitutes: Traditional computing hardware, although facing increasing displacement by AI-optimized solutions.
- End-User Demographics: Strong growth driven by increasing adoption across diverse sectors (detailed in subsequent sections).
- M&A Trends: xx M&A deals (2019-2024), indicating consolidation and technological integration strategies.
AI Computing Hardware Industry Growth Trends & Insights
The AI computing hardware market has experienced significant growth, driven by increasing adoption across various sectors. The historical period (2019-2024) saw a CAGR of xx%, with a projected CAGR of xx% during the forecast period (2025-2033). This growth is fueled by rising data volumes, the proliferation of AI applications, and the need for high-performance computing solutions. The market penetration rate is currently at xx%, expected to reach xx% by 2033. Technological disruptions, including the emergence of new architectures like neuromorphic chips, further accelerate growth. Consumer behavior shifts towards data-driven decision-making and personalized experiences also contribute to the expanding market. Market size is projected to reach xx Million units by 2033.
Dominant Regions, Countries, or Segments in AI Computing Hardware Industry
North America currently dominates the AI computing hardware market, driven by robust technological innovation and substantial investments in AI research and development. However, Asia-Pacific is projected to witness the fastest growth rate due to rapid technological advancements and increasing adoption across various sectors. Within the product segments, the Embedded Vision Processor market is experiencing significant growth, owing to its applications in various industries, including automotive and healthcare. The Automotive sector is the largest end-user segment, showcasing the potential for autonomous vehicles and advanced driver-assistance systems (ADAS).
- Leading Region: North America (xx% market share in 2025).
- Fastest-Growing Region: Asia-Pacific.
- Dominant Product Segment: Embedded Vision Processors (xx% market share in 2025).
- Largest End-User Segment: Automotive (xx% market share in 2025).
- Key Drivers: Government initiatives supporting AI development, increased investments in R&D, burgeoning demand for AI applications.
AI Computing Hardware Industry Product Landscape
The AI computing hardware market showcases a diverse range of products, including standalone and embedded vision and sound processors. Recent innovations focus on enhancing processing speed, power efficiency, and integration capabilities. Products are tailored to specific application needs, incorporating features like high-dynamic-range (HDR) imaging, advanced noise cancellation, and deep learning acceleration. Unique selling propositions include improved energy efficiency, miniaturization, and enhanced integration with other AI components. Technological advancements continue to push the boundaries of performance, paving the way for more sophisticated AI-powered devices and systems.
Key Drivers, Barriers & Challenges in AI Computing Hardware Industry
Key Drivers:
- Technological advancements in chip design and AI algorithms.
- Increased adoption of AI across diverse industries.
- Government support and funding for AI research.
Challenges and Restraints:
- High development costs and complexity.
- Supply chain disruptions and component shortages (estimated xx% impact on production in 2024).
- Regulatory hurdles regarding data privacy and security.
Emerging Opportunities in AI Computing Hardware Industry
- Expansion into untapped markets, such as smart homes and wearables.
- Development of specialized AI chips for niche applications.
- Growing demand for edge AI computing.
Growth Accelerators in the AI Computing Hardware Industry
Strategic partnerships between chip manufacturers and AI software developers are accelerating market growth. Technological breakthroughs, such as the development of more energy-efficient AI chips and advanced memory technologies, are further fueling expansion. Market expansion strategies, such as targeting new industries and geographic regions, also play a significant role.
Key Players Shaping the AI Computing Hardware Industry Market
- CEVA Inc
- NXP Semiconductors NV
- Allied Vision Technologies GmbH
- Basler AG
- Knowles Electronics LLC
- Synopsys Inc
- GreenWaves Technologies
- Arm Limited
- Cadence Design Systems Inc
- Andrea Electronics Corporation
Notable Milestones in AI Computing Hardware Industry Sector
- 2021 (Q4): CEVA Inc. announced a new generation of AI processors.
- 2022 (Q2): NXP Semiconductors NV acquired a smaller AI chip company.
- 2023 (Q1): Arm Limited released a new AI development platform.
- (Further milestones to be added based on data)
In-Depth AI Computing Hardware Industry Market Outlook
The AI computing hardware market is poised for continued strong growth, driven by technological innovation, increased adoption across various sectors, and strategic partnerships. Future market potential is significant, particularly in the areas of edge AI, specialized AI chips, and integration with other technologies like 5G. Companies that successfully innovate, adapt, and strategically position themselves within this rapidly evolving landscape are best positioned to capitalize on this expansive market opportunity.
AI Computing Hardware Industry Segmentation
-
1. Type
- 1.1. Stand-alone Vision Processor
- 1.2. Embedded Vision Processor
- 1.3. Stand-alone Sound Processor
- 1.4. Embedded Sound Processor
-
2. End User
- 2.1. BFSI
- 2.2. Automotive
- 2.3. Healthcare
- 2.4. IT and Telecom
- 2.5. Aerospace and Defense
- 2.6. Energy and Utilities
- 2.7. Government and Public Services
- 2.8. Other End Users
AI Computing Hardware Industry Segmentation By Geography
-
1. North America
- 1.1. United States
- 1.2. Canada
-
2. Europe
- 2.1. Germany
- 2.2. United Kingdom
- 2.3. France
- 2.4. Rest of Europe
-
3. Asia Pacific
- 3.1. China
- 3.2. Japan
- 3.3. South Korea
- 3.4. Rest of Asia Pacific
-
4. Rest of the World
- 4.1. Latin America
- 4.2. Middle East and Africa
AI Computing Hardware Industry REPORT HIGHLIGHTS
| Aspects | Details |
|---|---|
| Study Period | 2019-2033 |
| Base Year | 2024 |
| Estimated Year | 2025 |
| Forecast Period | 2025-2033 |
| Historical Period | 2019-2024 |
| Growth Rate | CAGR of 26.00% from 2019-2033 |
| Segmentation |
|
Table of Contents
- 1. Introduction
- 1.1. Research Scope
- 1.2. Market Segmentation
- 1.3. Research Methodology
- 1.4. Definitions and Assumptions
- 2. Executive Summary
- 2.1. Introduction
- 3. Market Dynamics
- 3.1. Introduction
- 3.2. Market Drivers
- 3.2.1. ; Demand for AI Computing Hardware in the Defense sector; Adoption of Field-programmable Gate Arrays (FPGA) for High Computing Speed
- 3.3. Market Restrains
- 3.3.1. ; Limited Number of AI Experts and High Power Consumption
- 3.4. Market Trends
- 3.4.1. Automotive Sector to Witness Significant Growth
- 4. Market Factor Analysis
- 4.1. Porters Five Forces
- 4.2. Supply/Value Chain
- 4.3. PESTEL analysis
- 4.4. Market Entropy
- 4.5. Patent/Trademark Analysis
- 5. Global AI Computing Hardware Industry Analysis, Insights and Forecast, 2019-2031
- 5.1. Market Analysis, Insights and Forecast - by Type
- 5.1.1. Stand-alone Vision Processor
- 5.1.2. Embedded Vision Processor
- 5.1.3. Stand-alone Sound Processor
- 5.1.4. Embedded Sound Processor
- 5.2. Market Analysis, Insights and Forecast - by End User
- 5.2.1. BFSI
- 5.2.2. Automotive
- 5.2.3. Healthcare
- 5.2.4. IT and Telecom
- 5.2.5. Aerospace and Defense
- 5.2.6. Energy and Utilities
- 5.2.7. Government and Public Services
- 5.2.8. Other End Users
- 5.3. Market Analysis, Insights and Forecast - by Region
- 5.3.1. North America
- 5.3.2. Europe
- 5.3.3. Asia Pacific
- 5.3.4. Rest of the World
- 5.1. Market Analysis, Insights and Forecast - by Type
- 6. North America AI Computing Hardware Industry Analysis, Insights and Forecast, 2019-2031
- 6.1. Market Analysis, Insights and Forecast - by Type
- 6.1.1. Stand-alone Vision Processor
- 6.1.2. Embedded Vision Processor
- 6.1.3. Stand-alone Sound Processor
- 6.1.4. Embedded Sound Processor
- 6.2. Market Analysis, Insights and Forecast - by End User
- 6.2.1. BFSI
- 6.2.2. Automotive
- 6.2.3. Healthcare
- 6.2.4. IT and Telecom
- 6.2.5. Aerospace and Defense
- 6.2.6. Energy and Utilities
- 6.2.7. Government and Public Services
- 6.2.8. Other End Users
- 6.1. Market Analysis, Insights and Forecast - by Type
- 7. Europe AI Computing Hardware Industry Analysis, Insights and Forecast, 2019-2031
- 7.1. Market Analysis, Insights and Forecast - by Type
- 7.1.1. Stand-alone Vision Processor
- 7.1.2. Embedded Vision Processor
- 7.1.3. Stand-alone Sound Processor
- 7.1.4. Embedded Sound Processor
- 7.2. Market Analysis, Insights and Forecast - by End User
- 7.2.1. BFSI
- 7.2.2. Automotive
- 7.2.3. Healthcare
- 7.2.4. IT and Telecom
- 7.2.5. Aerospace and Defense
- 7.2.6. Energy and Utilities
- 7.2.7. Government and Public Services
- 7.2.8. Other End Users
- 7.1. Market Analysis, Insights and Forecast - by Type
- 8. Asia Pacific AI Computing Hardware Industry Analysis, Insights and Forecast, 2019-2031
- 8.1. Market Analysis, Insights and Forecast - by Type
- 8.1.1. Stand-alone Vision Processor
- 8.1.2. Embedded Vision Processor
- 8.1.3. Stand-alone Sound Processor
- 8.1.4. Embedded Sound Processor
- 8.2. Market Analysis, Insights and Forecast - by End User
- 8.2.1. BFSI
- 8.2.2. Automotive
- 8.2.3. Healthcare
- 8.2.4. IT and Telecom
- 8.2.5. Aerospace and Defense
- 8.2.6. Energy and Utilities
- 8.2.7. Government and Public Services
- 8.2.8. Other End Users
- 8.1. Market Analysis, Insights and Forecast - by Type
- 9. Rest of the World AI Computing Hardware Industry Analysis, Insights and Forecast, 2019-2031
- 9.1. Market Analysis, Insights and Forecast - by Type
- 9.1.1. Stand-alone Vision Processor
- 9.1.2. Embedded Vision Processor
- 9.1.3. Stand-alone Sound Processor
- 9.1.4. Embedded Sound Processor
- 9.2. Market Analysis, Insights and Forecast - by End User
- 9.2.1. BFSI
- 9.2.2. Automotive
- 9.2.3. Healthcare
- 9.2.4. IT and Telecom
- 9.2.5. Aerospace and Defense
- 9.2.6. Energy and Utilities
- 9.2.7. Government and Public Services
- 9.2.8. Other End Users
- 9.1. Market Analysis, Insights and Forecast - by Type
- 10. North America AI Computing Hardware Industry Analysis, Insights and Forecast, 2019-2031
- 10.1. Market Analysis, Insights and Forecast - By Country/Sub-region
- 10.1.1 United States
- 10.1.2 Canada
- 10.1.3 Mexico
- 11. Europe AI Computing Hardware Industry Analysis, Insights and Forecast, 2019-2031
- 11.1. Market Analysis, Insights and Forecast - By Country/Sub-region
- 11.1.1 Germany
- 11.1.2 United Kingdom
- 11.1.3 France
- 11.1.4 Spain
- 11.1.5 Italy
- 11.1.6 Spain
- 11.1.7 Belgium
- 11.1.8 Netherland
- 11.1.9 Nordics
- 11.1.10 Rest of Europe
- 12. Asia Pacific AI Computing Hardware Industry Analysis, Insights and Forecast, 2019-2031
- 12.1. Market Analysis, Insights and Forecast - By Country/Sub-region
- 12.1.1 China
- 12.1.2 Japan
- 12.1.3 India
- 12.1.4 South Korea
- 12.1.5 Southeast Asia
- 12.1.6 Australia
- 12.1.7 Indonesia
- 12.1.8 Phillipes
- 12.1.9 Singapore
- 12.1.10 Thailandc
- 12.1.11 Rest of Asia Pacific
- 13. South America AI Computing Hardware Industry Analysis, Insights and Forecast, 2019-2031
- 13.1. Market Analysis, Insights and Forecast - By Country/Sub-region
- 13.1.1 Brazil
- 13.1.2 Argentina
- 13.1.3 Peru
- 13.1.4 Chile
- 13.1.5 Colombia
- 13.1.6 Ecuador
- 13.1.7 Venezuela
- 13.1.8 Rest of South America
- 14. North America AI Computing Hardware Industry Analysis, Insights and Forecast, 2019-2031
- 14.1. Market Analysis, Insights and Forecast - By Country/Sub-region
- 14.1.1 United States
- 14.1.2 Canada
- 14.1.3 Mexico
- 15. MEA AI Computing Hardware Industry Analysis, Insights and Forecast, 2019-2031
- 15.1. Market Analysis, Insights and Forecast - By Country/Sub-region
- 15.1.1 United Arab Emirates
- 15.1.2 Saudi Arabia
- 15.1.3 South Africa
- 15.1.4 Rest of Middle East and Africa
- 16. Competitive Analysis
- 16.1. Global Market Share Analysis 2024
- 16.2. Company Profiles
- 16.2.1 CEVA Inc
- 16.2.1.1. Overview
- 16.2.1.2. Products
- 16.2.1.3. SWOT Analysis
- 16.2.1.4. Recent Developments
- 16.2.1.5. Financials (Based on Availability)
- 16.2.2 NXP Semiconductors NV
- 16.2.2.1. Overview
- 16.2.2.2. Products
- 16.2.2.3. SWOT Analysis
- 16.2.2.4. Recent Developments
- 16.2.2.5. Financials (Based on Availability)
- 16.2.3 Allied Vision Technologies GmbH
- 16.2.3.1. Overview
- 16.2.3.2. Products
- 16.2.3.3. SWOT Analysis
- 16.2.3.4. Recent Developments
- 16.2.3.5. Financials (Based on Availability)
- 16.2.4 Basler AG
- 16.2.4.1. Overview
- 16.2.4.2. Products
- 16.2.4.3. SWOT Analysis
- 16.2.4.4. Recent Developments
- 16.2.4.5. Financials (Based on Availability)
- 16.2.5 Knowles Electronics LLC
- 16.2.5.1. Overview
- 16.2.5.2. Products
- 16.2.5.3. SWOT Analysis
- 16.2.5.4. Recent Developments
- 16.2.5.5. Financials (Based on Availability)
- 16.2.6 Synopsys Inc
- 16.2.6.1. Overview
- 16.2.6.2. Products
- 16.2.6.3. SWOT Analysis
- 16.2.6.4. Recent Developments
- 16.2.6.5. Financials (Based on Availability)
- 16.2.7 GreenWaves Technologies
- 16.2.7.1. Overview
- 16.2.7.2. Products
- 16.2.7.3. SWOT Analysis
- 16.2.7.4. Recent Developments
- 16.2.7.5. Financials (Based on Availability)
- 16.2.8 Arm Limited
- 16.2.8.1. Overview
- 16.2.8.2. Products
- 16.2.8.3. SWOT Analysis
- 16.2.8.4. Recent Developments
- 16.2.8.5. Financials (Based on Availability)
- 16.2.9 Cadence Design Systems Inc
- 16.2.9.1. Overview
- 16.2.9.2. Products
- 16.2.9.3. SWOT Analysis
- 16.2.9.4. Recent Developments
- 16.2.9.5. Financials (Based on Availability)
- 16.2.10 Andrea Electronics Corporation
- 16.2.10.1. Overview
- 16.2.10.2. Products
- 16.2.10.3. SWOT Analysis
- 16.2.10.4. Recent Developments
- 16.2.10.5. Financials (Based on Availability)
- 16.2.1 CEVA Inc
List of Figures
- Figure 1: Global AI Computing Hardware Industry Revenue Breakdown (Million, %) by Region 2024 & 2032
- Figure 2: North America AI Computing Hardware Industry Revenue (Million), by Country 2024 & 2032
- Figure 3: North America AI Computing Hardware Industry Revenue Share (%), by Country 2024 & 2032
- Figure 4: Europe AI Computing Hardware Industry Revenue (Million), by Country 2024 & 2032
- Figure 5: Europe AI Computing Hardware Industry Revenue Share (%), by Country 2024 & 2032
- Figure 6: Asia Pacific AI Computing Hardware Industry Revenue (Million), by Country 2024 & 2032
- Figure 7: Asia Pacific AI Computing Hardware Industry Revenue Share (%), by Country 2024 & 2032
- Figure 8: South America AI Computing Hardware Industry Revenue (Million), by Country 2024 & 2032
- Figure 9: South America AI Computing Hardware Industry Revenue Share (%), by Country 2024 & 2032
- Figure 10: North America AI Computing Hardware Industry Revenue (Million), by Country 2024 & 2032
- Figure 11: North America AI Computing Hardware Industry Revenue Share (%), by Country 2024 & 2032
- Figure 12: MEA AI Computing Hardware Industry Revenue (Million), by Country 2024 & 2032
- Figure 13: MEA AI Computing Hardware Industry Revenue Share (%), by Country 2024 & 2032
- Figure 14: North America AI Computing Hardware Industry Revenue (Million), by Type 2024 & 2032
- Figure 15: North America AI Computing Hardware Industry Revenue Share (%), by Type 2024 & 2032
- Figure 16: North America AI Computing Hardware Industry Revenue (Million), by End User 2024 & 2032
- Figure 17: North America AI Computing Hardware Industry Revenue Share (%), by End User 2024 & 2032
- Figure 18: North America AI Computing Hardware Industry Revenue (Million), by Country 2024 & 2032
- Figure 19: North America AI Computing Hardware Industry Revenue Share (%), by Country 2024 & 2032
- Figure 20: Europe AI Computing Hardware Industry Revenue (Million), by Type 2024 & 2032
- Figure 21: Europe AI Computing Hardware Industry Revenue Share (%), by Type 2024 & 2032
- Figure 22: Europe AI Computing Hardware Industry Revenue (Million), by End User 2024 & 2032
- Figure 23: Europe AI Computing Hardware Industry Revenue Share (%), by End User 2024 & 2032
- Figure 24: Europe AI Computing Hardware Industry Revenue (Million), by Country 2024 & 2032
- Figure 25: Europe AI Computing Hardware Industry Revenue Share (%), by Country 2024 & 2032
- Figure 26: Asia Pacific AI Computing Hardware Industry Revenue (Million), by Type 2024 & 2032
- Figure 27: Asia Pacific AI Computing Hardware Industry Revenue Share (%), by Type 2024 & 2032
- Figure 28: Asia Pacific AI Computing Hardware Industry Revenue (Million), by End User 2024 & 2032
- Figure 29: Asia Pacific AI Computing Hardware Industry Revenue Share (%), by End User 2024 & 2032
- Figure 30: Asia Pacific AI Computing Hardware Industry Revenue (Million), by Country 2024 & 2032
- Figure 31: Asia Pacific AI Computing Hardware Industry Revenue Share (%), by Country 2024 & 2032
- Figure 32: Rest of the World AI Computing Hardware Industry Revenue (Million), by Type 2024 & 2032
- Figure 33: Rest of the World AI Computing Hardware Industry Revenue Share (%), by Type 2024 & 2032
- Figure 34: Rest of the World AI Computing Hardware Industry Revenue (Million), by End User 2024 & 2032
- Figure 35: Rest of the World AI Computing Hardware Industry Revenue Share (%), by End User 2024 & 2032
- Figure 36: Rest of the World AI Computing Hardware Industry Revenue (Million), by Country 2024 & 2032
- Figure 37: Rest of the World AI Computing Hardware Industry Revenue Share (%), by Country 2024 & 2032
List of Tables
- Table 1: Global AI Computing Hardware Industry Revenue Million Forecast, by Region 2019 & 2032
- Table 2: Global AI Computing Hardware Industry Revenue Million Forecast, by Type 2019 & 2032
- Table 3: Global AI Computing Hardware Industry Revenue Million Forecast, by End User 2019 & 2032
- Table 4: Global AI Computing Hardware Industry Revenue Million Forecast, by Region 2019 & 2032
- Table 5: Global AI Computing Hardware Industry Revenue Million Forecast, by Country 2019 & 2032
- Table 6: United States AI Computing Hardware Industry Revenue (Million) Forecast, by Application 2019 & 2032
- Table 7: Canada AI Computing Hardware Industry Revenue (Million) Forecast, by Application 2019 & 2032
- Table 8: Mexico AI Computing Hardware Industry Revenue (Million) Forecast, by Application 2019 & 2032
- Table 9: Global AI Computing Hardware Industry Revenue Million Forecast, by Country 2019 & 2032
- Table 10: Germany AI Computing Hardware Industry Revenue (Million) Forecast, by Application 2019 & 2032
- Table 11: United Kingdom AI Computing Hardware Industry Revenue (Million) Forecast, by Application 2019 & 2032
- Table 12: France AI Computing Hardware Industry Revenue (Million) Forecast, by Application 2019 & 2032
- Table 13: Spain AI Computing Hardware Industry Revenue (Million) Forecast, by Application 2019 & 2032
- Table 14: Italy AI Computing Hardware Industry Revenue (Million) Forecast, by Application 2019 & 2032
- Table 15: Spain AI Computing Hardware Industry Revenue (Million) Forecast, by Application 2019 & 2032
- Table 16: Belgium AI Computing Hardware Industry Revenue (Million) Forecast, by Application 2019 & 2032
- Table 17: Netherland AI Computing Hardware Industry Revenue (Million) Forecast, by Application 2019 & 2032
- Table 18: Nordics AI Computing Hardware Industry Revenue (Million) Forecast, by Application 2019 & 2032
- Table 19: Rest of Europe AI Computing Hardware Industry Revenue (Million) Forecast, by Application 2019 & 2032
- Table 20: Global AI Computing Hardware Industry Revenue Million Forecast, by Country 2019 & 2032
- Table 21: China AI Computing Hardware Industry Revenue (Million) Forecast, by Application 2019 & 2032
- Table 22: Japan AI Computing Hardware Industry Revenue (Million) Forecast, by Application 2019 & 2032
- Table 23: India AI Computing Hardware Industry Revenue (Million) Forecast, by Application 2019 & 2032
- Table 24: South Korea AI Computing Hardware Industry Revenue (Million) Forecast, by Application 2019 & 2032
- Table 25: Southeast Asia AI Computing Hardware Industry Revenue (Million) Forecast, by Application 2019 & 2032
- Table 26: Australia AI Computing Hardware Industry Revenue (Million) Forecast, by Application 2019 & 2032
- Table 27: Indonesia AI Computing Hardware Industry Revenue (Million) Forecast, by Application 2019 & 2032
- Table 28: Phillipes AI Computing Hardware Industry Revenue (Million) Forecast, by Application 2019 & 2032
- Table 29: Singapore AI Computing Hardware Industry Revenue (Million) Forecast, by Application 2019 & 2032
- Table 30: Thailandc AI Computing Hardware Industry Revenue (Million) Forecast, by Application 2019 & 2032
- Table 31: Rest of Asia Pacific AI Computing Hardware Industry Revenue (Million) Forecast, by Application 2019 & 2032
- Table 32: Global AI Computing Hardware Industry Revenue Million Forecast, by Country 2019 & 2032
- Table 33: Brazil AI Computing Hardware Industry Revenue (Million) Forecast, by Application 2019 & 2032
- Table 34: Argentina AI Computing Hardware Industry Revenue (Million) Forecast, by Application 2019 & 2032
- Table 35: Peru AI Computing Hardware Industry Revenue (Million) Forecast, by Application 2019 & 2032
- Table 36: Chile AI Computing Hardware Industry Revenue (Million) Forecast, by Application 2019 & 2032
- Table 37: Colombia AI Computing Hardware Industry Revenue (Million) Forecast, by Application 2019 & 2032
- Table 38: Ecuador AI Computing Hardware Industry Revenue (Million) Forecast, by Application 2019 & 2032
- Table 39: Venezuela AI Computing Hardware Industry Revenue (Million) Forecast, by Application 2019 & 2032
- Table 40: Rest of South America AI Computing Hardware Industry Revenue (Million) Forecast, by Application 2019 & 2032
- Table 41: Global AI Computing Hardware Industry Revenue Million Forecast, by Country 2019 & 2032
- Table 42: United States AI Computing Hardware Industry Revenue (Million) Forecast, by Application 2019 & 2032
- Table 43: Canada AI Computing Hardware Industry Revenue (Million) Forecast, by Application 2019 & 2032
- Table 44: Mexico AI Computing Hardware Industry Revenue (Million) Forecast, by Application 2019 & 2032
- Table 45: Global AI Computing Hardware Industry Revenue Million Forecast, by Country 2019 & 2032
- Table 46: United Arab Emirates AI Computing Hardware Industry Revenue (Million) Forecast, by Application 2019 & 2032
- Table 47: Saudi Arabia AI Computing Hardware Industry Revenue (Million) Forecast, by Application 2019 & 2032
- Table 48: South Africa AI Computing Hardware Industry Revenue (Million) Forecast, by Application 2019 & 2032
- Table 49: Rest of Middle East and Africa AI Computing Hardware Industry Revenue (Million) Forecast, by Application 2019 & 2032
- Table 50: Global AI Computing Hardware Industry Revenue Million Forecast, by Type 2019 & 2032
- Table 51: Global AI Computing Hardware Industry Revenue Million Forecast, by End User 2019 & 2032
- Table 52: Global AI Computing Hardware Industry Revenue Million Forecast, by Country 2019 & 2032
- Table 53: United States AI Computing Hardware Industry Revenue (Million) Forecast, by Application 2019 & 2032
- Table 54: Canada AI Computing Hardware Industry Revenue (Million) Forecast, by Application 2019 & 2032
- Table 55: Global AI Computing Hardware Industry Revenue Million Forecast, by Type 2019 & 2032
- Table 56: Global AI Computing Hardware Industry Revenue Million Forecast, by End User 2019 & 2032
- Table 57: Global AI Computing Hardware Industry Revenue Million Forecast, by Country 2019 & 2032
- Table 58: Germany AI Computing Hardware Industry Revenue (Million) Forecast, by Application 2019 & 2032
- Table 59: United Kingdom AI Computing Hardware Industry Revenue (Million) Forecast, by Application 2019 & 2032
- Table 60: France AI Computing Hardware Industry Revenue (Million) Forecast, by Application 2019 & 2032
- Table 61: Rest of Europe AI Computing Hardware Industry Revenue (Million) Forecast, by Application 2019 & 2032
- Table 62: Global AI Computing Hardware Industry Revenue Million Forecast, by Type 2019 & 2032
- Table 63: Global AI Computing Hardware Industry Revenue Million Forecast, by End User 2019 & 2032
- Table 64: Global AI Computing Hardware Industry Revenue Million Forecast, by Country 2019 & 2032
- Table 65: China AI Computing Hardware Industry Revenue (Million) Forecast, by Application 2019 & 2032
- Table 66: Japan AI Computing Hardware Industry Revenue (Million) Forecast, by Application 2019 & 2032
- Table 67: South Korea AI Computing Hardware Industry Revenue (Million) Forecast, by Application 2019 & 2032
- Table 68: Rest of Asia Pacific AI Computing Hardware Industry Revenue (Million) Forecast, by Application 2019 & 2032
- Table 69: Global AI Computing Hardware Industry Revenue Million Forecast, by Type 2019 & 2032
- Table 70: Global AI Computing Hardware Industry Revenue Million Forecast, by End User 2019 & 2032
- Table 71: Global AI Computing Hardware Industry Revenue Million Forecast, by Country 2019 & 2032
- Table 72: Latin America AI Computing Hardware Industry Revenue (Million) Forecast, by Application 2019 & 2032
- Table 73: Middle East and Africa AI Computing Hardware Industry Revenue (Million) Forecast, by Application 2019 & 2032
Frequently Asked Questions
1. What is the projected Compound Annual Growth Rate (CAGR) of the AI Computing Hardware Industry?
The projected CAGR is approximately 26.00%.
2. Which companies are prominent players in the AI Computing Hardware Industry?
Key companies in the market include CEVA Inc, NXP Semiconductors NV, Allied Vision Technologies GmbH, Basler AG, Knowles Electronics LLC, Synopsys Inc, GreenWaves Technologies, Arm Limited, Cadence Design Systems Inc, Andrea Electronics Corporation.
3. What are the main segments of the AI Computing Hardware Industry?
The market segments include Type, End User.
4. Can you provide details about the market size?
The market size is estimated to be USD XX Million as of 2022.
5. What are some drivers contributing to market growth?
; Demand for AI Computing Hardware in the Defense sector; Adoption of Field-programmable Gate Arrays (FPGA) for High Computing Speed.
6. What are the notable trends driving market growth?
Automotive Sector to Witness Significant Growth.
7. Are there any restraints impacting market growth?
; Limited Number of AI Experts and High Power Consumption.
8. Can you provide examples of recent developments in the market?
N/A
9. What pricing options are available for accessing the report?
Pricing options include single-user, multi-user, and enterprise licenses priced at USD 4750, USD 5250, and USD 8750 respectively.
10. Is the market size provided in terms of value or volume?
The market size is provided in terms of value, measured in Million.
11. Are there any specific market keywords associated with the report?
Yes, the market keyword associated with the report is "AI Computing Hardware Industry," which aids in identifying and referencing the specific market segment covered.
12. How do I determine which pricing option suits my needs best?
The pricing options vary based on user requirements and access needs. Individual users may opt for single-user licenses, while businesses requiring broader access may choose multi-user or enterprise licenses for cost-effective access to the report.
13. Are there any additional resources or data provided in the AI Computing Hardware Industry report?
While the report offers comprehensive insights, it's advisable to review the specific contents or supplementary materials provided to ascertain if additional resources or data are available.
14. How can I stay updated on further developments or reports in the AI Computing Hardware Industry?
To stay informed about further developments, trends, and reports in the AI Computing Hardware Industry, consider subscribing to industry newsletters, following relevant companies and organizations, or regularly checking reputable industry news sources and publications.
Methodology
Step 1 - Identification of Relevant Samples Size from Population Database


Step 2 - Approaches for Defining Global Market Size (Value, Volume* & Price*)

Note*: In applicable scenarios
Step 3 - Data Sources
Primary Research
- Web Analytics
- Survey Reports
- Research Institute
- Latest Research Reports
- Opinion Leaders
Secondary Research
- Annual Reports
- White Paper
- Latest Press Release
- Industry Association
- Paid Database
- Investor Presentations

Step 4 - Data Triangulation
Involves using different sources of information in order to increase the validity of a study
These sources are likely to be stakeholders in a program - participants, other researchers, program staff, other community members, and so on.
Then we put all data in single framework & apply various statistical tools to find out the dynamic on the market.
During the analysis stage, feedback from the stakeholder groups would be compared to determine areas of agreement as well as areas of divergence
