

Key Insights
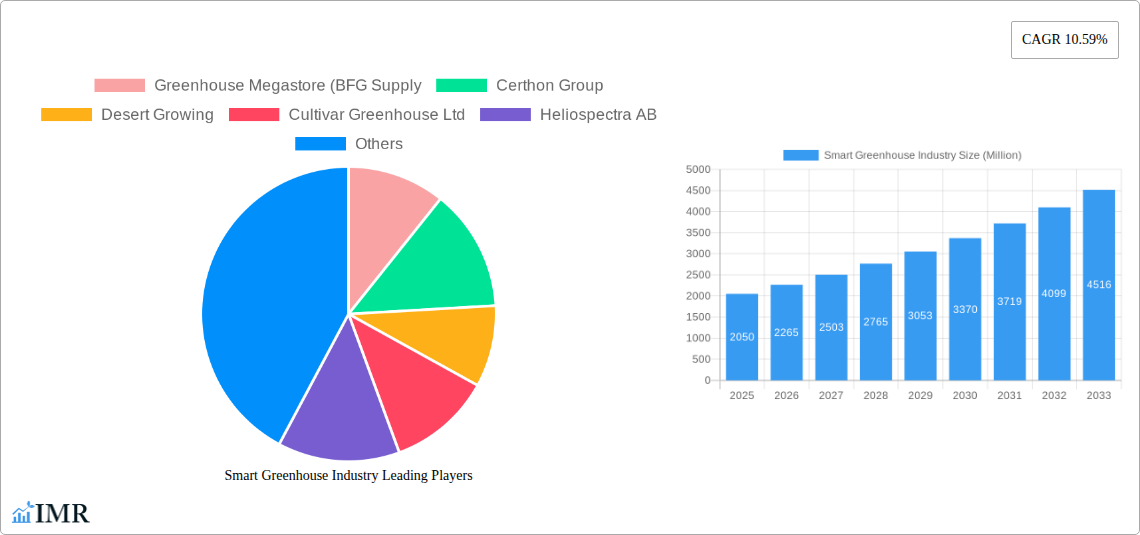
The global smart greenhouse market is experiencing robust growth, projected to reach \$2.05 billion in 2025 and exhibiting a Compound Annual Growth Rate (CAGR) of 10.59% from 2025 to 2033. This expansion is driven by several key factors. Firstly, the increasing global population necessitates efficient and sustainable food production methods, making smart greenhouses, with their optimized resource utilization and enhanced yields, an attractive solution. Secondly, technological advancements in areas such as LED grow lights, automated irrigation systems, and sophisticated climate control offer significant improvements in crop quality and quantity, boosting profitability for growers. Furthermore, the growing adoption of precision agriculture techniques, data analytics, and IoT integration within greenhouses allows for real-time monitoring and adjustments, leading to reduced operational costs and minimized environmental impact. Government initiatives promoting sustainable agriculture and technological innovation in farming also contribute to market growth. Competition among established players and new entrants fuels innovation and offers a diverse range of solutions to meet the specific needs of various agricultural applications.
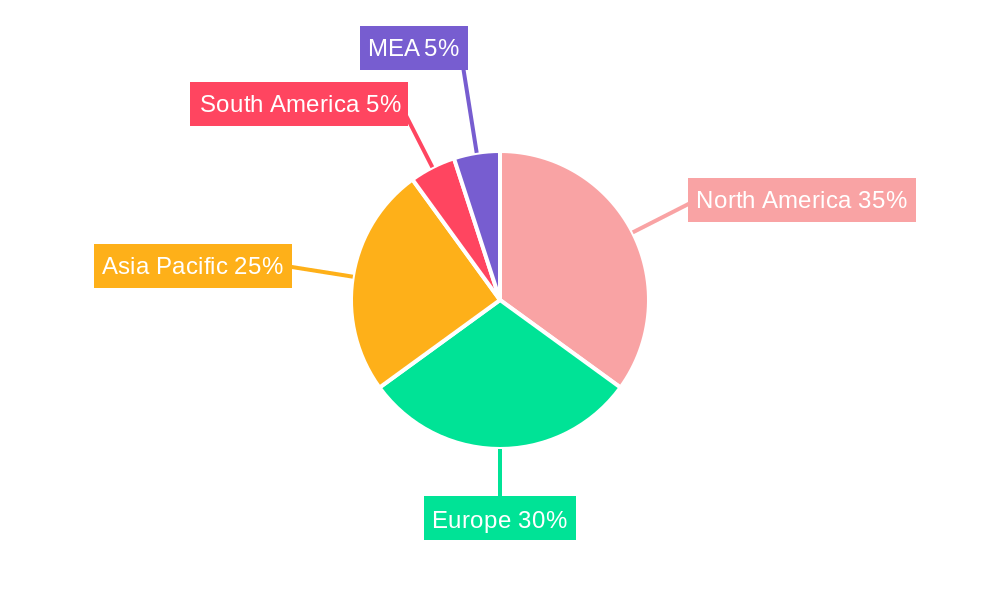
The market segmentation reveals significant opportunities across different technologies and types of greenhouses. Hydroponic systems are gaining traction due to their superior water efficiency and yield potential compared to traditional methods. Among technologies, LED grow lights are experiencing high demand due to their energy efficiency and ability to optimize light spectrum for plant growth. HVAC systems, material handling solutions, and advanced control systems are also crucial components driving the smart greenhouse market. Geographically, North America and Europe currently hold significant market share, driven by technological advancements and high adoption rates within the agricultural sector. However, the Asia-Pacific region presents substantial growth potential due to the increasing demand for food security and the rapid expansion of the agricultural technology sector in countries like China and India. The continued development of innovative technologies and the expansion of smart greenhouse adoption in emerging markets will further fuel market growth in the coming years.
Smart Greenhouse Industry Market Report: 2019-2033
This comprehensive report provides a detailed analysis of the Smart Greenhouse Industry, encompassing market dynamics, growth trends, regional analysis, product landscape, and key player strategies. The study period covers 2019-2033, with 2025 as the base and estimated year. This report is invaluable for industry professionals, investors, and stakeholders seeking to understand and capitalize on the burgeoning opportunities within the smart greenhouse sector. The parent market is the broader agricultural technology sector, while the child market is specifically focused on controlled environment agriculture (CEA) solutions for commercial greenhouse operations. The total market size is projected to reach xx Million by 2033.
Smart Greenhouse Industry Market Dynamics & Structure
The smart greenhouse market is characterized by moderate concentration, with several major players dominating specific segments. Technological innovation, particularly in areas like AI-driven climate control and precision irrigation, is a key driver. Regulatory frameworks, varying across regions, influence adoption rates and investment. Competitive substitutes include traditional open-field farming and less sophisticated greenhouse technologies. The end-user demographic comprises commercial growers, research institutions, and vertical farming operations. M&A activity is moderate, with strategic acquisitions focused on expanding technological capabilities and geographical reach.
- Market Concentration: Moderately concentrated, with top 10 players holding approximately 60% market share in 2025.
- Technological Innovation: Focus on AI, IoT, and automation driving efficiency and yield improvements.
- Regulatory Frameworks: Varying regulations impacting adoption and investment across different regions.
- Competitive Substitutes: Traditional farming and basic greenhouse technologies pose competition.
- End-User Demographics: Commercial growers, research institutions, and vertical farms constitute the primary users.
- M&A Trends: Moderate activity, with strategic acquisitions aimed at technology expansion and market reach. Approximately 20 M&A deals were recorded between 2019 and 2024.
Smart Greenhouse Industry Growth Trends & Insights
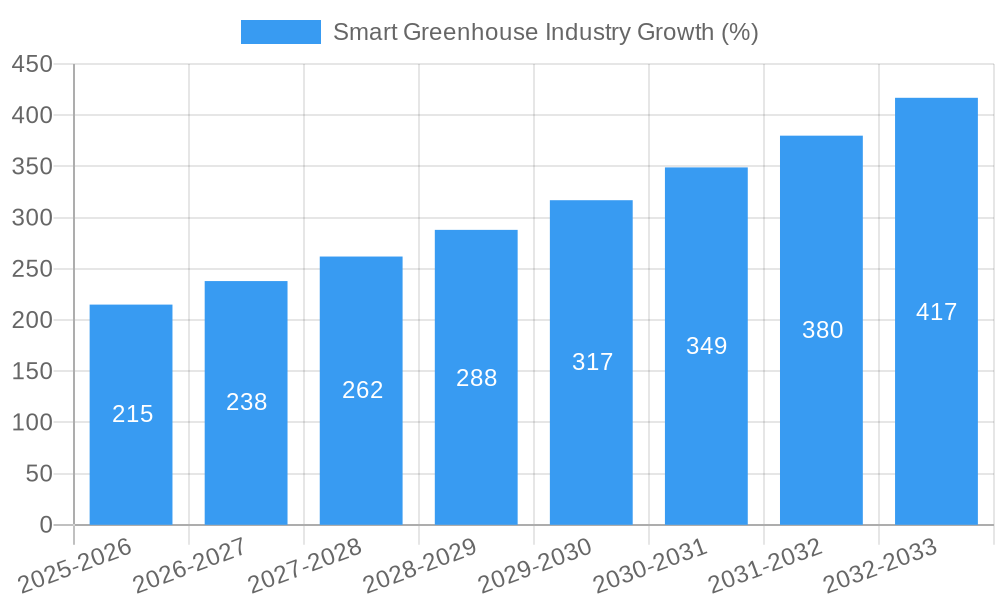
The smart greenhouse market is experiencing robust growth, driven by rising demand for sustainable and efficient food production. Adoption rates are increasing steadily, particularly in regions with favorable government policies and advanced agricultural infrastructure. Technological disruptions, such as the integration of AI and machine learning, are significantly enhancing productivity and optimizing resource utilization. Shifting consumer preferences towards locally sourced, high-quality produce further fuel market expansion. The market is expected to exhibit a CAGR of xx% during the forecast period (2025-2033), reaching xx Million by 2033. Market penetration is currently at approximately xx% and is projected to increase to xx% by 2033. This growth is fueled by increasing consumer demand for fresh produce, coupled with the need for sustainable agricultural practices and improved yield efficiency.
Dominant Regions, Countries, or Segments in Smart Greenhouse Industry
North America and Europe currently dominate the smart greenhouse market, driven by high technological adoption, advanced agricultural infrastructure, and supportive government policies. Within these regions, countries such as the Netherlands, Canada, and the United States lead in terms of market share and growth potential. The hydroponic segment, within the "By Type" categorization, demonstrates faster growth compared to the non-hydroponic segment, due to its enhanced efficiency and controlled environment capabilities. Among "By Technology" segments, LED grow lights and control systems are witnessing the highest demand, followed by HVAC and irrigation systems.
- Key Drivers: Government incentives, technological advancements, and increasing demand for sustainable food production.
- Dominance Factors: Advanced agricultural infrastructure, high technological adoption rates, and supportive regulatory environments.
- Growth Potential: Significant potential exists in developing economies, driven by rising consumer demand and increasing investments in agricultural modernization.
Smart Greenhouse Industry Product Landscape
Smart greenhouse solutions encompass a wide range of technologies, from advanced climate control systems and precision irrigation to AI-powered monitoring and automated harvesting. Innovations focus on enhancing yield, optimizing resource utilization, and improving overall efficiency. Unique selling propositions include increased crop yields, reduced water and energy consumption, and improved product quality. Technological advancements are continuously pushing the boundaries of efficiency and sustainability within the smart greenhouse sector.
Key Drivers, Barriers & Challenges in Smart Greenhouse Industry
Key Drivers:
- Increasing demand for sustainable and efficient food production.
- Technological advancements in automation, AI, and IoT.
- Government initiatives and subsidies promoting smart agriculture.
- Rising consumer preference for locally sourced and high-quality produce.
Challenges:
- High initial investment costs for technology implementation.
- Skilled labor shortages for operating and maintaining smart greenhouse systems.
- Supply chain disruptions impacting the availability of crucial components.
- Regulatory hurdles and varying standards across different jurisdictions. These factors can collectively reduce market growth by an estimated 5% annually.
Emerging Opportunities in Smart Greenhouse Industry
Emerging opportunities include the expansion into untapped markets in developing countries, the development of more energy-efficient and sustainable technologies, and the integration of vertical farming techniques within smart greenhouses. Innovation in disease control and pest management, as well as advancements in precision fertilization, present significant potential for growth. The rising demand for organic and specialty crops is also driving the development of specialized smart greenhouse solutions.
Growth Accelerators in the Smart Greenhouse Industry
Long-term growth in the smart greenhouse industry is fueled by technological breakthroughs in areas such as AI-powered predictive analytics, improved sensor technology, and the development of more resilient and disease-resistant crops. Strategic partnerships between technology providers, growers, and investors further accelerate market expansion. Expanding into new geographical regions and addressing the unique needs of specific markets are also crucial for driving long-term growth.
Key Players Shaping the Smart Greenhouse Industry Market
- Greenhouse Megastore (BFG Supply)
- Certhon Group
- Desert Growing
- Cultivar Greenhouse Ltd
- Heliospectra AB
- Sensaphone
- Luiten Greenhouses
- Argus Control Systems Ltd
- Prospiant Inc
- Kubo Greenhouse Projects BV
- Agra Tech Inc
- Netafim Irrigation Inc
Notable Milestones in Smart Greenhouse Industry Sector
- October 2023: Netafim partnered with Vermillion Growers to build a large-scale vegetable greenhouse in Manitoba, Canada, showcasing the growing adoption of CEA technologies.
- January 2024: The Iranian government launched a large glass smart greenhouse in Zanjan province, indicating government support for advanced agricultural technologies in developing nations.
In-Depth Smart Greenhouse Industry Market Outlook
The smart greenhouse market is poised for significant growth in the coming years, driven by a confluence of factors including increasing consumer demand for sustainably produced food, technological advancements, and supportive government policies. Strategic opportunities lie in developing innovative solutions for specific crops and regions, enhancing resource efficiency, and expanding into new market segments. The focus on vertical farming integration and the application of AI-powered predictive analytics will be crucial in shaping the future of the smart greenhouse industry.
Smart Greenhouse Industry Segmentation
-
1. Type
- 1.1. Hydroponic
- 1.2. Non-hydroponic
-
2. Technology
- 2.1. LED Grow Light
- 2.2. HVAC
- 2.3. Material Handling
- 2.4. Control Systems
- 2.5. Sensors and Cameras
- 2.6. Valves and Pumps
- 2.7. Irrigation Systems
Smart Greenhouse Industry Segmentation By Geography
-
1. North America
- 1.1. United States
- 1.2. Canada
-
2. Europe
- 2.1. Germany
- 2.2. United Kingdom
- 2.3. France
- 2.4. Rest of Europe
-
3. Asia Pacific
- 3.1. India
- 3.2. China
- 3.3. Japan
- 3.4. Rest of Asia Pacific
- 4. Latin America
- 5. Middle East
Smart Greenhouse Industry REPORT HIGHLIGHTS
| Aspects | Details |
|---|---|
| Study Period | 2019-2033 |
| Base Year | 2024 |
| Estimated Year | 2025 |
| Forecast Period | 2025-2033 |
| Historical Period | 2019-2024 |
| Growth Rate | CAGR of 10.59% from 2019-2033 |
| Segmentation |
|
Table of Contents
- 1. Introduction
- 1.1. Research Scope
- 1.2. Market Segmentation
- 1.3. Research Methodology
- 1.4. Definitions and Assumptions
- 2. Executive Summary
- 2.1. Introduction
- 3. Market Dynamics
- 3.1. Introduction
- 3.2. Market Drivers
- 3.2.1. Increasing Adoption of IoT and AI by Farmers and Agriculturists; Growing Demand for Food due to Continuously Increasing Global Population
- 3.3. Market Restrains
- 3.3.1. High Costs and Operational Concerns; Concerns related to Geoprivacy and Confidential Data
- 3.4. Market Trends
- 3.4.1. HVAC Segment to Hold Significant Market Share
- 4. Market Factor Analysis
- 4.1. Porters Five Forces
- 4.2. Supply/Value Chain
- 4.3. PESTEL analysis
- 4.4. Market Entropy
- 4.5. Patent/Trademark Analysis
- 5. Global Smart Greenhouse Industry Analysis, Insights and Forecast, 2019-2031
- 5.1. Market Analysis, Insights and Forecast - by Type
- 5.1.1. Hydroponic
- 5.1.2. Non-hydroponic
- 5.2. Market Analysis, Insights and Forecast - by Technology
- 5.2.1. LED Grow Light
- 5.2.2. HVAC
- 5.2.3. Material Handling
- 5.2.4. Control Systems
- 5.2.5. Sensors and Cameras
- 5.2.6. Valves and Pumps
- 5.2.7. Irrigation Systems
- 5.3. Market Analysis, Insights and Forecast - by Region
- 5.3.1. North America
- 5.3.2. Europe
- 5.3.3. Asia Pacific
- 5.3.4. Latin America
- 5.3.5. Middle East
- 5.1. Market Analysis, Insights and Forecast - by Type
- 6. North America Smart Greenhouse Industry Analysis, Insights and Forecast, 2019-2031
- 6.1. Market Analysis, Insights and Forecast - by Type
- 6.1.1. Hydroponic
- 6.1.2. Non-hydroponic
- 6.2. Market Analysis, Insights and Forecast - by Technology
- 6.2.1. LED Grow Light
- 6.2.2. HVAC
- 6.2.3. Material Handling
- 6.2.4. Control Systems
- 6.2.5. Sensors and Cameras
- 6.2.6. Valves and Pumps
- 6.2.7. Irrigation Systems
- 6.1. Market Analysis, Insights and Forecast - by Type
- 7. Europe Smart Greenhouse Industry Analysis, Insights and Forecast, 2019-2031
- 7.1. Market Analysis, Insights and Forecast - by Type
- 7.1.1. Hydroponic
- 7.1.2. Non-hydroponic
- 7.2. Market Analysis, Insights and Forecast - by Technology
- 7.2.1. LED Grow Light
- 7.2.2. HVAC
- 7.2.3. Material Handling
- 7.2.4. Control Systems
- 7.2.5. Sensors and Cameras
- 7.2.6. Valves and Pumps
- 7.2.7. Irrigation Systems
- 7.1. Market Analysis, Insights and Forecast - by Type
- 8. Asia Pacific Smart Greenhouse Industry Analysis, Insights and Forecast, 2019-2031
- 8.1. Market Analysis, Insights and Forecast - by Type
- 8.1.1. Hydroponic
- 8.1.2. Non-hydroponic
- 8.2. Market Analysis, Insights and Forecast - by Technology
- 8.2.1. LED Grow Light
- 8.2.2. HVAC
- 8.2.3. Material Handling
- 8.2.4. Control Systems
- 8.2.5. Sensors and Cameras
- 8.2.6. Valves and Pumps
- 8.2.7. Irrigation Systems
- 8.1. Market Analysis, Insights and Forecast - by Type
- 9. Latin America Smart Greenhouse Industry Analysis, Insights and Forecast, 2019-2031
- 9.1. Market Analysis, Insights and Forecast - by Type
- 9.1.1. Hydroponic
- 9.1.2. Non-hydroponic
- 9.2. Market Analysis, Insights and Forecast - by Technology
- 9.2.1. LED Grow Light
- 9.2.2. HVAC
- 9.2.3. Material Handling
- 9.2.4. Control Systems
- 9.2.5. Sensors and Cameras
- 9.2.6. Valves and Pumps
- 9.2.7. Irrigation Systems
- 9.1. Market Analysis, Insights and Forecast - by Type
- 10. Middle East Smart Greenhouse Industry Analysis, Insights and Forecast, 2019-2031
- 10.1. Market Analysis, Insights and Forecast - by Type
- 10.1.1. Hydroponic
- 10.1.2. Non-hydroponic
- 10.2. Market Analysis, Insights and Forecast - by Technology
- 10.2.1. LED Grow Light
- 10.2.2. HVAC
- 10.2.3. Material Handling
- 10.2.4. Control Systems
- 10.2.5. Sensors and Cameras
- 10.2.6. Valves and Pumps
- 10.2.7. Irrigation Systems
- 10.1. Market Analysis, Insights and Forecast - by Type
- 11. North America Smart Greenhouse Industry Analysis, Insights and Forecast, 2019-2031
- 11.1. Market Analysis, Insights and Forecast - By Country/Sub-region
- 11.1.1 United States
- 11.1.2 Canada
- 11.1.3 Mexico
- 12. Europe Smart Greenhouse Industry Analysis, Insights and Forecast, 2019-2031
- 12.1. Market Analysis, Insights and Forecast - By Country/Sub-region
- 12.1.1 Germany
- 12.1.2 United Kingdom
- 12.1.3 France
- 12.1.4 Spain
- 12.1.5 Italy
- 12.1.6 Spain
- 12.1.7 Belgium
- 12.1.8 Netherland
- 12.1.9 Nordics
- 12.1.10 Rest of Europe
- 13. Asia Pacific Smart Greenhouse Industry Analysis, Insights and Forecast, 2019-2031
- 13.1. Market Analysis, Insights and Forecast - By Country/Sub-region
- 13.1.1 China
- 13.1.2 Japan
- 13.1.3 India
- 13.1.4 South Korea
- 13.1.5 Southeast Asia
- 13.1.6 Australia
- 13.1.7 Indonesia
- 13.1.8 Phillipes
- 13.1.9 Singapore
- 13.1.10 Thailandc
- 13.1.11 Rest of Asia Pacific
- 14. South America Smart Greenhouse Industry Analysis, Insights and Forecast, 2019-2031
- 14.1. Market Analysis, Insights and Forecast - By Country/Sub-region
- 14.1.1 Brazil
- 14.1.2 Argentina
- 14.1.3 Peru
- 14.1.4 Chile
- 14.1.5 Colombia
- 14.1.6 Ecuador
- 14.1.7 Venezuela
- 14.1.8 Rest of South America
- 15. North America Smart Greenhouse Industry Analysis, Insights and Forecast, 2019-2031
- 15.1. Market Analysis, Insights and Forecast - By Country/Sub-region
- 15.1.1 United States
- 15.1.2 Canada
- 15.1.3 Mexico
- 16. MEA Smart Greenhouse Industry Analysis, Insights and Forecast, 2019-2031
- 16.1. Market Analysis, Insights and Forecast - By Country/Sub-region
- 16.1.1 United Arab Emirates
- 16.1.2 Saudi Arabia
- 16.1.3 South Africa
- 16.1.4 Rest of Middle East and Africa
- 17. Competitive Analysis
- 17.1. Global Market Share Analysis 2024
- 17.2. Company Profiles
- 17.2.1 Greenhouse Megastore (BFG Supply
- 17.2.1.1. Overview
- 17.2.1.2. Products
- 17.2.1.3. SWOT Analysis
- 17.2.1.4. Recent Developments
- 17.2.1.5. Financials (Based on Availability)
- 17.2.2 Certhon Group
- 17.2.2.1. Overview
- 17.2.2.2. Products
- 17.2.2.3. SWOT Analysis
- 17.2.2.4. Recent Developments
- 17.2.2.5. Financials (Based on Availability)
- 17.2.3 Desert Growing
- 17.2.3.1. Overview
- 17.2.3.2. Products
- 17.2.3.3. SWOT Analysis
- 17.2.3.4. Recent Developments
- 17.2.3.5. Financials (Based on Availability)
- 17.2.4 Cultivar Greenhouse Ltd
- 17.2.4.1. Overview
- 17.2.4.2. Products
- 17.2.4.3. SWOT Analysis
- 17.2.4.4. Recent Developments
- 17.2.4.5. Financials (Based on Availability)
- 17.2.5 Heliospectra AB
- 17.2.5.1. Overview
- 17.2.5.2. Products
- 17.2.5.3. SWOT Analysis
- 17.2.5.4. Recent Developments
- 17.2.5.5. Financials (Based on Availability)
- 17.2.6 Sensaphone
- 17.2.6.1. Overview
- 17.2.6.2. Products
- 17.2.6.3. SWOT Analysis
- 17.2.6.4. Recent Developments
- 17.2.6.5. Financials (Based on Availability)
- 17.2.7 Luiten Greenhouses
- 17.2.7.1. Overview
- 17.2.7.2. Products
- 17.2.7.3. SWOT Analysis
- 17.2.7.4. Recent Developments
- 17.2.7.5. Financials (Based on Availability)
- 17.2.8 Argus Control Systems Ltd
- 17.2.8.1. Overview
- 17.2.8.2. Products
- 17.2.8.3. SWOT Analysis
- 17.2.8.4. Recent Developments
- 17.2.8.5. Financials (Based on Availability)
- 17.2.9 Prospiant Inc
- 17.2.9.1. Overview
- 17.2.9.2. Products
- 17.2.9.3. SWOT Analysis
- 17.2.9.4. Recent Developments
- 17.2.9.5. Financials (Based on Availability)
- 17.2.10 Kubo Greenhouse Projects BV
- 17.2.10.1. Overview
- 17.2.10.2. Products
- 17.2.10.3. SWOT Analysis
- 17.2.10.4. Recent Developments
- 17.2.10.5. Financials (Based on Availability)
- 17.2.11 Agra Tech Inc
- 17.2.11.1. Overview
- 17.2.11.2. Products
- 17.2.11.3. SWOT Analysis
- 17.2.11.4. Recent Developments
- 17.2.11.5. Financials (Based on Availability)
- 17.2.12 Netafim Irrigation Inc
- 17.2.12.1. Overview
- 17.2.12.2. Products
- 17.2.12.3. SWOT Analysis
- 17.2.12.4. Recent Developments
- 17.2.12.5. Financials (Based on Availability)
- 17.2.1 Greenhouse Megastore (BFG Supply
List of Figures
- Figure 1: Global Smart Greenhouse Industry Revenue Breakdown (Million, %) by Region 2024 & 2032
- Figure 2: North America Smart Greenhouse Industry Revenue (Million), by Country 2024 & 2032
- Figure 3: North America Smart Greenhouse Industry Revenue Share (%), by Country 2024 & 2032
- Figure 4: Europe Smart Greenhouse Industry Revenue (Million), by Country 2024 & 2032
- Figure 5: Europe Smart Greenhouse Industry Revenue Share (%), by Country 2024 & 2032
- Figure 6: Asia Pacific Smart Greenhouse Industry Revenue (Million), by Country 2024 & 2032
- Figure 7: Asia Pacific Smart Greenhouse Industry Revenue Share (%), by Country 2024 & 2032
- Figure 8: South America Smart Greenhouse Industry Revenue (Million), by Country 2024 & 2032
- Figure 9: South America Smart Greenhouse Industry Revenue Share (%), by Country 2024 & 2032
- Figure 10: North America Smart Greenhouse Industry Revenue (Million), by Country 2024 & 2032
- Figure 11: North America Smart Greenhouse Industry Revenue Share (%), by Country 2024 & 2032
- Figure 12: MEA Smart Greenhouse Industry Revenue (Million), by Country 2024 & 2032
- Figure 13: MEA Smart Greenhouse Industry Revenue Share (%), by Country 2024 & 2032
- Figure 14: North America Smart Greenhouse Industry Revenue (Million), by Type 2024 & 2032
- Figure 15: North America Smart Greenhouse Industry Revenue Share (%), by Type 2024 & 2032
- Figure 16: North America Smart Greenhouse Industry Revenue (Million), by Technology 2024 & 2032
- Figure 17: North America Smart Greenhouse Industry Revenue Share (%), by Technology 2024 & 2032
- Figure 18: North America Smart Greenhouse Industry Revenue (Million), by Country 2024 & 2032
- Figure 19: North America Smart Greenhouse Industry Revenue Share (%), by Country 2024 & 2032
- Figure 20: Europe Smart Greenhouse Industry Revenue (Million), by Type 2024 & 2032
- Figure 21: Europe Smart Greenhouse Industry Revenue Share (%), by Type 2024 & 2032
- Figure 22: Europe Smart Greenhouse Industry Revenue (Million), by Technology 2024 & 2032
- Figure 23: Europe Smart Greenhouse Industry Revenue Share (%), by Technology 2024 & 2032
- Figure 24: Europe Smart Greenhouse Industry Revenue (Million), by Country 2024 & 2032
- Figure 25: Europe Smart Greenhouse Industry Revenue Share (%), by Country 2024 & 2032
- Figure 26: Asia Pacific Smart Greenhouse Industry Revenue (Million), by Type 2024 & 2032
- Figure 27: Asia Pacific Smart Greenhouse Industry Revenue Share (%), by Type 2024 & 2032
- Figure 28: Asia Pacific Smart Greenhouse Industry Revenue (Million), by Technology 2024 & 2032
- Figure 29: Asia Pacific Smart Greenhouse Industry Revenue Share (%), by Technology 2024 & 2032
- Figure 30: Asia Pacific Smart Greenhouse Industry Revenue (Million), by Country 2024 & 2032
- Figure 31: Asia Pacific Smart Greenhouse Industry Revenue Share (%), by Country 2024 & 2032
- Figure 32: Latin America Smart Greenhouse Industry Revenue (Million), by Type 2024 & 2032
- Figure 33: Latin America Smart Greenhouse Industry Revenue Share (%), by Type 2024 & 2032
- Figure 34: Latin America Smart Greenhouse Industry Revenue (Million), by Technology 2024 & 2032
- Figure 35: Latin America Smart Greenhouse Industry Revenue Share (%), by Technology 2024 & 2032
- Figure 36: Latin America Smart Greenhouse Industry Revenue (Million), by Country 2024 & 2032
- Figure 37: Latin America Smart Greenhouse Industry Revenue Share (%), by Country 2024 & 2032
- Figure 38: Middle East Smart Greenhouse Industry Revenue (Million), by Type 2024 & 2032
- Figure 39: Middle East Smart Greenhouse Industry Revenue Share (%), by Type 2024 & 2032
- Figure 40: Middle East Smart Greenhouse Industry Revenue (Million), by Technology 2024 & 2032
- Figure 41: Middle East Smart Greenhouse Industry Revenue Share (%), by Technology 2024 & 2032
- Figure 42: Middle East Smart Greenhouse Industry Revenue (Million), by Country 2024 & 2032
- Figure 43: Middle East Smart Greenhouse Industry Revenue Share (%), by Country 2024 & 2032
List of Tables
- Table 1: Global Smart Greenhouse Industry Revenue Million Forecast, by Region 2019 & 2032
- Table 2: Global Smart Greenhouse Industry Revenue Million Forecast, by Type 2019 & 2032
- Table 3: Global Smart Greenhouse Industry Revenue Million Forecast, by Technology 2019 & 2032
- Table 4: Global Smart Greenhouse Industry Revenue Million Forecast, by Region 2019 & 2032
- Table 5: Global Smart Greenhouse Industry Revenue Million Forecast, by Country 2019 & 2032
- Table 6: United States Smart Greenhouse Industry Revenue (Million) Forecast, by Application 2019 & 2032
- Table 7: Canada Smart Greenhouse Industry Revenue (Million) Forecast, by Application 2019 & 2032
- Table 8: Mexico Smart Greenhouse Industry Revenue (Million) Forecast, by Application 2019 & 2032
- Table 9: Global Smart Greenhouse Industry Revenue Million Forecast, by Country 2019 & 2032
- Table 10: Germany Smart Greenhouse Industry Revenue (Million) Forecast, by Application 2019 & 2032
- Table 11: United Kingdom Smart Greenhouse Industry Revenue (Million) Forecast, by Application 2019 & 2032
- Table 12: France Smart Greenhouse Industry Revenue (Million) Forecast, by Application 2019 & 2032
- Table 13: Spain Smart Greenhouse Industry Revenue (Million) Forecast, by Application 2019 & 2032
- Table 14: Italy Smart Greenhouse Industry Revenue (Million) Forecast, by Application 2019 & 2032
- Table 15: Spain Smart Greenhouse Industry Revenue (Million) Forecast, by Application 2019 & 2032
- Table 16: Belgium Smart Greenhouse Industry Revenue (Million) Forecast, by Application 2019 & 2032
- Table 17: Netherland Smart Greenhouse Industry Revenue (Million) Forecast, by Application 2019 & 2032
- Table 18: Nordics Smart Greenhouse Industry Revenue (Million) Forecast, by Application 2019 & 2032
- Table 19: Rest of Europe Smart Greenhouse Industry Revenue (Million) Forecast, by Application 2019 & 2032
- Table 20: Global Smart Greenhouse Industry Revenue Million Forecast, by Country 2019 & 2032
- Table 21: China Smart Greenhouse Industry Revenue (Million) Forecast, by Application 2019 & 2032
- Table 22: Japan Smart Greenhouse Industry Revenue (Million) Forecast, by Application 2019 & 2032
- Table 23: India Smart Greenhouse Industry Revenue (Million) Forecast, by Application 2019 & 2032
- Table 24: South Korea Smart Greenhouse Industry Revenue (Million) Forecast, by Application 2019 & 2032
- Table 25: Southeast Asia Smart Greenhouse Industry Revenue (Million) Forecast, by Application 2019 & 2032
- Table 26: Australia Smart Greenhouse Industry Revenue (Million) Forecast, by Application 2019 & 2032
- Table 27: Indonesia Smart Greenhouse Industry Revenue (Million) Forecast, by Application 2019 & 2032
- Table 28: Phillipes Smart Greenhouse Industry Revenue (Million) Forecast, by Application 2019 & 2032
- Table 29: Singapore Smart Greenhouse Industry Revenue (Million) Forecast, by Application 2019 & 2032
- Table 30: Thailandc Smart Greenhouse Industry Revenue (Million) Forecast, by Application 2019 & 2032
- Table 31: Rest of Asia Pacific Smart Greenhouse Industry Revenue (Million) Forecast, by Application 2019 & 2032
- Table 32: Global Smart Greenhouse Industry Revenue Million Forecast, by Country 2019 & 2032
- Table 33: Brazil Smart Greenhouse Industry Revenue (Million) Forecast, by Application 2019 & 2032
- Table 34: Argentina Smart Greenhouse Industry Revenue (Million) Forecast, by Application 2019 & 2032
- Table 35: Peru Smart Greenhouse Industry Revenue (Million) Forecast, by Application 2019 & 2032
- Table 36: Chile Smart Greenhouse Industry Revenue (Million) Forecast, by Application 2019 & 2032
- Table 37: Colombia Smart Greenhouse Industry Revenue (Million) Forecast, by Application 2019 & 2032
- Table 38: Ecuador Smart Greenhouse Industry Revenue (Million) Forecast, by Application 2019 & 2032
- Table 39: Venezuela Smart Greenhouse Industry Revenue (Million) Forecast, by Application 2019 & 2032
- Table 40: Rest of South America Smart Greenhouse Industry Revenue (Million) Forecast, by Application 2019 & 2032
- Table 41: Global Smart Greenhouse Industry Revenue Million Forecast, by Country 2019 & 2032
- Table 42: United States Smart Greenhouse Industry Revenue (Million) Forecast, by Application 2019 & 2032
- Table 43: Canada Smart Greenhouse Industry Revenue (Million) Forecast, by Application 2019 & 2032
- Table 44: Mexico Smart Greenhouse Industry Revenue (Million) Forecast, by Application 2019 & 2032
- Table 45: Global Smart Greenhouse Industry Revenue Million Forecast, by Country 2019 & 2032
- Table 46: United Arab Emirates Smart Greenhouse Industry Revenue (Million) Forecast, by Application 2019 & 2032
- Table 47: Saudi Arabia Smart Greenhouse Industry Revenue (Million) Forecast, by Application 2019 & 2032
- Table 48: South Africa Smart Greenhouse Industry Revenue (Million) Forecast, by Application 2019 & 2032
- Table 49: Rest of Middle East and Africa Smart Greenhouse Industry Revenue (Million) Forecast, by Application 2019 & 2032
- Table 50: Global Smart Greenhouse Industry Revenue Million Forecast, by Type 2019 & 2032
- Table 51: Global Smart Greenhouse Industry Revenue Million Forecast, by Technology 2019 & 2032
- Table 52: Global Smart Greenhouse Industry Revenue Million Forecast, by Country 2019 & 2032
- Table 53: United States Smart Greenhouse Industry Revenue (Million) Forecast, by Application 2019 & 2032
- Table 54: Canada Smart Greenhouse Industry Revenue (Million) Forecast, by Application 2019 & 2032
- Table 55: Global Smart Greenhouse Industry Revenue Million Forecast, by Type 2019 & 2032
- Table 56: Global Smart Greenhouse Industry Revenue Million Forecast, by Technology 2019 & 2032
- Table 57: Global Smart Greenhouse Industry Revenue Million Forecast, by Country 2019 & 2032
- Table 58: Germany Smart Greenhouse Industry Revenue (Million) Forecast, by Application 2019 & 2032
- Table 59: United Kingdom Smart Greenhouse Industry Revenue (Million) Forecast, by Application 2019 & 2032
- Table 60: France Smart Greenhouse Industry Revenue (Million) Forecast, by Application 2019 & 2032
- Table 61: Rest of Europe Smart Greenhouse Industry Revenue (Million) Forecast, by Application 2019 & 2032
- Table 62: Global Smart Greenhouse Industry Revenue Million Forecast, by Type 2019 & 2032
- Table 63: Global Smart Greenhouse Industry Revenue Million Forecast, by Technology 2019 & 2032
- Table 64: Global Smart Greenhouse Industry Revenue Million Forecast, by Country 2019 & 2032
- Table 65: India Smart Greenhouse Industry Revenue (Million) Forecast, by Application 2019 & 2032
- Table 66: China Smart Greenhouse Industry Revenue (Million) Forecast, by Application 2019 & 2032
- Table 67: Japan Smart Greenhouse Industry Revenue (Million) Forecast, by Application 2019 & 2032
- Table 68: Rest of Asia Pacific Smart Greenhouse Industry Revenue (Million) Forecast, by Application 2019 & 2032
- Table 69: Global Smart Greenhouse Industry Revenue Million Forecast, by Type 2019 & 2032
- Table 70: Global Smart Greenhouse Industry Revenue Million Forecast, by Technology 2019 & 2032
- Table 71: Global Smart Greenhouse Industry Revenue Million Forecast, by Country 2019 & 2032
- Table 72: Global Smart Greenhouse Industry Revenue Million Forecast, by Type 2019 & 2032
- Table 73: Global Smart Greenhouse Industry Revenue Million Forecast, by Technology 2019 & 2032
- Table 74: Global Smart Greenhouse Industry Revenue Million Forecast, by Country 2019 & 2032
Frequently Asked Questions
1. What is the projected Compound Annual Growth Rate (CAGR) of the Smart Greenhouse Industry?
The projected CAGR is approximately 10.59%.
2. Which companies are prominent players in the Smart Greenhouse Industry?
Key companies in the market include Greenhouse Megastore (BFG Supply, Certhon Group, Desert Growing, Cultivar Greenhouse Ltd, Heliospectra AB, Sensaphone, Luiten Greenhouses, Argus Control Systems Ltd, Prospiant Inc, Kubo Greenhouse Projects BV, Agra Tech Inc, Netafim Irrigation Inc.
3. What are the main segments of the Smart Greenhouse Industry?
The market segments include Type, Technology.
4. Can you provide details about the market size?
The market size is estimated to be USD 2.05 Million as of 2022.
5. What are some drivers contributing to market growth?
Increasing Adoption of IoT and AI by Farmers and Agriculturists; Growing Demand for Food due to Continuously Increasing Global Population.
6. What are the notable trends driving market growth?
HVAC Segment to Hold Significant Market Share.
7. Are there any restraints impacting market growth?
High Costs and Operational Concerns; Concerns related to Geoprivacy and Confidential Data.
8. Can you provide examples of recent developments in the market?
January 2024: The Iranian government launched an innovative glass smart greenhouse in Zanjan province, which is one of the largest in the country. The glass greenhouse spans over 30 ha and includes 7 ha of tunnels. The glass greenhouse primarily grows bell peppers, but there are plans to expand into cherry tomatoes and strawberries soon.
9. What pricing options are available for accessing the report?
Pricing options include single-user, multi-user, and enterprise licenses priced at USD 4750, USD 5250, and USD 8750 respectively.
10. Is the market size provided in terms of value or volume?
The market size is provided in terms of value, measured in Million.
11. Are there any specific market keywords associated with the report?
Yes, the market keyword associated with the report is "Smart Greenhouse Industry," which aids in identifying and referencing the specific market segment covered.
12. How do I determine which pricing option suits my needs best?
The pricing options vary based on user requirements and access needs. Individual users may opt for single-user licenses, while businesses requiring broader access may choose multi-user or enterprise licenses for cost-effective access to the report.
13. Are there any additional resources or data provided in the Smart Greenhouse Industry report?
While the report offers comprehensive insights, it's advisable to review the specific contents or supplementary materials provided to ascertain if additional resources or data are available.
14. How can I stay updated on further developments or reports in the Smart Greenhouse Industry?
To stay informed about further developments, trends, and reports in the Smart Greenhouse Industry, consider subscribing to industry newsletters, following relevant companies and organizations, or regularly checking reputable industry news sources and publications.
Methodology
Step 1 - Identification of Relevant Samples Size from Population Database


Step 2 - Approaches for Defining Global Market Size (Value, Volume* & Price*)

Note*: In applicable scenarios
Step 3 - Data Sources
Primary Research
- Web Analytics
- Survey Reports
- Research Institute
- Latest Research Reports
- Opinion Leaders
Secondary Research
- Annual Reports
- White Paper
- Latest Press Release
- Industry Association
- Paid Database
- Investor Presentations

Step 4 - Data Triangulation
Involves using different sources of information in order to increase the validity of a study
These sources are likely to be stakeholders in a program - participants, other researchers, program staff, other community members, and so on.
Then we put all data in single framework & apply various statistical tools to find out the dynamic on the market.
During the analysis stage, feedback from the stakeholder groups would be compared to determine areas of agreement as well as areas of divergence
