

Key Insights
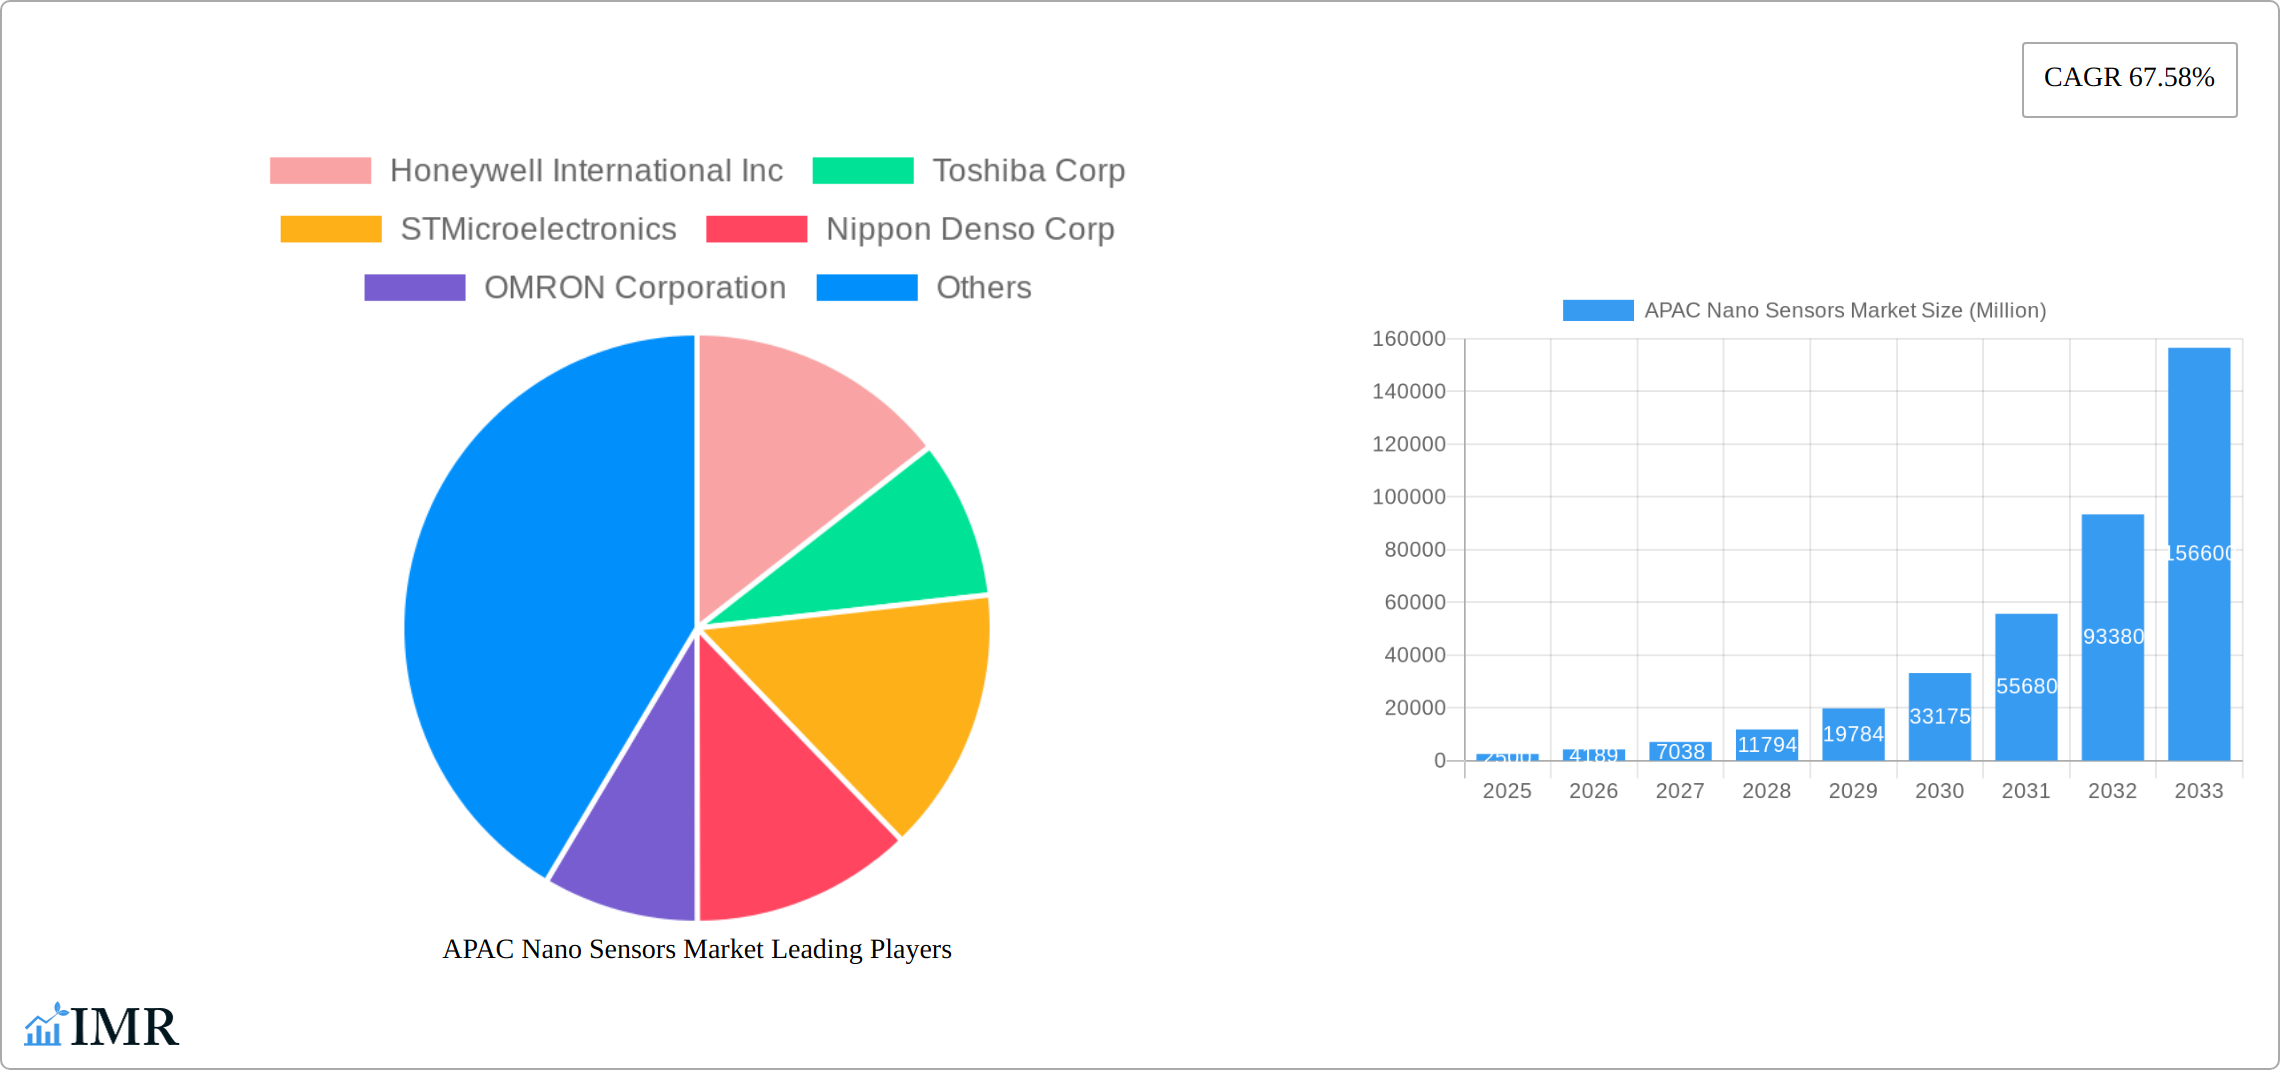
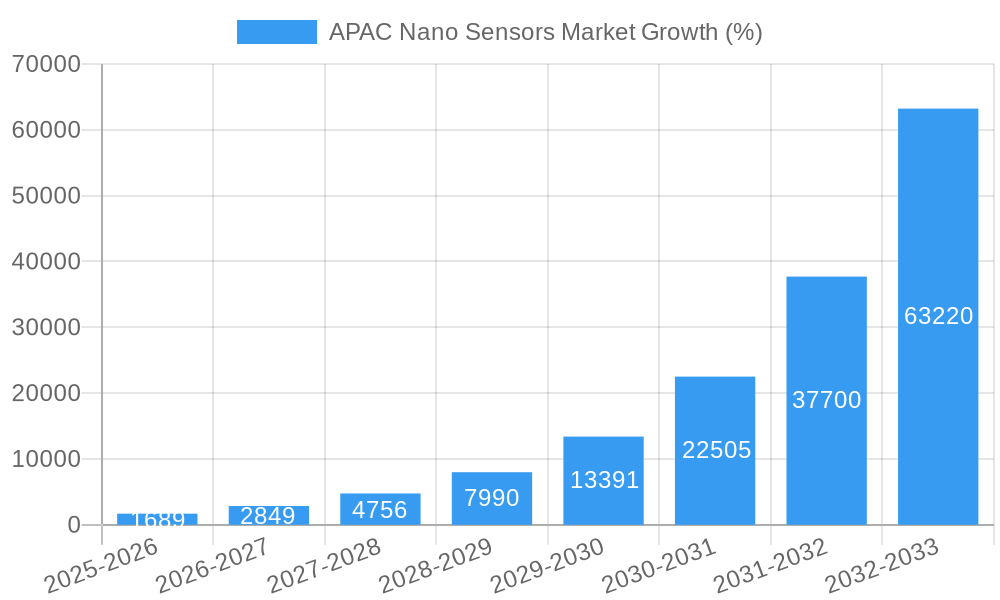
The Asia-Pacific (APAC) nano sensors market is experiencing explosive growth, driven by increasing demand across diverse sectors. The region's burgeoning electronics manufacturing, coupled with significant investments in healthcare and automotive technologies, fuels this expansion. A Compound Annual Growth Rate (CAGR) of 67.58% from 2019 to 2024 indicates a substantial market expansion. While precise figures for 2025 are unavailable, projecting from the historical data and considering the continued technological advancements and adoption across various end-user industries, we can reasonably assume a significant increase in market value. Specific drivers include the miniaturization of electronics, advancements in medical diagnostics, and the rise of smart manufacturing in APAC. The strong presence of major electronics manufacturers and a rapidly growing middle class further amplify market potential. Growth is segmented across sensor types (optical, electrochemical, electromechanical) and end-user industries (consumer electronics, automotive, healthcare, industrial). China, India, and Japan are key contributors to regional market share, although other countries in the region also demonstrate substantial growth potential.
The forecast period (2025-2033) is expected to witness continued, albeit potentially slightly moderated, growth. This moderation might stem from market saturation in specific segments or potential economic fluctuations. However, ongoing technological innovations, particularly in areas like biosensors and environmental monitoring, will likely mitigate any slowdown. The continuous development of more sensitive, precise, and cost-effective nano sensors will open up new applications across various sectors, contributing to sustained market expansion in the long term. The strategic investments in research and development by key players such as those listed (Honeywell International Inc, Toshiba Corp, STMicroelectronics, etc.) will ensure the technology continues to mature, making it more accessible and fostering further market growth. Competition amongst these players will likely drive innovation and further price reductions, contributing positively to the overall market expansion in the APAC region.
APAC Nano Sensors Market: A Comprehensive Report (2019-2033)
This comprehensive report provides a detailed analysis of the Asia-Pacific (APAC) nano sensors market, covering market dynamics, growth trends, dominant segments, key players, and future outlook. The study period spans from 2019 to 2033, with 2025 serving as the base and estimated year. The report uses a forecast period of 2025-2033 and historical period of 2019-2024. This report is crucial for industry professionals, investors, and researchers seeking to understand and capitalize on the significant opportunities within this rapidly evolving market. The market is segmented by type (Optical Sensor, Electrochemical Sensor, Electromechanical Sensor) and end-user industry (Consumer Electronics, Power Generation, Automotive, Petrochemical, Aerospace & Defense, Healthcare, Industrial, Other End-User Industries). The total market value is projected to reach xx Million by 2033.
APAC Nano Sensors Market Market Dynamics & Structure
The APAC nano sensors market is characterized by moderate concentration, with several key players holding significant market share. Technological innovation, particularly in miniaturization and enhanced sensitivity, is a major growth driver. Stringent regulatory frameworks related to safety and environmental impact influence market development. Competitive pressure from substitute technologies exists, but nano sensors' unique capabilities are driving adoption. The end-user demographics show strong demand from rapidly growing sectors like consumer electronics and healthcare. M&A activity has been relatively modest (xx deals in the last 5 years, representing a xx% market share shift), but strategic partnerships are increasingly common.
- Market Concentration: Moderately concentrated, with top 5 players holding approximately xx% market share in 2024.
- Technological Innovation: Significant advancements in materials science and nanofabrication are pushing performance boundaries.
- Regulatory Landscape: Stringent regulations regarding safety and environmental impact are in place, especially in sectors like healthcare and automotive.
- Competitive Substitutes: Micro sensors and traditional sensing technologies pose a competitive threat but are less efficient in specific applications.
- M&A Activity: Relatively low compared to other technology sectors, but strategic acquisitions are anticipated to increase.
- Innovation Barriers: High R&D costs, complex manufacturing processes, and talent acquisition challenges hinder innovation.
APAC Nano Sensors Market Growth Trends & Insights
The APAC nano sensors market has witnessed robust growth over the past few years, driven by increasing demand from various end-user industries. The market size was valued at xx Million in 2024 and is projected to register a CAGR of xx% during the forecast period (2025-2033). This growth is fueled by technological advancements leading to improved sensor performance, miniaturization, and cost reductions. The increasing adoption of IoT devices and smart technologies across various sectors, including consumer electronics, automotive, and healthcare, has further boosted market expansion. Shifting consumer preferences towards technologically advanced and miniaturized products are also key drivers.
Dominant Regions, Countries, or Segments in APAC Nano Sensors Market
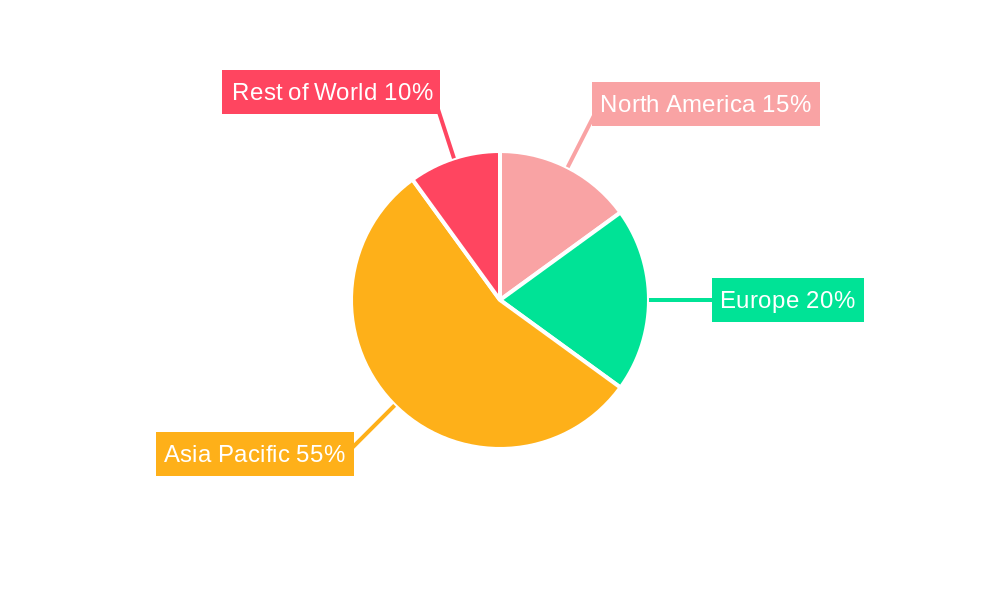
China dominates the APAC nano sensors market, accounting for approximately xx% of the regional market share in 2024, followed by Japan and South Korea. The strong growth in China is primarily attributed to its robust consumer electronics industry and the government’s proactive policies promoting technological advancements. The automotive sector in Japan and South Korea is also a major driver. Within the segments, the optical sensor type holds the largest market share (approximately xx% in 2024), driven by its extensive use in consumer electronics. The consumer electronics segment accounts for a substantial portion of the overall market, while the healthcare and automotive industries are witnessing rapid growth.
- Key Drivers:
- China’s robust consumer electronics market and government support for technological innovation.
- Rapid growth in the automotive sector in Japan and South Korea.
- Increasing demand from healthcare and industrial sectors.
- Dominance Factors:
- Large consumer base in China driving high demand.
- Established manufacturing base and technological expertise in Japan and South Korea.
- Government initiatives fostering technological development.
APAP Nano Sensors Market Product Landscape
Nano sensors are witnessing continuous product innovation, characterized by enhanced sensitivity, improved accuracy, miniaturization, and lower power consumption. Advancements in nanomaterials and fabrication techniques are driving the development of superior sensor performance, enabling broader applications in various sectors. Unique selling propositions center on improved accuracy and sensitivity, smaller form factors, and lower manufacturing costs compared to traditional sensors. Technological advancements focus on integrating advanced functionalities, such as wireless connectivity and data processing capabilities, within the sensors.
Key Drivers, Barriers & Challenges in APAC Nano Sensors Market
Key Drivers:
The increasing demand for miniaturized and high-performance sensors across various end-user industries, coupled with technological advancements leading to improved sensor performance and reduced costs, is a major driver of market growth. Government initiatives promoting technological innovation and the adoption of IoT technologies further propel market expansion.
Key Challenges and Restraints:
High R&D costs and complex manufacturing processes pose significant challenges. The supply chain for specialized materials can be fragile, resulting in potential bottlenecks. Regulatory hurdles and stringent safety standards can limit market entry for new players. Intense competition from established players and emerging technologies adds pressure on market participants.
Emerging Opportunities in APAC Nano Sensors Market
Untapped markets in emerging economies offer significant growth potential. Innovative applications in areas like environmental monitoring, precision agriculture, and smart infrastructure are emerging. Evolving consumer preferences towards personalized healthcare and connected devices create new opportunities.
Growth Accelerators in the APAC Nano Sensors Market Industry
Technological breakthroughs in nanomaterials and sensor design are driving market expansion. Strategic partnerships between sensor manufacturers and end-user industries are fostering innovation. Market expansion strategies targeting emerging economies and new applications create substantial growth opportunities.
Key Players Shaping the APAC Nano Sensors Market Market
- Honeywell International Inc
- Toshiba Corp
- STMicroelectronics
- Nippon Denso Corp
- OMRON Corporation
- Analog Devices Inc
- Teledyne Technologies
- Agilent Technologies
- Samsung Electronics co Limited
Notable Milestones in APAC Nano Sensors Market Sector
- Sept 2021: Omron Corporation launches Sysmac Studio 3D Simulation software, enabling on-site DX acceleration and digital recreation of entire facilities, significantly improving industrial automation processes and potentially boosting the adoption of nano-sensors in industrial settings.
In-Depth APAC Nano Sensors Market Market Outlook
The APAC nano sensors market is poised for significant growth over the next decade, driven by continuous technological advancements, increasing demand from diverse industries, and strategic investments. Strategic partnerships, focused R&D efforts, and expansion into new applications will further accelerate market expansion. The market presents compelling opportunities for both established players and new entrants, with a focus on innovation and addressing specific industry needs being crucial for success.
APAC Nano Sensors Market Segmentation
-
1. Type
- 1.1. Optical Sensor
- 1.2. Electrochemical Sensor
- 1.3. Electromechanical Sensor
-
2. End-User Industry
- 2.1. Consumer Electronics
- 2.2. Power Generation
- 2.3. Automotive
- 2.4. Petrochemical
- 2.5. Aerospace and Defense
- 2.6. Healthcare
- 2.7. Industrial
- 2.8. Other End-User Industries
APAC Nano Sensors Market Segmentation By Geography
-
1. North America
- 1.1. United States
- 1.2. Canada
- 1.3. Mexico
-
2. South America
- 2.1. Brazil
- 2.2. Argentina
- 2.3. Rest of South America
-
3. Europe
- 3.1. United Kingdom
- 3.2. Germany
- 3.3. France
- 3.4. Italy
- 3.5. Spain
- 3.6. Russia
- 3.7. Benelux
- 3.8. Nordics
- 3.9. Rest of Europe
-
4. Middle East & Africa
- 4.1. Turkey
- 4.2. Israel
- 4.3. GCC
- 4.4. North Africa
- 4.5. South Africa
- 4.6. Rest of Middle East & Africa
-
5. Asia Pacific
- 5.1. China
- 5.2. India
- 5.3. Japan
- 5.4. South Korea
- 5.5. ASEAN
- 5.6. Oceania
- 5.7. Rest of Asia Pacific
APAC Nano Sensors Market REPORT HIGHLIGHTS
| Aspects | Details |
|---|---|
| Study Period | 2019-2033 |
| Base Year | 2024 |
| Estimated Year | 2025 |
| Forecast Period | 2025-2033 |
| Historical Period | 2019-2024 |
| Growth Rate | CAGR of 67.58% from 2019-2033 |
| Segmentation |
|
Table of Contents
- 1. Introduction
- 1.1. Research Scope
- 1.2. Market Segmentation
- 1.3. Research Methodology
- 1.4. Definitions and Assumptions
- 2. Executive Summary
- 2.1. Introduction
- 3. Market Dynamics
- 3.1. Introduction
- 3.2. Market Drivers
- 3.2.1. Increasing Trend of Miniaturization and Use of Miniaturized Products Across Various Industries; Increasing research and development in innovative materials
- 3.3. Market Restrains
- 3.3.1. Complexity in Manufacturing Nanosensors
- 3.4. Market Trends
- 3.4.1. The electrochemical segment is expected to command prominent share over the forecasted period
- 4. Market Factor Analysis
- 4.1. Porters Five Forces
- 4.2. Supply/Value Chain
- 4.3. PESTEL analysis
- 4.4. Market Entropy
- 4.5. Patent/Trademark Analysis
- 5. Global APAC Nano Sensors Market Analysis, Insights and Forecast, 2019-2031
- 5.1. Market Analysis, Insights and Forecast - by Type
- 5.1.1. Optical Sensor
- 5.1.2. Electrochemical Sensor
- 5.1.3. Electromechanical Sensor
- 5.2. Market Analysis, Insights and Forecast - by End-User Industry
- 5.2.1. Consumer Electronics
- 5.2.2. Power Generation
- 5.2.3. Automotive
- 5.2.4. Petrochemical
- 5.2.5. Aerospace and Defense
- 5.2.6. Healthcare
- 5.2.7. Industrial
- 5.2.8. Other End-User Industries
- 5.3. Market Analysis, Insights and Forecast - by Region
- 5.3.1. North America
- 5.3.2. South America
- 5.3.3. Europe
- 5.3.4. Middle East & Africa
- 5.3.5. Asia Pacific
- 5.1. Market Analysis, Insights and Forecast - by Type
- 6. North America APAC Nano Sensors Market Analysis, Insights and Forecast, 2019-2031
- 6.1. Market Analysis, Insights and Forecast - by Type
- 6.1.1. Optical Sensor
- 6.1.2. Electrochemical Sensor
- 6.1.3. Electromechanical Sensor
- 6.2. Market Analysis, Insights and Forecast - by End-User Industry
- 6.2.1. Consumer Electronics
- 6.2.2. Power Generation
- 6.2.3. Automotive
- 6.2.4. Petrochemical
- 6.2.5. Aerospace and Defense
- 6.2.6. Healthcare
- 6.2.7. Industrial
- 6.2.8. Other End-User Industries
- 6.1. Market Analysis, Insights and Forecast - by Type
- 7. South America APAC Nano Sensors Market Analysis, Insights and Forecast, 2019-2031
- 7.1. Market Analysis, Insights and Forecast - by Type
- 7.1.1. Optical Sensor
- 7.1.2. Electrochemical Sensor
- 7.1.3. Electromechanical Sensor
- 7.2. Market Analysis, Insights and Forecast - by End-User Industry
- 7.2.1. Consumer Electronics
- 7.2.2. Power Generation
- 7.2.3. Automotive
- 7.2.4. Petrochemical
- 7.2.5. Aerospace and Defense
- 7.2.6. Healthcare
- 7.2.7. Industrial
- 7.2.8. Other End-User Industries
- 7.1. Market Analysis, Insights and Forecast - by Type
- 8. Europe APAC Nano Sensors Market Analysis, Insights and Forecast, 2019-2031
- 8.1. Market Analysis, Insights and Forecast - by Type
- 8.1.1. Optical Sensor
- 8.1.2. Electrochemical Sensor
- 8.1.3. Electromechanical Sensor
- 8.2. Market Analysis, Insights and Forecast - by End-User Industry
- 8.2.1. Consumer Electronics
- 8.2.2. Power Generation
- 8.2.3. Automotive
- 8.2.4. Petrochemical
- 8.2.5. Aerospace and Defense
- 8.2.6. Healthcare
- 8.2.7. Industrial
- 8.2.8. Other End-User Industries
- 8.1. Market Analysis, Insights and Forecast - by Type
- 9. Middle East & Africa APAC Nano Sensors Market Analysis, Insights and Forecast, 2019-2031
- 9.1. Market Analysis, Insights and Forecast - by Type
- 9.1.1. Optical Sensor
- 9.1.2. Electrochemical Sensor
- 9.1.3. Electromechanical Sensor
- 9.2. Market Analysis, Insights and Forecast - by End-User Industry
- 9.2.1. Consumer Electronics
- 9.2.2. Power Generation
- 9.2.3. Automotive
- 9.2.4. Petrochemical
- 9.2.5. Aerospace and Defense
- 9.2.6. Healthcare
- 9.2.7. Industrial
- 9.2.8. Other End-User Industries
- 9.1. Market Analysis, Insights and Forecast - by Type
- 10. Asia Pacific APAC Nano Sensors Market Analysis, Insights and Forecast, 2019-2031
- 10.1. Market Analysis, Insights and Forecast - by Type
- 10.1.1. Optical Sensor
- 10.1.2. Electrochemical Sensor
- 10.1.3. Electromechanical Sensor
- 10.2. Market Analysis, Insights and Forecast - by End-User Industry
- 10.2.1. Consumer Electronics
- 10.2.2. Power Generation
- 10.2.3. Automotive
- 10.2.4. Petrochemical
- 10.2.5. Aerospace and Defense
- 10.2.6. Healthcare
- 10.2.7. Industrial
- 10.2.8. Other End-User Industries
- 10.1. Market Analysis, Insights and Forecast - by Type
- 11. North America APAC Nano Sensors Market Analysis, Insights and Forecast, 2019-2031
- 11.1. Market Analysis, Insights and Forecast - By Country/Sub-region
- 11.1.1 United States
- 11.1.2 Canada
- 12. Europe APAC Nano Sensors Market Analysis, Insights and Forecast, 2019-2031
- 12.1. Market Analysis, Insights and Forecast - By Country/Sub-region
- 12.1.1 United Kingdom
- 12.1.2 Germany
- 12.1.3 France
- 12.1.4 Rest of Europe
- 13. Asia Pacific APAC Nano Sensors Market Analysis, Insights and Forecast, 2019-2031
- 13.1. Market Analysis, Insights and Forecast - By Country/Sub-region
- 13.1.1 China
- 13.1.2 India
- 13.1.3 Japan
- 13.1.4 Rest of Asia Pacific
- 14. Rest of the World APAC Nano Sensors Market Analysis, Insights and Forecast, 2019-2031
- 14.1. Market Analysis, Insights and Forecast - By Country/Sub-region
- 14.1.1 Latin America
- 14.1.2 Middle East and Africa
- 15. Competitive Analysis
- 15.1. Global Market Share Analysis 2024
- 15.2. Company Profiles
- 15.2.1 Honeywell International Inc
- 15.2.1.1. Overview
- 15.2.1.2. Products
- 15.2.1.3. SWOT Analysis
- 15.2.1.4. Recent Developments
- 15.2.1.5. Financials (Based on Availability)
- 15.2.2 Toshiba Corp
- 15.2.2.1. Overview
- 15.2.2.2. Products
- 15.2.2.3. SWOT Analysis
- 15.2.2.4. Recent Developments
- 15.2.2.5. Financials (Based on Availability)
- 15.2.3 STMicroelectronics
- 15.2.3.1. Overview
- 15.2.3.2. Products
- 15.2.3.3. SWOT Analysis
- 15.2.3.4. Recent Developments
- 15.2.3.5. Financials (Based on Availability)
- 15.2.4 Nippon Denso Corp
- 15.2.4.1. Overview
- 15.2.4.2. Products
- 15.2.4.3. SWOT Analysis
- 15.2.4.4. Recent Developments
- 15.2.4.5. Financials (Based on Availability)
- 15.2.5 OMRON Corporation
- 15.2.5.1. Overview
- 15.2.5.2. Products
- 15.2.5.3. SWOT Analysis
- 15.2.5.4. Recent Developments
- 15.2.5.5. Financials (Based on Availability)
- 15.2.6 Analog Devices Inc
- 15.2.6.1. Overview
- 15.2.6.2. Products
- 15.2.6.3. SWOT Analysis
- 15.2.6.4. Recent Developments
- 15.2.6.5. Financials (Based on Availability)
- 15.2.7 Teledyne Technologies
- 15.2.7.1. Overview
- 15.2.7.2. Products
- 15.2.7.3. SWOT Analysis
- 15.2.7.4. Recent Developments
- 15.2.7.5. Financials (Based on Availability)
- 15.2.8 Agilent Technologies
- 15.2.8.1. Overview
- 15.2.8.2. Products
- 15.2.8.3. SWOT Analysis
- 15.2.8.4. Recent Developments
- 15.2.8.5. Financials (Based on Availability)
- 15.2.9 Samsung Electronics co Limited
- 15.2.9.1. Overview
- 15.2.9.2. Products
- 15.2.9.3. SWOT Analysis
- 15.2.9.4. Recent Developments
- 15.2.9.5. Financials (Based on Availability)
- 15.2.1 Honeywell International Inc
List of Figures
- Figure 1: Global APAC Nano Sensors Market Revenue Breakdown (Million, %) by Region 2024 & 2032
- Figure 2: Global APAC Nano Sensors Market Volume Breakdown (cubic micrometers, %) by Region 2024 & 2032
- Figure 3: North America APAC Nano Sensors Market Revenue (Million), by Country 2024 & 2032
- Figure 4: North America APAC Nano Sensors Market Volume (cubic micrometers), by Country 2024 & 2032
- Figure 5: North America APAC Nano Sensors Market Revenue Share (%), by Country 2024 & 2032
- Figure 6: North America APAC Nano Sensors Market Volume Share (%), by Country 2024 & 2032
- Figure 7: Europe APAC Nano Sensors Market Revenue (Million), by Country 2024 & 2032
- Figure 8: Europe APAC Nano Sensors Market Volume (cubic micrometers), by Country 2024 & 2032
- Figure 9: Europe APAC Nano Sensors Market Revenue Share (%), by Country 2024 & 2032
- Figure 10: Europe APAC Nano Sensors Market Volume Share (%), by Country 2024 & 2032
- Figure 11: Asia Pacific APAC Nano Sensors Market Revenue (Million), by Country 2024 & 2032
- Figure 12: Asia Pacific APAC Nano Sensors Market Volume (cubic micrometers), by Country 2024 & 2032
- Figure 13: Asia Pacific APAC Nano Sensors Market Revenue Share (%), by Country 2024 & 2032
- Figure 14: Asia Pacific APAC Nano Sensors Market Volume Share (%), by Country 2024 & 2032
- Figure 15: Rest of the World APAC Nano Sensors Market Revenue (Million), by Country 2024 & 2032
- Figure 16: Rest of the World APAC Nano Sensors Market Volume (cubic micrometers), by Country 2024 & 2032
- Figure 17: Rest of the World APAC Nano Sensors Market Revenue Share (%), by Country 2024 & 2032
- Figure 18: Rest of the World APAC Nano Sensors Market Volume Share (%), by Country 2024 & 2032
- Figure 19: North America APAC Nano Sensors Market Revenue (Million), by Type 2024 & 2032
- Figure 20: North America APAC Nano Sensors Market Volume (cubic micrometers), by Type 2024 & 2032
- Figure 21: North America APAC Nano Sensors Market Revenue Share (%), by Type 2024 & 2032
- Figure 22: North America APAC Nano Sensors Market Volume Share (%), by Type 2024 & 2032
- Figure 23: North America APAC Nano Sensors Market Revenue (Million), by End-User Industry 2024 & 2032
- Figure 24: North America APAC Nano Sensors Market Volume (cubic micrometers), by End-User Industry 2024 & 2032
- Figure 25: North America APAC Nano Sensors Market Revenue Share (%), by End-User Industry 2024 & 2032
- Figure 26: North America APAC Nano Sensors Market Volume Share (%), by End-User Industry 2024 & 2032
- Figure 27: North America APAC Nano Sensors Market Revenue (Million), by Country 2024 & 2032
- Figure 28: North America APAC Nano Sensors Market Volume (cubic micrometers), by Country 2024 & 2032
- Figure 29: North America APAC Nano Sensors Market Revenue Share (%), by Country 2024 & 2032
- Figure 30: North America APAC Nano Sensors Market Volume Share (%), by Country 2024 & 2032
- Figure 31: South America APAC Nano Sensors Market Revenue (Million), by Type 2024 & 2032
- Figure 32: South America APAC Nano Sensors Market Volume (cubic micrometers), by Type 2024 & 2032
- Figure 33: South America APAC Nano Sensors Market Revenue Share (%), by Type 2024 & 2032
- Figure 34: South America APAC Nano Sensors Market Volume Share (%), by Type 2024 & 2032
- Figure 35: South America APAC Nano Sensors Market Revenue (Million), by End-User Industry 2024 & 2032
- Figure 36: South America APAC Nano Sensors Market Volume (cubic micrometers), by End-User Industry 2024 & 2032
- Figure 37: South America APAC Nano Sensors Market Revenue Share (%), by End-User Industry 2024 & 2032
- Figure 38: South America APAC Nano Sensors Market Volume Share (%), by End-User Industry 2024 & 2032
- Figure 39: South America APAC Nano Sensors Market Revenue (Million), by Country 2024 & 2032
- Figure 40: South America APAC Nano Sensors Market Volume (cubic micrometers), by Country 2024 & 2032
- Figure 41: South America APAC Nano Sensors Market Revenue Share (%), by Country 2024 & 2032
- Figure 42: South America APAC Nano Sensors Market Volume Share (%), by Country 2024 & 2032
- Figure 43: Europe APAC Nano Sensors Market Revenue (Million), by Type 2024 & 2032
- Figure 44: Europe APAC Nano Sensors Market Volume (cubic micrometers), by Type 2024 & 2032
- Figure 45: Europe APAC Nano Sensors Market Revenue Share (%), by Type 2024 & 2032
- Figure 46: Europe APAC Nano Sensors Market Volume Share (%), by Type 2024 & 2032
- Figure 47: Europe APAC Nano Sensors Market Revenue (Million), by End-User Industry 2024 & 2032
- Figure 48: Europe APAC Nano Sensors Market Volume (cubic micrometers), by End-User Industry 2024 & 2032
- Figure 49: Europe APAC Nano Sensors Market Revenue Share (%), by End-User Industry 2024 & 2032
- Figure 50: Europe APAC Nano Sensors Market Volume Share (%), by End-User Industry 2024 & 2032
- Figure 51: Europe APAC Nano Sensors Market Revenue (Million), by Country 2024 & 2032
- Figure 52: Europe APAC Nano Sensors Market Volume (cubic micrometers), by Country 2024 & 2032
- Figure 53: Europe APAC Nano Sensors Market Revenue Share (%), by Country 2024 & 2032
- Figure 54: Europe APAC Nano Sensors Market Volume Share (%), by Country 2024 & 2032
- Figure 55: Middle East & Africa APAC Nano Sensors Market Revenue (Million), by Type 2024 & 2032
- Figure 56: Middle East & Africa APAC Nano Sensors Market Volume (cubic micrometers), by Type 2024 & 2032
- Figure 57: Middle East & Africa APAC Nano Sensors Market Revenue Share (%), by Type 2024 & 2032
- Figure 58: Middle East & Africa APAC Nano Sensors Market Volume Share (%), by Type 2024 & 2032
- Figure 59: Middle East & Africa APAC Nano Sensors Market Revenue (Million), by End-User Industry 2024 & 2032
- Figure 60: Middle East & Africa APAC Nano Sensors Market Volume (cubic micrometers), by End-User Industry 2024 & 2032
- Figure 61: Middle East & Africa APAC Nano Sensors Market Revenue Share (%), by End-User Industry 2024 & 2032
- Figure 62: Middle East & Africa APAC Nano Sensors Market Volume Share (%), by End-User Industry 2024 & 2032
- Figure 63: Middle East & Africa APAC Nano Sensors Market Revenue (Million), by Country 2024 & 2032
- Figure 64: Middle East & Africa APAC Nano Sensors Market Volume (cubic micrometers), by Country 2024 & 2032
- Figure 65: Middle East & Africa APAC Nano Sensors Market Revenue Share (%), by Country 2024 & 2032
- Figure 66: Middle East & Africa APAC Nano Sensors Market Volume Share (%), by Country 2024 & 2032
- Figure 67: Asia Pacific APAC Nano Sensors Market Revenue (Million), by Type 2024 & 2032
- Figure 68: Asia Pacific APAC Nano Sensors Market Volume (cubic micrometers), by Type 2024 & 2032
- Figure 69: Asia Pacific APAC Nano Sensors Market Revenue Share (%), by Type 2024 & 2032
- Figure 70: Asia Pacific APAC Nano Sensors Market Volume Share (%), by Type 2024 & 2032
- Figure 71: Asia Pacific APAC Nano Sensors Market Revenue (Million), by End-User Industry 2024 & 2032
- Figure 72: Asia Pacific APAC Nano Sensors Market Volume (cubic micrometers), by End-User Industry 2024 & 2032
- Figure 73: Asia Pacific APAC Nano Sensors Market Revenue Share (%), by End-User Industry 2024 & 2032
- Figure 74: Asia Pacific APAC Nano Sensors Market Volume Share (%), by End-User Industry 2024 & 2032
- Figure 75: Asia Pacific APAC Nano Sensors Market Revenue (Million), by Country 2024 & 2032
- Figure 76: Asia Pacific APAC Nano Sensors Market Volume (cubic micrometers), by Country 2024 & 2032
- Figure 77: Asia Pacific APAC Nano Sensors Market Revenue Share (%), by Country 2024 & 2032
- Figure 78: Asia Pacific APAC Nano Sensors Market Volume Share (%), by Country 2024 & 2032
List of Tables
- Table 1: Global APAC Nano Sensors Market Revenue Million Forecast, by Region 2019 & 2032
- Table 2: Global APAC Nano Sensors Market Volume cubic micrometers Forecast, by Region 2019 & 2032
- Table 3: Global APAC Nano Sensors Market Revenue Million Forecast, by Type 2019 & 2032
- Table 4: Global APAC Nano Sensors Market Volume cubic micrometers Forecast, by Type 2019 & 2032
- Table 5: Global APAC Nano Sensors Market Revenue Million Forecast, by End-User Industry 2019 & 2032
- Table 6: Global APAC Nano Sensors Market Volume cubic micrometers Forecast, by End-User Industry 2019 & 2032
- Table 7: Global APAC Nano Sensors Market Revenue Million Forecast, by Region 2019 & 2032
- Table 8: Global APAC Nano Sensors Market Volume cubic micrometers Forecast, by Region 2019 & 2032
- Table 9: Global APAC Nano Sensors Market Revenue Million Forecast, by Country 2019 & 2032
- Table 10: Global APAC Nano Sensors Market Volume cubic micrometers Forecast, by Country 2019 & 2032
- Table 11: United States APAC Nano Sensors Market Revenue (Million) Forecast, by Application 2019 & 2032
- Table 12: United States APAC Nano Sensors Market Volume (cubic micrometers) Forecast, by Application 2019 & 2032
- Table 13: Canada APAC Nano Sensors Market Revenue (Million) Forecast, by Application 2019 & 2032
- Table 14: Canada APAC Nano Sensors Market Volume (cubic micrometers) Forecast, by Application 2019 & 2032
- Table 15: Global APAC Nano Sensors Market Revenue Million Forecast, by Country 2019 & 2032
- Table 16: Global APAC Nano Sensors Market Volume cubic micrometers Forecast, by Country 2019 & 2032
- Table 17: United Kingdom APAC Nano Sensors Market Revenue (Million) Forecast, by Application 2019 & 2032
- Table 18: United Kingdom APAC Nano Sensors Market Volume (cubic micrometers) Forecast, by Application 2019 & 2032
- Table 19: Germany APAC Nano Sensors Market Revenue (Million) Forecast, by Application 2019 & 2032
- Table 20: Germany APAC Nano Sensors Market Volume (cubic micrometers) Forecast, by Application 2019 & 2032
- Table 21: France APAC Nano Sensors Market Revenue (Million) Forecast, by Application 2019 & 2032
- Table 22: France APAC Nano Sensors Market Volume (cubic micrometers) Forecast, by Application 2019 & 2032
- Table 23: Rest of Europe APAC Nano Sensors Market Revenue (Million) Forecast, by Application 2019 & 2032
- Table 24: Rest of Europe APAC Nano Sensors Market Volume (cubic micrometers) Forecast, by Application 2019 & 2032
- Table 25: Global APAC Nano Sensors Market Revenue Million Forecast, by Country 2019 & 2032
- Table 26: Global APAC Nano Sensors Market Volume cubic micrometers Forecast, by Country 2019 & 2032
- Table 27: China APAC Nano Sensors Market Revenue (Million) Forecast, by Application 2019 & 2032
- Table 28: China APAC Nano Sensors Market Volume (cubic micrometers) Forecast, by Application 2019 & 2032
- Table 29: India APAC Nano Sensors Market Revenue (Million) Forecast, by Application 2019 & 2032
- Table 30: India APAC Nano Sensors Market Volume (cubic micrometers) Forecast, by Application 2019 & 2032
- Table 31: Japan APAC Nano Sensors Market Revenue (Million) Forecast, by Application 2019 & 2032
- Table 32: Japan APAC Nano Sensors Market Volume (cubic micrometers) Forecast, by Application 2019 & 2032
- Table 33: Rest of Asia Pacific APAC Nano Sensors Market Revenue (Million) Forecast, by Application 2019 & 2032
- Table 34: Rest of Asia Pacific APAC Nano Sensors Market Volume (cubic micrometers) Forecast, by Application 2019 & 2032
- Table 35: Global APAC Nano Sensors Market Revenue Million Forecast, by Country 2019 & 2032
- Table 36: Global APAC Nano Sensors Market Volume cubic micrometers Forecast, by Country 2019 & 2032
- Table 37: Latin America APAC Nano Sensors Market Revenue (Million) Forecast, by Application 2019 & 2032
- Table 38: Latin America APAC Nano Sensors Market Volume (cubic micrometers) Forecast, by Application 2019 & 2032
- Table 39: Middle East and Africa APAC Nano Sensors Market Revenue (Million) Forecast, by Application 2019 & 2032
- Table 40: Middle East and Africa APAC Nano Sensors Market Volume (cubic micrometers) Forecast, by Application 2019 & 2032
- Table 41: Global APAC Nano Sensors Market Revenue Million Forecast, by Type 2019 & 2032
- Table 42: Global APAC Nano Sensors Market Volume cubic micrometers Forecast, by Type 2019 & 2032
- Table 43: Global APAC Nano Sensors Market Revenue Million Forecast, by End-User Industry 2019 & 2032
- Table 44: Global APAC Nano Sensors Market Volume cubic micrometers Forecast, by End-User Industry 2019 & 2032
- Table 45: Global APAC Nano Sensors Market Revenue Million Forecast, by Country 2019 & 2032
- Table 46: Global APAC Nano Sensors Market Volume cubic micrometers Forecast, by Country 2019 & 2032
- Table 47: United States APAC Nano Sensors Market Revenue (Million) Forecast, by Application 2019 & 2032
- Table 48: United States APAC Nano Sensors Market Volume (cubic micrometers) Forecast, by Application 2019 & 2032
- Table 49: Canada APAC Nano Sensors Market Revenue (Million) Forecast, by Application 2019 & 2032
- Table 50: Canada APAC Nano Sensors Market Volume (cubic micrometers) Forecast, by Application 2019 & 2032
- Table 51: Mexico APAC Nano Sensors Market Revenue (Million) Forecast, by Application 2019 & 2032
- Table 52: Mexico APAC Nano Sensors Market Volume (cubic micrometers) Forecast, by Application 2019 & 2032
- Table 53: Global APAC Nano Sensors Market Revenue Million Forecast, by Type 2019 & 2032
- Table 54: Global APAC Nano Sensors Market Volume cubic micrometers Forecast, by Type 2019 & 2032
- Table 55: Global APAC Nano Sensors Market Revenue Million Forecast, by End-User Industry 2019 & 2032
- Table 56: Global APAC Nano Sensors Market Volume cubic micrometers Forecast, by End-User Industry 2019 & 2032
- Table 57: Global APAC Nano Sensors Market Revenue Million Forecast, by Country 2019 & 2032
- Table 58: Global APAC Nano Sensors Market Volume cubic micrometers Forecast, by Country 2019 & 2032
- Table 59: Brazil APAC Nano Sensors Market Revenue (Million) Forecast, by Application 2019 & 2032
- Table 60: Brazil APAC Nano Sensors Market Volume (cubic micrometers) Forecast, by Application 2019 & 2032
- Table 61: Argentina APAC Nano Sensors Market Revenue (Million) Forecast, by Application 2019 & 2032
- Table 62: Argentina APAC Nano Sensors Market Volume (cubic micrometers) Forecast, by Application 2019 & 2032
- Table 63: Rest of South America APAC Nano Sensors Market Revenue (Million) Forecast, by Application 2019 & 2032
- Table 64: Rest of South America APAC Nano Sensors Market Volume (cubic micrometers) Forecast, by Application 2019 & 2032
- Table 65: Global APAC Nano Sensors Market Revenue Million Forecast, by Type 2019 & 2032
- Table 66: Global APAC Nano Sensors Market Volume cubic micrometers Forecast, by Type 2019 & 2032
- Table 67: Global APAC Nano Sensors Market Revenue Million Forecast, by End-User Industry 2019 & 2032
- Table 68: Global APAC Nano Sensors Market Volume cubic micrometers Forecast, by End-User Industry 2019 & 2032
- Table 69: Global APAC Nano Sensors Market Revenue Million Forecast, by Country 2019 & 2032
- Table 70: Global APAC Nano Sensors Market Volume cubic micrometers Forecast, by Country 2019 & 2032
- Table 71: United Kingdom APAC Nano Sensors Market Revenue (Million) Forecast, by Application 2019 & 2032
- Table 72: United Kingdom APAC Nano Sensors Market Volume (cubic micrometers) Forecast, by Application 2019 & 2032
- Table 73: Germany APAC Nano Sensors Market Revenue (Million) Forecast, by Application 2019 & 2032
- Table 74: Germany APAC Nano Sensors Market Volume (cubic micrometers) Forecast, by Application 2019 & 2032
- Table 75: France APAC Nano Sensors Market Revenue (Million) Forecast, by Application 2019 & 2032
- Table 76: France APAC Nano Sensors Market Volume (cubic micrometers) Forecast, by Application 2019 & 2032
- Table 77: Italy APAC Nano Sensors Market Revenue (Million) Forecast, by Application 2019 & 2032
- Table 78: Italy APAC Nano Sensors Market Volume (cubic micrometers) Forecast, by Application 2019 & 2032
- Table 79: Spain APAC Nano Sensors Market Revenue (Million) Forecast, by Application 2019 & 2032
- Table 80: Spain APAC Nano Sensors Market Volume (cubic micrometers) Forecast, by Application 2019 & 2032
- Table 81: Russia APAC Nano Sensors Market Revenue (Million) Forecast, by Application 2019 & 2032
- Table 82: Russia APAC Nano Sensors Market Volume (cubic micrometers) Forecast, by Application 2019 & 2032
- Table 83: Benelux APAC Nano Sensors Market Revenue (Million) Forecast, by Application 2019 & 2032
- Table 84: Benelux APAC Nano Sensors Market Volume (cubic micrometers) Forecast, by Application 2019 & 2032
- Table 85: Nordics APAC Nano Sensors Market Revenue (Million) Forecast, by Application 2019 & 2032
- Table 86: Nordics APAC Nano Sensors Market Volume (cubic micrometers) Forecast, by Application 2019 & 2032
- Table 87: Rest of Europe APAC Nano Sensors Market Revenue (Million) Forecast, by Application 2019 & 2032
- Table 88: Rest of Europe APAC Nano Sensors Market Volume (cubic micrometers) Forecast, by Application 2019 & 2032
- Table 89: Global APAC Nano Sensors Market Revenue Million Forecast, by Type 2019 & 2032
- Table 90: Global APAC Nano Sensors Market Volume cubic micrometers Forecast, by Type 2019 & 2032
- Table 91: Global APAC Nano Sensors Market Revenue Million Forecast, by End-User Industry 2019 & 2032
- Table 92: Global APAC Nano Sensors Market Volume cubic micrometers Forecast, by End-User Industry 2019 & 2032
- Table 93: Global APAC Nano Sensors Market Revenue Million Forecast, by Country 2019 & 2032
- Table 94: Global APAC Nano Sensors Market Volume cubic micrometers Forecast, by Country 2019 & 2032
- Table 95: Turkey APAC Nano Sensors Market Revenue (Million) Forecast, by Application 2019 & 2032
- Table 96: Turkey APAC Nano Sensors Market Volume (cubic micrometers) Forecast, by Application 2019 & 2032
- Table 97: Israel APAC Nano Sensors Market Revenue (Million) Forecast, by Application 2019 & 2032
- Table 98: Israel APAC Nano Sensors Market Volume (cubic micrometers) Forecast, by Application 2019 & 2032
- Table 99: GCC APAC Nano Sensors Market Revenue (Million) Forecast, by Application 2019 & 2032
- Table 100: GCC APAC Nano Sensors Market Volume (cubic micrometers) Forecast, by Application 2019 & 2032
- Table 101: North Africa APAC Nano Sensors Market Revenue (Million) Forecast, by Application 2019 & 2032
- Table 102: North Africa APAC Nano Sensors Market Volume (cubic micrometers) Forecast, by Application 2019 & 2032
- Table 103: South Africa APAC Nano Sensors Market Revenue (Million) Forecast, by Application 2019 & 2032
- Table 104: South Africa APAC Nano Sensors Market Volume (cubic micrometers) Forecast, by Application 2019 & 2032
- Table 105: Rest of Middle East & Africa APAC Nano Sensors Market Revenue (Million) Forecast, by Application 2019 & 2032
- Table 106: Rest of Middle East & Africa APAC Nano Sensors Market Volume (cubic micrometers) Forecast, by Application 2019 & 2032
- Table 107: Global APAC Nano Sensors Market Revenue Million Forecast, by Type 2019 & 2032
- Table 108: Global APAC Nano Sensors Market Volume cubic micrometers Forecast, by Type 2019 & 2032
- Table 109: Global APAC Nano Sensors Market Revenue Million Forecast, by End-User Industry 2019 & 2032
- Table 110: Global APAC Nano Sensors Market Volume cubic micrometers Forecast, by End-User Industry 2019 & 2032
- Table 111: Global APAC Nano Sensors Market Revenue Million Forecast, by Country 2019 & 2032
- Table 112: Global APAC Nano Sensors Market Volume cubic micrometers Forecast, by Country 2019 & 2032
- Table 113: China APAC Nano Sensors Market Revenue (Million) Forecast, by Application 2019 & 2032
- Table 114: China APAC Nano Sensors Market Volume (cubic micrometers) Forecast, by Application 2019 & 2032
- Table 115: India APAC Nano Sensors Market Revenue (Million) Forecast, by Application 2019 & 2032
- Table 116: India APAC Nano Sensors Market Volume (cubic micrometers) Forecast, by Application 2019 & 2032
- Table 117: Japan APAC Nano Sensors Market Revenue (Million) Forecast, by Application 2019 & 2032
- Table 118: Japan APAC Nano Sensors Market Volume (cubic micrometers) Forecast, by Application 2019 & 2032
- Table 119: South Korea APAC Nano Sensors Market Revenue (Million) Forecast, by Application 2019 & 2032
- Table 120: South Korea APAC Nano Sensors Market Volume (cubic micrometers) Forecast, by Application 2019 & 2032
- Table 121: ASEAN APAC Nano Sensors Market Revenue (Million) Forecast, by Application 2019 & 2032
- Table 122: ASEAN APAC Nano Sensors Market Volume (cubic micrometers) Forecast, by Application 2019 & 2032
- Table 123: Oceania APAC Nano Sensors Market Revenue (Million) Forecast, by Application 2019 & 2032
- Table 124: Oceania APAC Nano Sensors Market Volume (cubic micrometers) Forecast, by Application 2019 & 2032
- Table 125: Rest of Asia Pacific APAC Nano Sensors Market Revenue (Million) Forecast, by Application 2019 & 2032
- Table 126: Rest of Asia Pacific APAC Nano Sensors Market Volume (cubic micrometers) Forecast, by Application 2019 & 2032
Frequently Asked Questions
1. What is the projected Compound Annual Growth Rate (CAGR) of the APAC Nano Sensors Market?
The projected CAGR is approximately 67.58%.
2. Which companies are prominent players in the APAC Nano Sensors Market?
Key companies in the market include Honeywell International Inc, Toshiba Corp, STMicroelectronics, Nippon Denso Corp, OMRON Corporation, Analog Devices Inc, Teledyne Technologies, Agilent Technologies, Samsung Electronics co Limited.
3. What are the main segments of the APAC Nano Sensors Market?
The market segments include Type, End-User Industry.
4. Can you provide details about the market size?
The market size is estimated to be USD XX Million as of 2022.
5. What are some drivers contributing to market growth?
Increasing Trend of Miniaturization and Use of Miniaturized Products Across Various Industries; Increasing research and development in innovative materials.
6. What are the notable trends driving market growth?
The electrochemical segment is expected to command prominent share over the forecasted period.
7. Are there any restraints impacting market growth?
Complexity in Manufacturing Nanosensors.
8. Can you provide examples of recent developments in the market?
Sept 2021 - Omron provides on-site DX acceleration simulation software that includes control hardware from a partner company. Sysmac Studio 3D Simulation software is going to be available worldwide and can digitally recreate the entire facility using the integrated robot controller. The software allows customers to simulate the machine, including their own robots and partners' equipment.
9. What pricing options are available for accessing the report?
Pricing options include single-user, multi-user, and enterprise licenses priced at USD 3800, USD 4500, and USD 5800 respectively.
10. Is the market size provided in terms of value or volume?
The market size is provided in terms of value, measured in Million and volume, measured in cubic micrometers.
11. Are there any specific market keywords associated with the report?
Yes, the market keyword associated with the report is "APAC Nano Sensors Market," which aids in identifying and referencing the specific market segment covered.
12. How do I determine which pricing option suits my needs best?
The pricing options vary based on user requirements and access needs. Individual users may opt for single-user licenses, while businesses requiring broader access may choose multi-user or enterprise licenses for cost-effective access to the report.
13. Are there any additional resources or data provided in the APAC Nano Sensors Market report?
While the report offers comprehensive insights, it's advisable to review the specific contents or supplementary materials provided to ascertain if additional resources or data are available.
14. How can I stay updated on further developments or reports in the APAC Nano Sensors Market?
To stay informed about further developments, trends, and reports in the APAC Nano Sensors Market, consider subscribing to industry newsletters, following relevant companies and organizations, or regularly checking reputable industry news sources and publications.
Methodology
Step 1 - Identification of Relevant Samples Size from Population Database


Step 2 - Approaches for Defining Global Market Size (Value, Volume* & Price*)

Note*: In applicable scenarios
Step 3 - Data Sources
Primary Research
- Web Analytics
- Survey Reports
- Research Institute
- Latest Research Reports
- Opinion Leaders
Secondary Research
- Annual Reports
- White Paper
- Latest Press Release
- Industry Association
- Paid Database
- Investor Presentations

Step 4 - Data Triangulation
Involves using different sources of information in order to increase the validity of a study
These sources are likely to be stakeholders in a program - participants, other researchers, program staff, other community members, and so on.
Then we put all data in single framework & apply various statistical tools to find out the dynamic on the market.
During the analysis stage, feedback from the stakeholder groups would be compared to determine areas of agreement as well as areas of divergence
