

Key Insights
The Asia-Pacific (APAC) starch derivative market is experiencing robust growth, driven by expanding food and beverage industries, increasing demand for bio-based products, and a rising population. The region's diverse agricultural landscape, particularly in countries like China, India, and Indonesia, provides a substantial supply of raw materials such as corn, wheat, and cassava, fueling the production of starch derivatives. The food and beverage sector remains the dominant application segment, with maltodextrin and glucose syrups being the most widely used starch derivatives due to their functional properties as thickeners, sweeteners, and stabilizers. However, the pharmaceutical and cosmetic industries are emerging as significant growth drivers, with increasing demand for cyclodextrins and modified starches in drug delivery systems and personal care products. While the market faces some challenges, such as fluctuations in raw material prices and stringent regulatory compliance, these are mitigated by the overall positive growth trajectory and the continuous development of innovative starch derivative applications.
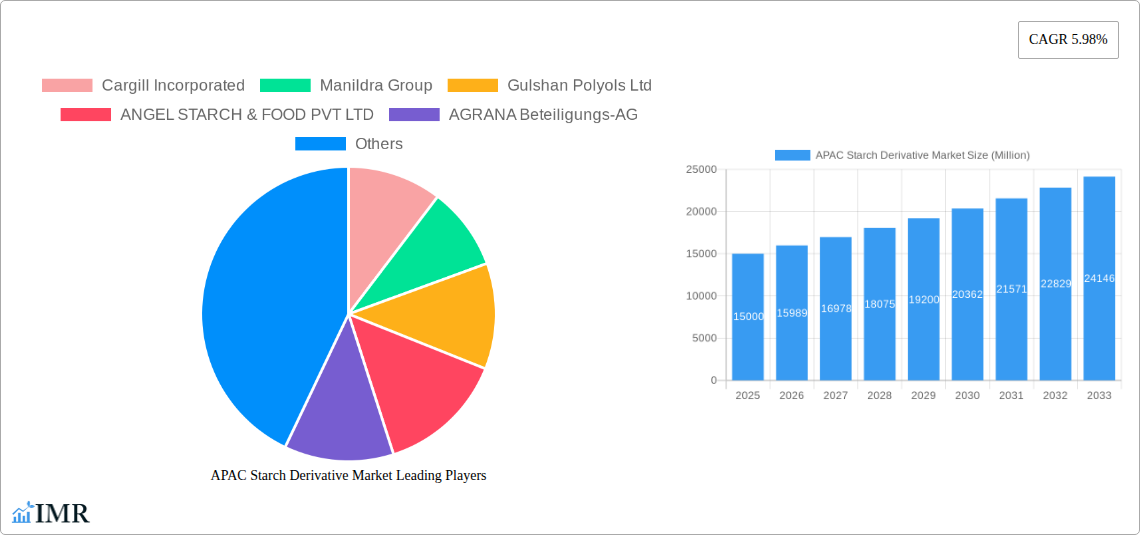
Growth is further amplified by rising disposable incomes and changing consumer preferences towards convenience foods and processed products. The market is also witnessing a shift towards sustainable and eco-friendly ingredients, boosting the demand for starch derivatives as a renewable alternative to synthetic polymers. Significant investments in research and development are focusing on enhancing the functionality and applications of starch derivatives, leading to the emergence of specialized products tailored to specific industry requirements. This innovation, coupled with the strategic expansions and partnerships of key players like Cargill Incorporated and Ingredion Incorporated, will further consolidate the APAC starch derivative market's position as a major global player in the coming years. The projected CAGR of 5.98% suggests a significant expansion of market value within the forecast period of 2025-2033.
APAC Starch Derivative Market: A Comprehensive Market Report (2019-2033)
This comprehensive report provides an in-depth analysis of the Asia-Pacific (APAC) starch derivative market, encompassing market dynamics, growth trends, regional segmentation, product landscape, and key players. The study period covers 2019-2033, with 2025 as the base and estimated year. The report segments the market by application (Food and Beverage, Feed, Paper Industry, Pharmaceutical Industry, Bioethanol, Cosmetics, Others), type (Maltodextrin, Cyclodextrin, Glucose Syrups, Hydrolysates, Modified Starch, Others), and source (Corn, Wheat, Cassava, Potato, Others). Key market players such as Cargill Incorporated, Manildra Group, Gulshan Polyols Ltd, ANGEL STARCH & FOOD PVT LTD, AGRANA Beteiligungs-AG, Tate & Lyle PLC, JAPAN CORN STARCH CO LTD, and Ingredion Incorporated are profiled. The market size is projected in Million units.
APAC Starch Derivative Market Dynamics & Structure
The APAC starch derivative market is characterized by a moderately concentrated landscape, with a few large multinational corporations holding significant market share. Technological innovation, particularly in modified starches with enhanced functionalities, is a key driver. Stringent regulatory frameworks concerning food safety and environmental impact influence market practices. Competitive substitutes, including synthetic polymers and other natural hydrocolloids, pose a challenge. End-user demographics, particularly the growing middle class and changing dietary preferences, are shaping market demand. M&A activity is relatively frequent, driven by companies seeking to expand their product portfolios and geographic reach.
- Market Concentration: The top 5 players hold approximately xx% of the market share in 2025.
- Technological Innovation: Focus on developing sustainable and high-performance starch derivatives is driving innovation.
- Regulatory Framework: Compliance with food safety and labeling regulations is crucial.
- Competitive Substitutes: Synthetic polymers and other natural hydrocolloids present competition.
- M&A Activity: An average of xx M&A deals have been recorded annually in the past five years.
- Innovation Barriers: High R&D costs and complex regulatory approvals hinder innovation.
APAC Starch Derivative Market Growth Trends & Insights
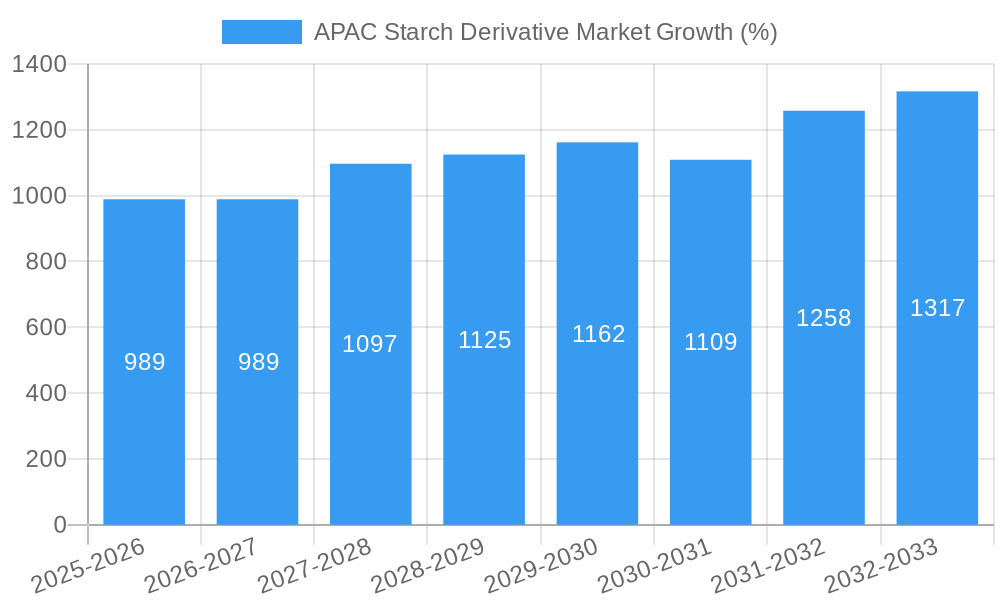
The APAC starch derivative market witnessed robust growth during the historical period (2019-2024), driven by factors such as rising demand from the food and beverage industry, increasing consumption of processed food, and expanding biofuel production. The market is projected to continue its growth trajectory during the forecast period (2025-2033), with a Compound Annual Growth Rate (CAGR) of xx%. Technological advancements, such as enzyme technology for producing modified starches, are further boosting market expansion. Consumer preference shifts towards healthier and more convenient food products are driving demand for specific starch derivatives. The adoption rate of modified starches in various applications, particularly in the food and pharmaceutical sectors, is increasing steadily. Disruptive technologies such as precision fermentation are expected to create new opportunities in the coming years.
Dominant Regions, Countries, or Segments in APAC Starch Derivative Market
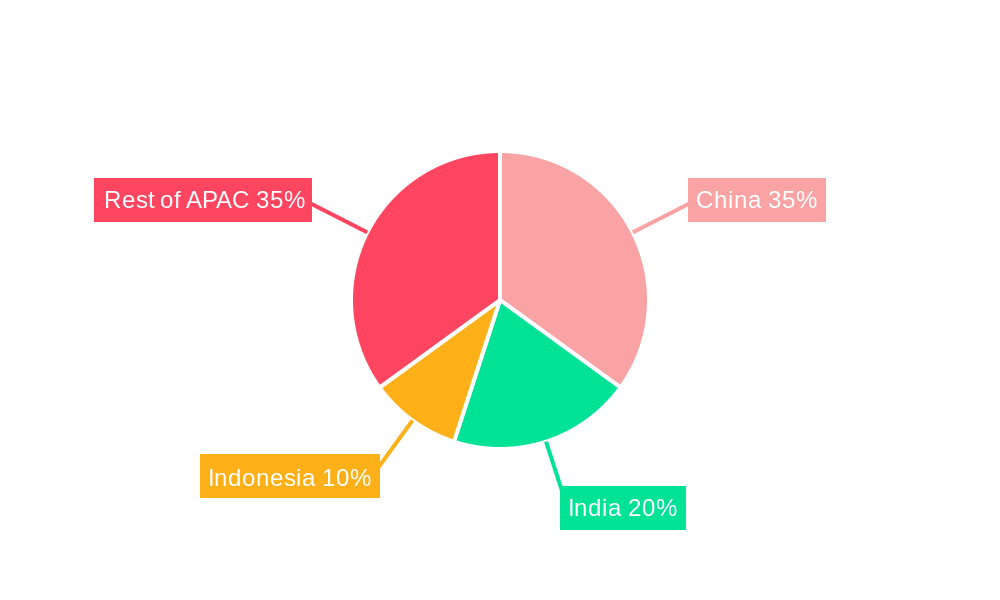
China and India dominate the APAC starch derivative market, driven by factors such as large populations, rapidly expanding food processing industries, and robust economic growth. Within applications, the food and beverage sector accounts for the largest market share, followed by the feed industry. The maltodextrin segment leads in terms of type, owing to its wide range of applications. Corn is the primary source of starch derivatives, due to its cost-effectiveness and availability.
- Key Drivers in China: High demand from food & beverage industry, government support for biofuel production.
- Key Drivers in India: Growing middle class with changing dietary habits, increasing demand for processed food.
- Food & Beverage Segment: High growth due to increasing consumption of processed food and beverages.
- Maltodextrin Segment: Largest market share by type due to its versatile applications.
- Corn Source: Dominates due to cost-effectiveness and availability.
APAC Starch Derivative Market Product Landscape
The APAC starch derivative market offers a diverse range of products, including various types of modified starches, glucose syrups, and cyclodextrins. These products cater to diverse applications, exhibiting unique functionalities and performance metrics tailored to specific industry needs. Recent innovations focus on developing starches with enhanced properties such as improved texture, stability, and digestibility. The incorporation of novel functionalities, such as controlled release capabilities and enhanced water binding, is expanding product applications and creating new market opportunities.
Key Drivers, Barriers & Challenges in APAP Starch Derivative Market
Key Drivers: Rising demand from food & beverage industry; growth in biofuel production; increasing disposable incomes; technological advancements in modified starch production.
Key Challenges: Fluctuations in raw material prices; stringent regulatory compliance requirements; intense competition from synthetic polymers; supply chain disruptions impacting availability and cost. The impact of these challenges is estimated to reduce the market growth by approximately xx% annually.
Emerging Opportunities in APAC Starch Derivative Market
Untapped markets in Southeast Asia offer significant growth potential. Innovative applications in areas such as biodegradable plastics and pharmaceuticals are emerging. Growing consumer awareness of health and wellness is driving demand for functional starch derivatives. The use of starch derivatives in sustainable packaging solutions is also gaining traction.
Growth Accelerators in the APAC Starch Derivative Market Industry
Technological breakthroughs in enzyme technology and precision fermentation are accelerating growth. Strategic partnerships between starch producers and downstream users are fostering innovation and market expansion. Expansion into new geographic markets and diversifying product portfolios are vital strategies for sustained growth.
Key Players Shaping the APAC Starch Derivative Market Market
- Cargill Incorporated
- Manildra Group
- Gulshan Polyols Ltd
- ANGEL STARCH & FOOD PVT LTD
- AGRANA Beteiligungs-AG
- Tate & Lyle PLC
- JAPAN CORN STARCH CO LTD
- Ingredion Incorporated
Notable Milestones in APAC Starch Derivative Market Sector
- 2022 Q3: Cargill Incorporated acquired a smaller starch producer in Vietnam, expanding its market presence.
- 2021 Q4: Ingredion Incorporated partnered with a local distributor to enhance its product distribution network in Indonesia.
- 2020 Q1: Tate & Lyle PLC invested in R&D to develop novel, high-performance starches for the food industry.
In-Depth APAC Starch Derivative Market Market Outlook
The APAC starch derivative market is poised for continued robust growth, driven by the factors outlined above. Strategic investments in R&D, innovative product development, and strategic partnerships will be key to capturing market share and achieving sustained success. The market presents significant opportunities for both established players and new entrants, particularly in emerging markets and niche applications. The long-term growth trajectory is optimistic, with potential for significant expansion in the next decade.
APAC Starch Derivative Market Segmentation
-
1. Type
- 1.1. Maltodextrin
- 1.2. Cyclodextrin
- 1.3. Glucose Syrups
- 1.4. Hydrolysates
- 1.5. Modified Starch
- 1.6. Others
-
2. Source
- 2.1. Corn
- 2.2. Wheat
- 2.3. Cassava
- 2.4. Potato
- 2.5. Others
-
3. Application
- 3.1. Food and Beverage
- 3.2. Feed
- 3.3. Paper Industry
- 3.4. Pharmaceutical Industry
- 3.5. Bioethanol
- 3.6. Cosmetics
- 3.7. Others
-
4. Geography
- 4.1. China
- 4.2. Japan
- 4.3. India
- 4.4. Australia
- 4.5. Rest of Asia-Pacific
APAC Starch Derivative Market Segmentation By Geography
- 1. China
- 2. Japan
- 3. India
- 4. Australia
- 5. Rest of Asia Pacific
APAC Starch Derivative Market REPORT HIGHLIGHTS
| Aspects | Details |
|---|---|
| Study Period | 2019-2033 |
| Base Year | 2024 |
| Estimated Year | 2025 |
| Forecast Period | 2025-2033 |
| Historical Period | 2019-2024 |
| Growth Rate | CAGR of 5.98% from 2019-2033 |
| Segmentation |
|
Table of Contents
- 1. Introduction
- 1.1. Research Scope
- 1.2. Market Segmentation
- 1.3. Research Methodology
- 1.4. Definitions and Assumptions
- 2. Executive Summary
- 2.1. Introduction
- 3. Market Dynamics
- 3.1. Introduction
- 3.2. Market Drivers
- 3.2.1. Wide Applications and Functionality; Demand For Gluten-Free Products
- 3.3. Market Restrains
- 3.3.1. Easy Availability of Economically Feasible Alternatives
- 3.4. Market Trends
- 3.4.1. Textile Industry
- 4. Market Factor Analysis
- 4.1. Porters Five Forces
- 4.2. Supply/Value Chain
- 4.3. PESTEL analysis
- 4.4. Market Entropy
- 4.5. Patent/Trademark Analysis
- 5. Global APAC Starch Derivative Market Analysis, Insights and Forecast, 2019-2031
- 5.1. Market Analysis, Insights and Forecast - by Type
- 5.1.1. Maltodextrin
- 5.1.2. Cyclodextrin
- 5.1.3. Glucose Syrups
- 5.1.4. Hydrolysates
- 5.1.5. Modified Starch
- 5.1.6. Others
- 5.2. Market Analysis, Insights and Forecast - by Source
- 5.2.1. Corn
- 5.2.2. Wheat
- 5.2.3. Cassava
- 5.2.4. Potato
- 5.2.5. Others
- 5.3. Market Analysis, Insights and Forecast - by Application
- 5.3.1. Food and Beverage
- 5.3.2. Feed
- 5.3.3. Paper Industry
- 5.3.4. Pharmaceutical Industry
- 5.3.5. Bioethanol
- 5.3.6. Cosmetics
- 5.3.7. Others
- 5.4. Market Analysis, Insights and Forecast - by Geography
- 5.4.1. China
- 5.4.2. Japan
- 5.4.3. India
- 5.4.4. Australia
- 5.4.5. Rest of Asia-Pacific
- 5.5. Market Analysis, Insights and Forecast - by Region
- 5.5.1. China
- 5.5.2. Japan
- 5.5.3. India
- 5.5.4. Australia
- 5.5.5. Rest of Asia Pacific
- 5.1. Market Analysis, Insights and Forecast - by Type
- 6. China APAC Starch Derivative Market Analysis, Insights and Forecast, 2019-2031
- 6.1. Market Analysis, Insights and Forecast - by Type
- 6.1.1. Maltodextrin
- 6.1.2. Cyclodextrin
- 6.1.3. Glucose Syrups
- 6.1.4. Hydrolysates
- 6.1.5. Modified Starch
- 6.1.6. Others
- 6.2. Market Analysis, Insights and Forecast - by Source
- 6.2.1. Corn
- 6.2.2. Wheat
- 6.2.3. Cassava
- 6.2.4. Potato
- 6.2.5. Others
- 6.3. Market Analysis, Insights and Forecast - by Application
- 6.3.1. Food and Beverage
- 6.3.2. Feed
- 6.3.3. Paper Industry
- 6.3.4. Pharmaceutical Industry
- 6.3.5. Bioethanol
- 6.3.6. Cosmetics
- 6.3.7. Others
- 6.4. Market Analysis, Insights and Forecast - by Geography
- 6.4.1. China
- 6.4.2. Japan
- 6.4.3. India
- 6.4.4. Australia
- 6.4.5. Rest of Asia-Pacific
- 6.1. Market Analysis, Insights and Forecast - by Type
- 7. Japan APAC Starch Derivative Market Analysis, Insights and Forecast, 2019-2031
- 7.1. Market Analysis, Insights and Forecast - by Type
- 7.1.1. Maltodextrin
- 7.1.2. Cyclodextrin
- 7.1.3. Glucose Syrups
- 7.1.4. Hydrolysates
- 7.1.5. Modified Starch
- 7.1.6. Others
- 7.2. Market Analysis, Insights and Forecast - by Source
- 7.2.1. Corn
- 7.2.2. Wheat
- 7.2.3. Cassava
- 7.2.4. Potato
- 7.2.5. Others
- 7.3. Market Analysis, Insights and Forecast - by Application
- 7.3.1. Food and Beverage
- 7.3.2. Feed
- 7.3.3. Paper Industry
- 7.3.4. Pharmaceutical Industry
- 7.3.5. Bioethanol
- 7.3.6. Cosmetics
- 7.3.7. Others
- 7.4. Market Analysis, Insights and Forecast - by Geography
- 7.4.1. China
- 7.4.2. Japan
- 7.4.3. India
- 7.4.4. Australia
- 7.4.5. Rest of Asia-Pacific
- 7.1. Market Analysis, Insights and Forecast - by Type
- 8. India APAC Starch Derivative Market Analysis, Insights and Forecast, 2019-2031
- 8.1. Market Analysis, Insights and Forecast - by Type
- 8.1.1. Maltodextrin
- 8.1.2. Cyclodextrin
- 8.1.3. Glucose Syrups
- 8.1.4. Hydrolysates
- 8.1.5. Modified Starch
- 8.1.6. Others
- 8.2. Market Analysis, Insights and Forecast - by Source
- 8.2.1. Corn
- 8.2.2. Wheat
- 8.2.3. Cassava
- 8.2.4. Potato
- 8.2.5. Others
- 8.3. Market Analysis, Insights and Forecast - by Application
- 8.3.1. Food and Beverage
- 8.3.2. Feed
- 8.3.3. Paper Industry
- 8.3.4. Pharmaceutical Industry
- 8.3.5. Bioethanol
- 8.3.6. Cosmetics
- 8.3.7. Others
- 8.4. Market Analysis, Insights and Forecast - by Geography
- 8.4.1. China
- 8.4.2. Japan
- 8.4.3. India
- 8.4.4. Australia
- 8.4.5. Rest of Asia-Pacific
- 8.1. Market Analysis, Insights and Forecast - by Type
- 9. Australia APAC Starch Derivative Market Analysis, Insights and Forecast, 2019-2031
- 9.1. Market Analysis, Insights and Forecast - by Type
- 9.1.1. Maltodextrin
- 9.1.2. Cyclodextrin
- 9.1.3. Glucose Syrups
- 9.1.4. Hydrolysates
- 9.1.5. Modified Starch
- 9.1.6. Others
- 9.2. Market Analysis, Insights and Forecast - by Source
- 9.2.1. Corn
- 9.2.2. Wheat
- 9.2.3. Cassava
- 9.2.4. Potato
- 9.2.5. Others
- 9.3. Market Analysis, Insights and Forecast - by Application
- 9.3.1. Food and Beverage
- 9.3.2. Feed
- 9.3.3. Paper Industry
- 9.3.4. Pharmaceutical Industry
- 9.3.5. Bioethanol
- 9.3.6. Cosmetics
- 9.3.7. Others
- 9.4. Market Analysis, Insights and Forecast - by Geography
- 9.4.1. China
- 9.4.2. Japan
- 9.4.3. India
- 9.4.4. Australia
- 9.4.5. Rest of Asia-Pacific
- 9.1. Market Analysis, Insights and Forecast - by Type
- 10. Rest of Asia Pacific APAC Starch Derivative Market Analysis, Insights and Forecast, 2019-2031
- 10.1. Market Analysis, Insights and Forecast - by Type
- 10.1.1. Maltodextrin
- 10.1.2. Cyclodextrin
- 10.1.3. Glucose Syrups
- 10.1.4. Hydrolysates
- 10.1.5. Modified Starch
- 10.1.6. Others
- 10.2. Market Analysis, Insights and Forecast - by Source
- 10.2.1. Corn
- 10.2.2. Wheat
- 10.2.3. Cassava
- 10.2.4. Potato
- 10.2.5. Others
- 10.3. Market Analysis, Insights and Forecast - by Application
- 10.3.1. Food and Beverage
- 10.3.2. Feed
- 10.3.3. Paper Industry
- 10.3.4. Pharmaceutical Industry
- 10.3.5. Bioethanol
- 10.3.6. Cosmetics
- 10.3.7. Others
- 10.4. Market Analysis, Insights and Forecast - by Geography
- 10.4.1. China
- 10.4.2. Japan
- 10.4.3. India
- 10.4.4. Australia
- 10.4.5. Rest of Asia-Pacific
- 10.1. Market Analysis, Insights and Forecast - by Type
- 11. North America APAC Starch Derivative Market Analysis, Insights and Forecast, 2019-2031
- 11.1. Market Analysis, Insights and Forecast - By Country/Sub-region
- 11.1.1 United States
- 11.1.2 Canada
- 11.1.3 Mexico
- 12. Europe APAC Starch Derivative Market Analysis, Insights and Forecast, 2019-2031
- 12.1. Market Analysis, Insights and Forecast - By Country/Sub-region
- 12.1.1 Germany
- 12.1.2 United Kingdom
- 12.1.3 France
- 12.1.4 Spain
- 12.1.5 Italy
- 12.1.6 Spain
- 12.1.7 Belgium
- 12.1.8 Netherland
- 12.1.9 Nordics
- 12.1.10 Rest of Europe
- 13. Asia Pacific APAC Starch Derivative Market Analysis, Insights and Forecast, 2019-2031
- 13.1. Market Analysis, Insights and Forecast - By Country/Sub-region
- 13.1.1 China
- 13.1.2 Japan
- 13.1.3 India
- 13.1.4 South Korea
- 13.1.5 Southeast Asia
- 13.1.6 Australia
- 13.1.7 Indonesia
- 13.1.8 Phillipes
- 13.1.9 Singapore
- 13.1.10 Thailandc
- 13.1.11 Rest of Asia Pacific
- 14. South America APAC Starch Derivative Market Analysis, Insights and Forecast, 2019-2031
- 14.1. Market Analysis, Insights and Forecast - By Country/Sub-region
- 14.1.1 Brazil
- 14.1.2 Argentina
- 14.1.3 Peru
- 14.1.4 Chile
- 14.1.5 Colombia
- 14.1.6 Ecuador
- 14.1.7 Venezuela
- 14.1.8 Rest of South America
- 15. North America APAC Starch Derivative Market Analysis, Insights and Forecast, 2019-2031
- 15.1. Market Analysis, Insights and Forecast - By Country/Sub-region
- 15.1.1 United States
- 15.1.2 Canada
- 15.1.3 Mexico
- 16. MEA APAC Starch Derivative Market Analysis, Insights and Forecast, 2019-2031
- 16.1. Market Analysis, Insights and Forecast - By Country/Sub-region
- 16.1.1 United Arab Emirates
- 16.1.2 Saudi Arabia
- 16.1.3 South Africa
- 16.1.4 Rest of Middle East and Africa
- 17. Competitive Analysis
- 17.1. Global Market Share Analysis 2024
- 17.2. Company Profiles
- 17.2.1 Cargill Incorporated
- 17.2.1.1. Overview
- 17.2.1.2. Products
- 17.2.1.3. SWOT Analysis
- 17.2.1.4. Recent Developments
- 17.2.1.5. Financials (Based on Availability)
- 17.2.2 Manildra Group
- 17.2.2.1. Overview
- 17.2.2.2. Products
- 17.2.2.3. SWOT Analysis
- 17.2.2.4. Recent Developments
- 17.2.2.5. Financials (Based on Availability)
- 17.2.3 Gulshan Polyols Ltd
- 17.2.3.1. Overview
- 17.2.3.2. Products
- 17.2.3.3. SWOT Analysis
- 17.2.3.4. Recent Developments
- 17.2.3.5. Financials (Based on Availability)
- 17.2.4 ANGEL STARCH & FOOD PVT LTD
- 17.2.4.1. Overview
- 17.2.4.2. Products
- 17.2.4.3. SWOT Analysis
- 17.2.4.4. Recent Developments
- 17.2.4.5. Financials (Based on Availability)
- 17.2.5 AGRANA Beteiligungs-AG
- 17.2.5.1. Overview
- 17.2.5.2. Products
- 17.2.5.3. SWOT Analysis
- 17.2.5.4. Recent Developments
- 17.2.5.5. Financials (Based on Availability)
- 17.2.6 Tate & Lyle PLC
- 17.2.6.1. Overview
- 17.2.6.2. Products
- 17.2.6.3. SWOT Analysis
- 17.2.6.4. Recent Developments
- 17.2.6.5. Financials (Based on Availability)
- 17.2.7 JAPAN CORN STARCH CO LTD
- 17.2.7.1. Overview
- 17.2.7.2. Products
- 17.2.7.3. SWOT Analysis
- 17.2.7.4. Recent Developments
- 17.2.7.5. Financials (Based on Availability)
- 17.2.8 Ingredion Incorporated
- 17.2.8.1. Overview
- 17.2.8.2. Products
- 17.2.8.3. SWOT Analysis
- 17.2.8.4. Recent Developments
- 17.2.8.5. Financials (Based on Availability)
- 17.2.1 Cargill Incorporated
List of Figures
- Figure 1: Global APAC Starch Derivative Market Revenue Breakdown (Million, %) by Region 2024 & 2032
- Figure 2: North America APAC Starch Derivative Market Revenue (Million), by Country 2024 & 2032
- Figure 3: North America APAC Starch Derivative Market Revenue Share (%), by Country 2024 & 2032
- Figure 4: Europe APAC Starch Derivative Market Revenue (Million), by Country 2024 & 2032
- Figure 5: Europe APAC Starch Derivative Market Revenue Share (%), by Country 2024 & 2032
- Figure 6: Asia Pacific APAC Starch Derivative Market Revenue (Million), by Country 2024 & 2032
- Figure 7: Asia Pacific APAC Starch Derivative Market Revenue Share (%), by Country 2024 & 2032
- Figure 8: South America APAC Starch Derivative Market Revenue (Million), by Country 2024 & 2032
- Figure 9: South America APAC Starch Derivative Market Revenue Share (%), by Country 2024 & 2032
- Figure 10: North America APAC Starch Derivative Market Revenue (Million), by Country 2024 & 2032
- Figure 11: North America APAC Starch Derivative Market Revenue Share (%), by Country 2024 & 2032
- Figure 12: MEA APAC Starch Derivative Market Revenue (Million), by Country 2024 & 2032
- Figure 13: MEA APAC Starch Derivative Market Revenue Share (%), by Country 2024 & 2032
- Figure 14: China APAC Starch Derivative Market Revenue (Million), by Type 2024 & 2032
- Figure 15: China APAC Starch Derivative Market Revenue Share (%), by Type 2024 & 2032
- Figure 16: China APAC Starch Derivative Market Revenue (Million), by Source 2024 & 2032
- Figure 17: China APAC Starch Derivative Market Revenue Share (%), by Source 2024 & 2032
- Figure 18: China APAC Starch Derivative Market Revenue (Million), by Application 2024 & 2032
- Figure 19: China APAC Starch Derivative Market Revenue Share (%), by Application 2024 & 2032
- Figure 20: China APAC Starch Derivative Market Revenue (Million), by Geography 2024 & 2032
- Figure 21: China APAC Starch Derivative Market Revenue Share (%), by Geography 2024 & 2032
- Figure 22: China APAC Starch Derivative Market Revenue (Million), by Country 2024 & 2032
- Figure 23: China APAC Starch Derivative Market Revenue Share (%), by Country 2024 & 2032
- Figure 24: Japan APAC Starch Derivative Market Revenue (Million), by Type 2024 & 2032
- Figure 25: Japan APAC Starch Derivative Market Revenue Share (%), by Type 2024 & 2032
- Figure 26: Japan APAC Starch Derivative Market Revenue (Million), by Source 2024 & 2032
- Figure 27: Japan APAC Starch Derivative Market Revenue Share (%), by Source 2024 & 2032
- Figure 28: Japan APAC Starch Derivative Market Revenue (Million), by Application 2024 & 2032
- Figure 29: Japan APAC Starch Derivative Market Revenue Share (%), by Application 2024 & 2032
- Figure 30: Japan APAC Starch Derivative Market Revenue (Million), by Geography 2024 & 2032
- Figure 31: Japan APAC Starch Derivative Market Revenue Share (%), by Geography 2024 & 2032
- Figure 32: Japan APAC Starch Derivative Market Revenue (Million), by Country 2024 & 2032
- Figure 33: Japan APAC Starch Derivative Market Revenue Share (%), by Country 2024 & 2032
- Figure 34: India APAC Starch Derivative Market Revenue (Million), by Type 2024 & 2032
- Figure 35: India APAC Starch Derivative Market Revenue Share (%), by Type 2024 & 2032
- Figure 36: India APAC Starch Derivative Market Revenue (Million), by Source 2024 & 2032
- Figure 37: India APAC Starch Derivative Market Revenue Share (%), by Source 2024 & 2032
- Figure 38: India APAC Starch Derivative Market Revenue (Million), by Application 2024 & 2032
- Figure 39: India APAC Starch Derivative Market Revenue Share (%), by Application 2024 & 2032
- Figure 40: India APAC Starch Derivative Market Revenue (Million), by Geography 2024 & 2032
- Figure 41: India APAC Starch Derivative Market Revenue Share (%), by Geography 2024 & 2032
- Figure 42: India APAC Starch Derivative Market Revenue (Million), by Country 2024 & 2032
- Figure 43: India APAC Starch Derivative Market Revenue Share (%), by Country 2024 & 2032
- Figure 44: Australia APAC Starch Derivative Market Revenue (Million), by Type 2024 & 2032
- Figure 45: Australia APAC Starch Derivative Market Revenue Share (%), by Type 2024 & 2032
- Figure 46: Australia APAC Starch Derivative Market Revenue (Million), by Source 2024 & 2032
- Figure 47: Australia APAC Starch Derivative Market Revenue Share (%), by Source 2024 & 2032
- Figure 48: Australia APAC Starch Derivative Market Revenue (Million), by Application 2024 & 2032
- Figure 49: Australia APAC Starch Derivative Market Revenue Share (%), by Application 2024 & 2032
- Figure 50: Australia APAC Starch Derivative Market Revenue (Million), by Geography 2024 & 2032
- Figure 51: Australia APAC Starch Derivative Market Revenue Share (%), by Geography 2024 & 2032
- Figure 52: Australia APAC Starch Derivative Market Revenue (Million), by Country 2024 & 2032
- Figure 53: Australia APAC Starch Derivative Market Revenue Share (%), by Country 2024 & 2032
- Figure 54: Rest of Asia Pacific APAC Starch Derivative Market Revenue (Million), by Type 2024 & 2032
- Figure 55: Rest of Asia Pacific APAC Starch Derivative Market Revenue Share (%), by Type 2024 & 2032
- Figure 56: Rest of Asia Pacific APAC Starch Derivative Market Revenue (Million), by Source 2024 & 2032
- Figure 57: Rest of Asia Pacific APAC Starch Derivative Market Revenue Share (%), by Source 2024 & 2032
- Figure 58: Rest of Asia Pacific APAC Starch Derivative Market Revenue (Million), by Application 2024 & 2032
- Figure 59: Rest of Asia Pacific APAC Starch Derivative Market Revenue Share (%), by Application 2024 & 2032
- Figure 60: Rest of Asia Pacific APAC Starch Derivative Market Revenue (Million), by Geography 2024 & 2032
- Figure 61: Rest of Asia Pacific APAC Starch Derivative Market Revenue Share (%), by Geography 2024 & 2032
- Figure 62: Rest of Asia Pacific APAC Starch Derivative Market Revenue (Million), by Country 2024 & 2032
- Figure 63: Rest of Asia Pacific APAC Starch Derivative Market Revenue Share (%), by Country 2024 & 2032
List of Tables
- Table 1: Global APAC Starch Derivative Market Revenue Million Forecast, by Region 2019 & 2032
- Table 2: Global APAC Starch Derivative Market Revenue Million Forecast, by Type 2019 & 2032
- Table 3: Global APAC Starch Derivative Market Revenue Million Forecast, by Source 2019 & 2032
- Table 4: Global APAC Starch Derivative Market Revenue Million Forecast, by Application 2019 & 2032
- Table 5: Global APAC Starch Derivative Market Revenue Million Forecast, by Geography 2019 & 2032
- Table 6: Global APAC Starch Derivative Market Revenue Million Forecast, by Region 2019 & 2032
- Table 7: Global APAC Starch Derivative Market Revenue Million Forecast, by Country 2019 & 2032
- Table 8: United States APAC Starch Derivative Market Revenue (Million) Forecast, by Application 2019 & 2032
- Table 9: Canada APAC Starch Derivative Market Revenue (Million) Forecast, by Application 2019 & 2032
- Table 10: Mexico APAC Starch Derivative Market Revenue (Million) Forecast, by Application 2019 & 2032
- Table 11: Global APAC Starch Derivative Market Revenue Million Forecast, by Country 2019 & 2032
- Table 12: Germany APAC Starch Derivative Market Revenue (Million) Forecast, by Application 2019 & 2032
- Table 13: United Kingdom APAC Starch Derivative Market Revenue (Million) Forecast, by Application 2019 & 2032
- Table 14: France APAC Starch Derivative Market Revenue (Million) Forecast, by Application 2019 & 2032
- Table 15: Spain APAC Starch Derivative Market Revenue (Million) Forecast, by Application 2019 & 2032
- Table 16: Italy APAC Starch Derivative Market Revenue (Million) Forecast, by Application 2019 & 2032
- Table 17: Spain APAC Starch Derivative Market Revenue (Million) Forecast, by Application 2019 & 2032
- Table 18: Belgium APAC Starch Derivative Market Revenue (Million) Forecast, by Application 2019 & 2032
- Table 19: Netherland APAC Starch Derivative Market Revenue (Million) Forecast, by Application 2019 & 2032
- Table 20: Nordics APAC Starch Derivative Market Revenue (Million) Forecast, by Application 2019 & 2032
- Table 21: Rest of Europe APAC Starch Derivative Market Revenue (Million) Forecast, by Application 2019 & 2032
- Table 22: Global APAC Starch Derivative Market Revenue Million Forecast, by Country 2019 & 2032
- Table 23: China APAC Starch Derivative Market Revenue (Million) Forecast, by Application 2019 & 2032
- Table 24: Japan APAC Starch Derivative Market Revenue (Million) Forecast, by Application 2019 & 2032
- Table 25: India APAC Starch Derivative Market Revenue (Million) Forecast, by Application 2019 & 2032
- Table 26: South Korea APAC Starch Derivative Market Revenue (Million) Forecast, by Application 2019 & 2032
- Table 27: Southeast Asia APAC Starch Derivative Market Revenue (Million) Forecast, by Application 2019 & 2032
- Table 28: Australia APAC Starch Derivative Market Revenue (Million) Forecast, by Application 2019 & 2032
- Table 29: Indonesia APAC Starch Derivative Market Revenue (Million) Forecast, by Application 2019 & 2032
- Table 30: Phillipes APAC Starch Derivative Market Revenue (Million) Forecast, by Application 2019 & 2032
- Table 31: Singapore APAC Starch Derivative Market Revenue (Million) Forecast, by Application 2019 & 2032
- Table 32: Thailandc APAC Starch Derivative Market Revenue (Million) Forecast, by Application 2019 & 2032
- Table 33: Rest of Asia Pacific APAC Starch Derivative Market Revenue (Million) Forecast, by Application 2019 & 2032
- Table 34: Global APAC Starch Derivative Market Revenue Million Forecast, by Country 2019 & 2032
- Table 35: Brazil APAC Starch Derivative Market Revenue (Million) Forecast, by Application 2019 & 2032
- Table 36: Argentina APAC Starch Derivative Market Revenue (Million) Forecast, by Application 2019 & 2032
- Table 37: Peru APAC Starch Derivative Market Revenue (Million) Forecast, by Application 2019 & 2032
- Table 38: Chile APAC Starch Derivative Market Revenue (Million) Forecast, by Application 2019 & 2032
- Table 39: Colombia APAC Starch Derivative Market Revenue (Million) Forecast, by Application 2019 & 2032
- Table 40: Ecuador APAC Starch Derivative Market Revenue (Million) Forecast, by Application 2019 & 2032
- Table 41: Venezuela APAC Starch Derivative Market Revenue (Million) Forecast, by Application 2019 & 2032
- Table 42: Rest of South America APAC Starch Derivative Market Revenue (Million) Forecast, by Application 2019 & 2032
- Table 43: Global APAC Starch Derivative Market Revenue Million Forecast, by Country 2019 & 2032
- Table 44: United States APAC Starch Derivative Market Revenue (Million) Forecast, by Application 2019 & 2032
- Table 45: Canada APAC Starch Derivative Market Revenue (Million) Forecast, by Application 2019 & 2032
- Table 46: Mexico APAC Starch Derivative Market Revenue (Million) Forecast, by Application 2019 & 2032
- Table 47: Global APAC Starch Derivative Market Revenue Million Forecast, by Country 2019 & 2032
- Table 48: United Arab Emirates APAC Starch Derivative Market Revenue (Million) Forecast, by Application 2019 & 2032
- Table 49: Saudi Arabia APAC Starch Derivative Market Revenue (Million) Forecast, by Application 2019 & 2032
- Table 50: South Africa APAC Starch Derivative Market Revenue (Million) Forecast, by Application 2019 & 2032
- Table 51: Rest of Middle East and Africa APAC Starch Derivative Market Revenue (Million) Forecast, by Application 2019 & 2032
- Table 52: Global APAC Starch Derivative Market Revenue Million Forecast, by Type 2019 & 2032
- Table 53: Global APAC Starch Derivative Market Revenue Million Forecast, by Source 2019 & 2032
- Table 54: Global APAC Starch Derivative Market Revenue Million Forecast, by Application 2019 & 2032
- Table 55: Global APAC Starch Derivative Market Revenue Million Forecast, by Geography 2019 & 2032
- Table 56: Global APAC Starch Derivative Market Revenue Million Forecast, by Country 2019 & 2032
- Table 57: Global APAC Starch Derivative Market Revenue Million Forecast, by Type 2019 & 2032
- Table 58: Global APAC Starch Derivative Market Revenue Million Forecast, by Source 2019 & 2032
- Table 59: Global APAC Starch Derivative Market Revenue Million Forecast, by Application 2019 & 2032
- Table 60: Global APAC Starch Derivative Market Revenue Million Forecast, by Geography 2019 & 2032
- Table 61: Global APAC Starch Derivative Market Revenue Million Forecast, by Country 2019 & 2032
- Table 62: Global APAC Starch Derivative Market Revenue Million Forecast, by Type 2019 & 2032
- Table 63: Global APAC Starch Derivative Market Revenue Million Forecast, by Source 2019 & 2032
- Table 64: Global APAC Starch Derivative Market Revenue Million Forecast, by Application 2019 & 2032
- Table 65: Global APAC Starch Derivative Market Revenue Million Forecast, by Geography 2019 & 2032
- Table 66: Global APAC Starch Derivative Market Revenue Million Forecast, by Country 2019 & 2032
- Table 67: Global APAC Starch Derivative Market Revenue Million Forecast, by Type 2019 & 2032
- Table 68: Global APAC Starch Derivative Market Revenue Million Forecast, by Source 2019 & 2032
- Table 69: Global APAC Starch Derivative Market Revenue Million Forecast, by Application 2019 & 2032
- Table 70: Global APAC Starch Derivative Market Revenue Million Forecast, by Geography 2019 & 2032
- Table 71: Global APAC Starch Derivative Market Revenue Million Forecast, by Country 2019 & 2032
- Table 72: Global APAC Starch Derivative Market Revenue Million Forecast, by Type 2019 & 2032
- Table 73: Global APAC Starch Derivative Market Revenue Million Forecast, by Source 2019 & 2032
- Table 74: Global APAC Starch Derivative Market Revenue Million Forecast, by Application 2019 & 2032
- Table 75: Global APAC Starch Derivative Market Revenue Million Forecast, by Geography 2019 & 2032
- Table 76: Global APAC Starch Derivative Market Revenue Million Forecast, by Country 2019 & 2032
Frequently Asked Questions
1. What is the projected Compound Annual Growth Rate (CAGR) of the APAC Starch Derivative Market?
The projected CAGR is approximately 5.98%.
2. Which companies are prominent players in the APAC Starch Derivative Market?
Key companies in the market include Cargill Incorporated, Manildra Group, Gulshan Polyols Ltd , ANGEL STARCH & FOOD PVT LTD, AGRANA Beteiligungs-AG, Tate & Lyle PLC, JAPAN CORN STARCH CO LTD, Ingredion Incorporated.
3. What are the main segments of the APAC Starch Derivative Market?
The market segments include Type, Source, Application, Geography.
4. Can you provide details about the market size?
The market size is estimated to be USD XX Million as of 2022.
5. What are some drivers contributing to market growth?
Wide Applications and Functionality; Demand For Gluten-Free Products.
6. What are the notable trends driving market growth?
Textile Industry: Growth Engine of Starch Utilisation.
7. Are there any restraints impacting market growth?
Easy Availability of Economically Feasible Alternatives.
8. Can you provide examples of recent developments in the market?
1. Acquisitions and mergers to expand market share and product portfolios 2. Partnerships for product development and distribution 3. Investments in R&D to enhance product offerings and meet evolving customer needs
9. What pricing options are available for accessing the report?
Pricing options include single-user, multi-user, and enterprise licenses priced at USD 4750, USD 5250, and USD 8750 respectively.
10. Is the market size provided in terms of value or volume?
The market size is provided in terms of value, measured in Million.
11. Are there any specific market keywords associated with the report?
Yes, the market keyword associated with the report is "APAC Starch Derivative Market," which aids in identifying and referencing the specific market segment covered.
12. How do I determine which pricing option suits my needs best?
The pricing options vary based on user requirements and access needs. Individual users may opt for single-user licenses, while businesses requiring broader access may choose multi-user or enterprise licenses for cost-effective access to the report.
13. Are there any additional resources or data provided in the APAC Starch Derivative Market report?
While the report offers comprehensive insights, it's advisable to review the specific contents or supplementary materials provided to ascertain if additional resources or data are available.
14. How can I stay updated on further developments or reports in the APAC Starch Derivative Market?
To stay informed about further developments, trends, and reports in the APAC Starch Derivative Market, consider subscribing to industry newsletters, following relevant companies and organizations, or regularly checking reputable industry news sources and publications.
Methodology
Step 1 - Identification of Relevant Samples Size from Population Database


Step 2 - Approaches for Defining Global Market Size (Value, Volume* & Price*)

Note*: In applicable scenarios
Step 3 - Data Sources
Primary Research
- Web Analytics
- Survey Reports
- Research Institute
- Latest Research Reports
- Opinion Leaders
Secondary Research
- Annual Reports
- White Paper
- Latest Press Release
- Industry Association
- Paid Database
- Investor Presentations

Step 4 - Data Triangulation
Involves using different sources of information in order to increase the validity of a study
These sources are likely to be stakeholders in a program - participants, other researchers, program staff, other community members, and so on.
Then we put all data in single framework & apply various statistical tools to find out the dynamic on the market.
During the analysis stage, feedback from the stakeholder groups would be compared to determine areas of agreement as well as areas of divergence
