

Key Insights
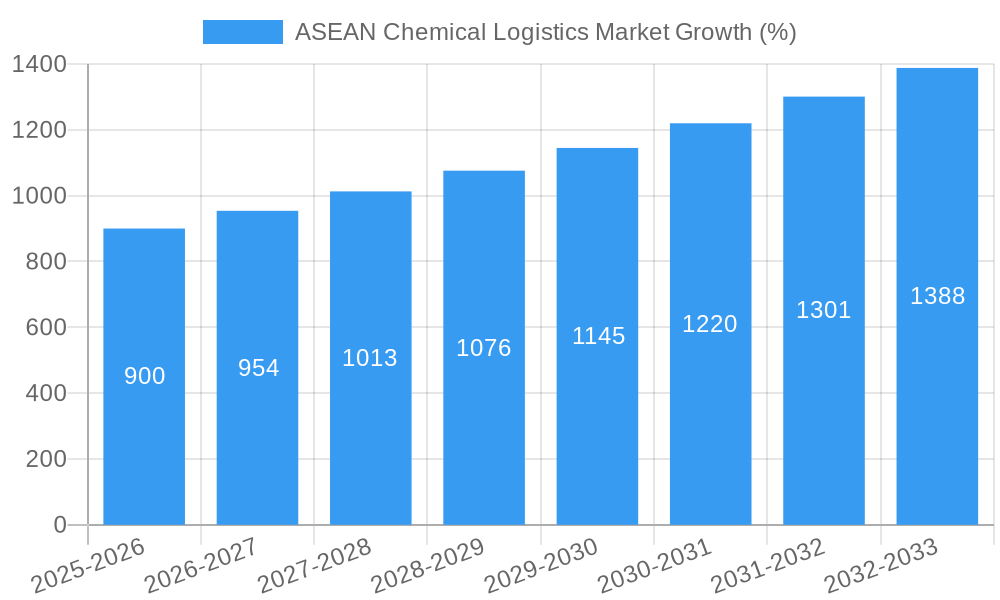
The ASEAN chemical logistics market is experiencing robust growth, driven by the expanding chemical industry across the region and the increasing need for efficient and secure transportation and handling of chemical products. The market's Compound Annual Growth Rate (CAGR) exceeding 5.50% from 2019-2024 indicates a significant upward trajectory. Key drivers include rising demand for specialty chemicals, particularly in the pharmaceutical and cosmetic sectors, coupled with the growth of e-commerce and the need for sophisticated supply chain management. Furthermore, increasing investments in infrastructure development, particularly in transportation networks and warehousing facilities across countries like Singapore, Thailand, and Vietnam, are further bolstering market expansion. The market is segmented by service type (transportation, warehousing, consulting, etc.), mode of transportation (road, rail, air, sea), and end-user industry (pharmaceuticals, oil & gas, etc.). While challenges exist, such as regulatory complexities and the need for enhanced safety protocols in handling hazardous materials, the overall outlook remains positive, fueled by strong economic growth within ASEAN and the continued expansion of its chemical manufacturing base. Major players like DHL, A&R Logistics, and JWD InfoLogistics are leveraging technological advancements, such as digitalization and automation, to enhance efficiency and competitiveness. The ongoing focus on sustainable practices, reflected in the growth of green logistics, further contributes to the market's positive outlook. This presents lucrative opportunities for existing and new market entrants focusing on specialized services and innovative solutions.
The ASEAN chemical logistics market is projected to maintain its strong growth momentum through 2033. This sustained expansion will be underpinned by several factors, including the increasing adoption of advanced technologies like blockchain for improved supply chain transparency and traceability. Furthermore, the rising focus on regional economic integration initiatives will facilitate cross-border trade and improve the efficiency of logistics operations. Government support for infrastructure development and regulatory reforms aimed at streamlining logistics processes will also contribute to market growth. However, potential risks, such as geopolitical uncertainties and fluctuations in global commodity prices, should be considered. Nevertheless, the long-term prospects for the ASEAN chemical logistics market remain promising, driven by the region's sustained economic growth and the expanding chemical industry landscape.

ASEAN Chemical Logistics Market: A Comprehensive Report (2019-2033)
This comprehensive report provides an in-depth analysis of the ASEAN chemical logistics market, encompassing market dynamics, growth trends, key players, and future outlook. With a focus on the parent market (ASEAN Logistics) and child market (Chemical Logistics within ASEAN), this report offers invaluable insights for industry professionals, investors, and strategic decision-makers. The study period covers 2019-2033, with 2025 as the base and estimated year.
Note: Market values are presented in million units. Where data is unavailable, estimations are provided.
ASEAN Chemical Logistics Market Dynamics & Structure
The ASEAN chemical logistics market is characterized by moderate concentration, with a few dominant players and several regional specialists. Technological innovation, particularly in automation, data analytics, and green logistics, is a key driver. Stringent regulatory frameworks concerning the handling of hazardous materials significantly impact operational costs and strategies. The market also faces competition from substitute transportation methods and evolving end-user demands. Mergers and acquisitions (M&A) activity has been moderate, with strategic partnerships becoming increasingly prevalent.
- Market Concentration: Moderately concentrated, with top 5 players holding approximately xx% market share in 2024.
- Technological Innovation: Focus on automation (robotics, AI), real-time tracking, and sustainable practices (green logistics). Barriers to innovation include high initial investment costs and integration complexities.
- Regulatory Framework: Stringent regulations on hazardous materials handling, increasing compliance costs and operational complexity.
- Competitive Product Substitutes: Alternative transportation modes (e.g., increased rail usage) pose a competitive challenge.
- End-User Demographics: Pharmaceutical, specialty chemical, and oil & gas industries are primary drivers, with cosmetics showing increasing demand.
- M&A Trends: Moderate M&A activity; strategic partnerships for specialized services are increasingly common (xx deals in the last 5 years).
ASEAN Chemical Logistics Market Growth Trends & Insights
The ASEAN chemical logistics market experienced robust growth between 2019 and 2024, driven by increasing chemical production, expanding e-commerce, and improving infrastructure. The market size reached xx million in 2024, with a CAGR of xx% during the historical period. Technological disruptions, such as the adoption of IoT and AI-powered solutions, are reshaping operational efficiency and enhancing supply chain visibility. Consumer behavior shifts towards sustainable and ethical sourcing are also influencing the market. The forecast period (2025-2033) projects continued growth, reaching an estimated xx million by 2033, driven by increasing regional trade and investments in logistics infrastructure. Market penetration for advanced logistics technologies remains relatively low, presenting substantial growth potential.
Dominant Regions, Countries, or Segments in ASEAN Chemical Logistics Market
Significant growth is observed in Singapore, Malaysia, and Thailand, driven by robust industrial activity and established logistics infrastructure. Within the market segments, Transportation (especially roadways), Warehousing, and Distribution services dominate. The Pharmaceutical and Specialty Chemical industries are the largest end-users.
- Leading Region: Southeast Asia (Singapore, Malaysia, Thailand)
- Key Country Drivers:
- Singapore: Highly developed infrastructure and strategic location.
- Malaysia: Growing industrial sector and Port Klang's prominence.
- Thailand: Significant manufacturing base and expanding chemical industry.
- Dominant Segments:
- By Service: Transportation (xx%), Warehousing (xx%), Distribution (xx%)
- By Mode: Roadways (xx%), Airways (xx%)
- By End User: Pharmaceutical (xx%), Specialty Chemicals (xx%)
- Growth Drivers:
- Strong economic growth in ASEAN countries
- Increasing industrialization and manufacturing
- Development of regional infrastructure (roads, ports, airports)
- Government initiatives supporting logistics development
ASEAN Chemical Logistics Market Product Landscape
Product innovations focus on enhancing safety, efficiency, and sustainability. This includes the implementation of advanced tracking systems, specialized containers for hazardous materials, and the integration of green logistics solutions, such as electric vehicles and optimized routing software. Key performance indicators (KPIs) include on-time delivery rates, reduced transportation costs, and minimized environmental impact. Unique selling propositions are increasingly focused on customized solutions, data-driven insights, and end-to-end supply chain visibility.
Key Drivers, Barriers & Challenges in ASEAN Chemical Logistics Market
Key Drivers:
- Rising demand from key industries (pharmaceuticals, specialty chemicals)
- Growing e-commerce and cross-border trade
- Investments in infrastructure development
- Government initiatives supporting logistics sector growth
Challenges:
- Regulatory complexities and compliance costs (hazardous materials handling)
- Infrastructure limitations in some areas
- Skill gaps in logistics workforce
- Geopolitical uncertainties and supply chain disruptions (estimated xx% impact on market growth in 2024)
Emerging Opportunities in ASEAN Chemical Logistics Market
- Increased adoption of technology (AI, blockchain, IoT) for improved efficiency and transparency.
- Growth of specialized services for handling hazardous chemicals.
- Expansion into untapped markets within the region.
- Focus on sustainable and environmentally friendly logistics solutions.
Growth Accelerators in the ASEAN Chemical Logistics Market Industry
Technological advancements, strategic partnerships (particularly between logistics providers and technology companies), and market expansion into less developed regions will play a significant role in driving long-term growth. The focus on improving supply chain resilience and enhancing customer service through personalized solutions will also be important growth drivers.
Key Players Shaping the ASEAN Chemical Logistics Market Market
- DHL
- A&R Logistics
- JWD InfoLogistics Public Company Limited
- Alps Logistics
- CEVA Logistics
- Agility Logistics
- CT Logistics
- Tiong Nam Logistics Holdings BhD
- Eagles Air & Sea
- BDP International
- Rinchem
- Rhenus Logistics
Notable Milestones in ASEAN Chemical Logistics Market Sector
- October 2022: Rinchem's new Malaysian warehouse (45,000 sq ft, 3100 pallet positions) signifies growing investment in chemical storage infrastructure.
- February 2022: Leschaco's new chemical and dangerous goods warehouse in Port Klang (120,000 sq ft, 13,000 pallet positions) highlights the demand for contract logistics.
- October 2021: FLS Supply Chain Centers JV's hazardous chemical warehouse project in Thailand (10,000 sq m) indicates increasing investment in specialized facilities.
In-Depth ASEAN Chemical Logistics Market Market Outlook
The ASEAN chemical logistics market is poised for sustained growth, driven by increasing regional trade, investment in infrastructure, and technological advancements. Strategic partnerships, investments in specialized facilities, and adoption of sustainable practices will create significant opportunities for players in this dynamic market. Future growth will be driven by both organic expansion and strategic acquisitions. The potential for significant market expansion into newer technologies and sustainability solutions is vast.
ASEAN Chemical Logistics Market Segmentation
-
1. Service
- 1.1. Transportation
- 1.2. Warehous
- 1.3. Consulting & Management Services
- 1.4. Customs & Security
- 1.5. Green Logistics
- 1.6. Others
-
2. Mode of Transportation
- 2.1. Roadways
- 2.2. Railways
- 2.3. Airways
- 2.4. Waterways
- 2.5. Pipelines
-
3. End User
- 3.1. Pharmaceutical Industry
- 3.2. Specialty Chemical Industry
- 3.3. Oil and Gas Industry
- 3.4. Cosmetic Industry
- 3.5. Others
-
4. Geography
- 4.1. Singapore
- 4.2. Thailand
- 4.3. Malaysia
- 4.4. Vietnam
- 4.5. Indonesia
- 4.6. Philippines
- 4.7. Rest of ASEAN
ASEAN Chemical Logistics Market Segmentation By Geography
- 1. Singapore
- 2. Thailand
- 3. Malaysia
- 4. Vietnam
- 5. Indonesia
- 6. Philippines
- 7. Rest of ASEAN

ASEAN Chemical Logistics Market REPORT HIGHLIGHTS
| Aspects | Details |
|---|---|
| Study Period | 2019-2033 |
| Base Year | 2024 |
| Estimated Year | 2025 |
| Forecast Period | 2025-2033 |
| Historical Period | 2019-2024 |
| Growth Rate | CAGR of > 5.50% from 2019-2033 |
| Segmentation |
|
Table of Contents
- 1. Introduction
- 1.1. Research Scope
- 1.2. Market Segmentation
- 1.3. Research Methodology
- 1.4. Definitions and Assumptions
- 2. Executive Summary
- 2.1. Introduction
- 3. Market Dynamics
- 3.1. Introduction
- 3.2. Market Drivers
- 3.2.1. The Rise in Demand for Specialty Chemicals in ASEAN Countries Increasing Trade Logistics Activity; Partnerships and Collaborations Between Major Players in the Chemical Logistics Market are Being Formed for the Creation of Innovative Goods and Technologically Enhanced Services
- 3.3. Market Restrains
- 3.3.1. Complexities Related to Chemical Logistics; High Cost Involved in the Transportation of Chemicals
- 3.4. Market Trends
- 3.4.1. The Rise in Chemical Production is Expected to Propel the Growth of the Chemical Logistics Market
- 4. Market Factor Analysis
- 4.1. Porters Five Forces
- 4.2. Supply/Value Chain
- 4.3. PESTEL analysis
- 4.4. Market Entropy
- 4.5. Patent/Trademark Analysis
- 5. Global ASEAN Chemical Logistics Market Analysis, Insights and Forecast, 2019-2031
- 5.1. Market Analysis, Insights and Forecast - by Service
- 5.1.1. Transportation
- 5.1.2. Warehous
- 5.1.3. Consulting & Management Services
- 5.1.4. Customs & Security
- 5.1.5. Green Logistics
- 5.1.6. Others
- 5.2. Market Analysis, Insights and Forecast - by Mode of Transportation
- 5.2.1. Roadways
- 5.2.2. Railways
- 5.2.3. Airways
- 5.2.4. Waterways
- 5.2.5. Pipelines
- 5.3. Market Analysis, Insights and Forecast - by End User
- 5.3.1. Pharmaceutical Industry
- 5.3.2. Specialty Chemical Industry
- 5.3.3. Oil and Gas Industry
- 5.3.4. Cosmetic Industry
- 5.3.5. Others
- 5.4. Market Analysis, Insights and Forecast - by Geography
- 5.4.1. Singapore
- 5.4.2. Thailand
- 5.4.3. Malaysia
- 5.4.4. Vietnam
- 5.4.5. Indonesia
- 5.4.6. Philippines
- 5.4.7. Rest of ASEAN
- 5.5. Market Analysis, Insights and Forecast - by Region
- 5.5.1. Singapore
- 5.5.2. Thailand
- 5.5.3. Malaysia
- 5.5.4. Vietnam
- 5.5.5. Indonesia
- 5.5.6. Philippines
- 5.5.7. Rest of ASEAN
- 5.1. Market Analysis, Insights and Forecast - by Service
- 6. Singapore ASEAN Chemical Logistics Market Analysis, Insights and Forecast, 2019-2031
- 6.1. Market Analysis, Insights and Forecast - by Service
- 6.1.1. Transportation
- 6.1.2. Warehous
- 6.1.3. Consulting & Management Services
- 6.1.4. Customs & Security
- 6.1.5. Green Logistics
- 6.1.6. Others
- 6.2. Market Analysis, Insights and Forecast - by Mode of Transportation
- 6.2.1. Roadways
- 6.2.2. Railways
- 6.2.3. Airways
- 6.2.4. Waterways
- 6.2.5. Pipelines
- 6.3. Market Analysis, Insights and Forecast - by End User
- 6.3.1. Pharmaceutical Industry
- 6.3.2. Specialty Chemical Industry
- 6.3.3. Oil and Gas Industry
- 6.3.4. Cosmetic Industry
- 6.3.5. Others
- 6.4. Market Analysis, Insights and Forecast - by Geography
- 6.4.1. Singapore
- 6.4.2. Thailand
- 6.4.3. Malaysia
- 6.4.4. Vietnam
- 6.4.5. Indonesia
- 6.4.6. Philippines
- 6.4.7. Rest of ASEAN
- 6.1. Market Analysis, Insights and Forecast - by Service
- 7. Thailand ASEAN Chemical Logistics Market Analysis, Insights and Forecast, 2019-2031
- 7.1. Market Analysis, Insights and Forecast - by Service
- 7.1.1. Transportation
- 7.1.2. Warehous
- 7.1.3. Consulting & Management Services
- 7.1.4. Customs & Security
- 7.1.5. Green Logistics
- 7.1.6. Others
- 7.2. Market Analysis, Insights and Forecast - by Mode of Transportation
- 7.2.1. Roadways
- 7.2.2. Railways
- 7.2.3. Airways
- 7.2.4. Waterways
- 7.2.5. Pipelines
- 7.3. Market Analysis, Insights and Forecast - by End User
- 7.3.1. Pharmaceutical Industry
- 7.3.2. Specialty Chemical Industry
- 7.3.3. Oil and Gas Industry
- 7.3.4. Cosmetic Industry
- 7.3.5. Others
- 7.4. Market Analysis, Insights and Forecast - by Geography
- 7.4.1. Singapore
- 7.4.2. Thailand
- 7.4.3. Malaysia
- 7.4.4. Vietnam
- 7.4.5. Indonesia
- 7.4.6. Philippines
- 7.4.7. Rest of ASEAN
- 7.1. Market Analysis, Insights and Forecast - by Service
- 8. Malaysia ASEAN Chemical Logistics Market Analysis, Insights and Forecast, 2019-2031
- 8.1. Market Analysis, Insights and Forecast - by Service
- 8.1.1. Transportation
- 8.1.2. Warehous
- 8.1.3. Consulting & Management Services
- 8.1.4. Customs & Security
- 8.1.5. Green Logistics
- 8.1.6. Others
- 8.2. Market Analysis, Insights and Forecast - by Mode of Transportation
- 8.2.1. Roadways
- 8.2.2. Railways
- 8.2.3. Airways
- 8.2.4. Waterways
- 8.2.5. Pipelines
- 8.3. Market Analysis, Insights and Forecast - by End User
- 8.3.1. Pharmaceutical Industry
- 8.3.2. Specialty Chemical Industry
- 8.3.3. Oil and Gas Industry
- 8.3.4. Cosmetic Industry
- 8.3.5. Others
- 8.4. Market Analysis, Insights and Forecast - by Geography
- 8.4.1. Singapore
- 8.4.2. Thailand
- 8.4.3. Malaysia
- 8.4.4. Vietnam
- 8.4.5. Indonesia
- 8.4.6. Philippines
- 8.4.7. Rest of ASEAN
- 8.1. Market Analysis, Insights and Forecast - by Service
- 9. Vietnam ASEAN Chemical Logistics Market Analysis, Insights and Forecast, 2019-2031
- 9.1. Market Analysis, Insights and Forecast - by Service
- 9.1.1. Transportation
- 9.1.2. Warehous
- 9.1.3. Consulting & Management Services
- 9.1.4. Customs & Security
- 9.1.5. Green Logistics
- 9.1.6. Others
- 9.2. Market Analysis, Insights and Forecast - by Mode of Transportation
- 9.2.1. Roadways
- 9.2.2. Railways
- 9.2.3. Airways
- 9.2.4. Waterways
- 9.2.5. Pipelines
- 9.3. Market Analysis, Insights and Forecast - by End User
- 9.3.1. Pharmaceutical Industry
- 9.3.2. Specialty Chemical Industry
- 9.3.3. Oil and Gas Industry
- 9.3.4. Cosmetic Industry
- 9.3.5. Others
- 9.4. Market Analysis, Insights and Forecast - by Geography
- 9.4.1. Singapore
- 9.4.2. Thailand
- 9.4.3. Malaysia
- 9.4.4. Vietnam
- 9.4.5. Indonesia
- 9.4.6. Philippines
- 9.4.7. Rest of ASEAN
- 9.1. Market Analysis, Insights and Forecast - by Service
- 10. Indonesia ASEAN Chemical Logistics Market Analysis, Insights and Forecast, 2019-2031
- 10.1. Market Analysis, Insights and Forecast - by Service
- 10.1.1. Transportation
- 10.1.2. Warehous
- 10.1.3. Consulting & Management Services
- 10.1.4. Customs & Security
- 10.1.5. Green Logistics
- 10.1.6. Others
- 10.2. Market Analysis, Insights and Forecast - by Mode of Transportation
- 10.2.1. Roadways
- 10.2.2. Railways
- 10.2.3. Airways
- 10.2.4. Waterways
- 10.2.5. Pipelines
- 10.3. Market Analysis, Insights and Forecast - by End User
- 10.3.1. Pharmaceutical Industry
- 10.3.2. Specialty Chemical Industry
- 10.3.3. Oil and Gas Industry
- 10.3.4. Cosmetic Industry
- 10.3.5. Others
- 10.4. Market Analysis, Insights and Forecast - by Geography
- 10.4.1. Singapore
- 10.4.2. Thailand
- 10.4.3. Malaysia
- 10.4.4. Vietnam
- 10.4.5. Indonesia
- 10.4.6. Philippines
- 10.4.7. Rest of ASEAN
- 10.1. Market Analysis, Insights and Forecast - by Service
- 11. Philippines ASEAN Chemical Logistics Market Analysis, Insights and Forecast, 2019-2031
- 11.1. Market Analysis, Insights and Forecast - by Service
- 11.1.1. Transportation
- 11.1.2. Warehous
- 11.1.3. Consulting & Management Services
- 11.1.4. Customs & Security
- 11.1.5. Green Logistics
- 11.1.6. Others
- 11.2. Market Analysis, Insights and Forecast - by Mode of Transportation
- 11.2.1. Roadways
- 11.2.2. Railways
- 11.2.3. Airways
- 11.2.4. Waterways
- 11.2.5. Pipelines
- 11.3. Market Analysis, Insights and Forecast - by End User
- 11.3.1. Pharmaceutical Industry
- 11.3.2. Specialty Chemical Industry
- 11.3.3. Oil and Gas Industry
- 11.3.4. Cosmetic Industry
- 11.3.5. Others
- 11.4. Market Analysis, Insights and Forecast - by Geography
- 11.4.1. Singapore
- 11.4.2. Thailand
- 11.4.3. Malaysia
- 11.4.4. Vietnam
- 11.4.5. Indonesia
- 11.4.6. Philippines
- 11.4.7. Rest of ASEAN
- 11.1. Market Analysis, Insights and Forecast - by Service
- 12. Rest of ASEAN ASEAN Chemical Logistics Market Analysis, Insights and Forecast, 2019-2031
- 12.1. Market Analysis, Insights and Forecast - by Service
- 12.1.1. Transportation
- 12.1.2. Warehous
- 12.1.3. Consulting & Management Services
- 12.1.4. Customs & Security
- 12.1.5. Green Logistics
- 12.1.6. Others
- 12.2. Market Analysis, Insights and Forecast - by Mode of Transportation
- 12.2.1. Roadways
- 12.2.2. Railways
- 12.2.3. Airways
- 12.2.4. Waterways
- 12.2.5. Pipelines
- 12.3. Market Analysis, Insights and Forecast - by End User
- 12.3.1. Pharmaceutical Industry
- 12.3.2. Specialty Chemical Industry
- 12.3.3. Oil and Gas Industry
- 12.3.4. Cosmetic Industry
- 12.3.5. Others
- 12.4. Market Analysis, Insights and Forecast - by Geography
- 12.4.1. Singapore
- 12.4.2. Thailand
- 12.4.3. Malaysia
- 12.4.4. Vietnam
- 12.4.5. Indonesia
- 12.4.6. Philippines
- 12.4.7. Rest of ASEAN
- 12.1. Market Analysis, Insights and Forecast - by Service
- 13. Singapore ASEAN Chemical Logistics Market Analysis, Insights and Forecast, 2019-2031
- 13.1. Market Analysis, Insights and Forecast - By Country/Sub-region
- 13.1.1.
- 14. Thailand ASEAN Chemical Logistics Market Analysis, Insights and Forecast, 2019-2031
- 14.1. Market Analysis, Insights and Forecast - By Country/Sub-region
- 14.1.1.
- 15. Malaysia ASEAN Chemical Logistics Market Analysis, Insights and Forecast, 2019-2031
- 15.1. Market Analysis, Insights and Forecast - By Country/Sub-region
- 15.1.1.
- 16. Vietnam ASEAN Chemical Logistics Market Analysis, Insights and Forecast, 2019-2031
- 16.1. Market Analysis, Insights and Forecast - By Country/Sub-region
- 16.1.1.
- 17. Indonesia ASEAN Chemical Logistics Market Analysis, Insights and Forecast, 2019-2031
- 17.1. Market Analysis, Insights and Forecast - By Country/Sub-region
- 17.1.1.
- 18. Philippines ASEAN Chemical Logistics Market Analysis, Insights and Forecast, 2019-2031
- 18.1. Market Analysis, Insights and Forecast - By Country/Sub-region
- 18.1.1.
- 19. Rest of ASEAN ASEAN Chemical Logistics Market Analysis, Insights and Forecast, 2019-2031
- 19.1. Market Analysis, Insights and Forecast - By Country/Sub-region
- 19.1.1.
- 20. Competitive Analysis
- 20.1. Global Market Share Analysis 2024
- 20.2. Company Profiles
- 20.2.1 DHL
- 20.2.1.1. Overview
- 20.2.1.2. Products
- 20.2.1.3. SWOT Analysis
- 20.2.1.4. Recent Developments
- 20.2.1.5. Financials (Based on Availability)
- 20.2.2 A&R Logistics
- 20.2.2.1. Overview
- 20.2.2.2. Products
- 20.2.2.3. SWOT Analysis
- 20.2.2.4. Recent Developments
- 20.2.2.5. Financials (Based on Availability)
- 20.2.3 JWD InfoLogistics Public Company Limited
- 20.2.3.1. Overview
- 20.2.3.2. Products
- 20.2.3.3. SWOT Analysis
- 20.2.3.4. Recent Developments
- 20.2.3.5. Financials (Based on Availability)
- 20.2.4 Alps Logistics**List Not Exhaustive
- 20.2.4.1. Overview
- 20.2.4.2. Products
- 20.2.4.3. SWOT Analysis
- 20.2.4.4. Recent Developments
- 20.2.4.5. Financials (Based on Availability)
- 20.2.5 CEVA Logistics
- 20.2.5.1. Overview
- 20.2.5.2. Products
- 20.2.5.3. SWOT Analysis
- 20.2.5.4. Recent Developments
- 20.2.5.5. Financials (Based on Availability)
- 20.2.6 Agility Logistics
- 20.2.6.1. Overview
- 20.2.6.2. Products
- 20.2.6.3. SWOT Analysis
- 20.2.6.4. Recent Developments
- 20.2.6.5. Financials (Based on Availability)
- 20.2.7 CT Logistics
- 20.2.7.1. Overview
- 20.2.7.2. Products
- 20.2.7.3. SWOT Analysis
- 20.2.7.4. Recent Developments
- 20.2.7.5. Financials (Based on Availability)
- 20.2.8 Tiong Nam Logistics Holdings BhD
- 20.2.8.1. Overview
- 20.2.8.2. Products
- 20.2.8.3. SWOT Analysis
- 20.2.8.4. Recent Developments
- 20.2.8.5. Financials (Based on Availability)
- 20.2.9 Eagles Air & Sea
- 20.2.9.1. Overview
- 20.2.9.2. Products
- 20.2.9.3. SWOT Analysis
- 20.2.9.4. Recent Developments
- 20.2.9.5. Financials (Based on Availability)
- 20.2.10 BDP International
- 20.2.10.1. Overview
- 20.2.10.2. Products
- 20.2.10.3. SWOT Analysis
- 20.2.10.4. Recent Developments
- 20.2.10.5. Financials (Based on Availability)
- 20.2.11 Rinchem
- 20.2.11.1. Overview
- 20.2.11.2. Products
- 20.2.11.3. SWOT Analysis
- 20.2.11.4. Recent Developments
- 20.2.11.5. Financials (Based on Availability)
- 20.2.12 Rhenus Logistics
- 20.2.12.1. Overview
- 20.2.12.2. Products
- 20.2.12.3. SWOT Analysis
- 20.2.12.4. Recent Developments
- 20.2.12.5. Financials (Based on Availability)
- 20.2.1 DHL
List of Figures
- Figure 1: Global ASEAN Chemical Logistics Market Revenue Breakdown (Million, %) by Region 2024 & 2032
- Figure 2: Singapore ASEAN Chemical Logistics Market Revenue (Million), by Country 2024 & 2032
- Figure 3: Singapore ASEAN Chemical Logistics Market Revenue Share (%), by Country 2024 & 2032
- Figure 4: Thailand ASEAN Chemical Logistics Market Revenue (Million), by Country 2024 & 2032
- Figure 5: Thailand ASEAN Chemical Logistics Market Revenue Share (%), by Country 2024 & 2032
- Figure 6: Malaysia ASEAN Chemical Logistics Market Revenue (Million), by Country 2024 & 2032
- Figure 7: Malaysia ASEAN Chemical Logistics Market Revenue Share (%), by Country 2024 & 2032
- Figure 8: Vietnam ASEAN Chemical Logistics Market Revenue (Million), by Country 2024 & 2032
- Figure 9: Vietnam ASEAN Chemical Logistics Market Revenue Share (%), by Country 2024 & 2032
- Figure 10: Indonesia ASEAN Chemical Logistics Market Revenue (Million), by Country 2024 & 2032
- Figure 11: Indonesia ASEAN Chemical Logistics Market Revenue Share (%), by Country 2024 & 2032
- Figure 12: Philippines ASEAN Chemical Logistics Market Revenue (Million), by Country 2024 & 2032
- Figure 13: Philippines ASEAN Chemical Logistics Market Revenue Share (%), by Country 2024 & 2032
- Figure 14: Rest of ASEAN ASEAN Chemical Logistics Market Revenue (Million), by Country 2024 & 2032
- Figure 15: Rest of ASEAN ASEAN Chemical Logistics Market Revenue Share (%), by Country 2024 & 2032
- Figure 16: Singapore ASEAN Chemical Logistics Market Revenue (Million), by Service 2024 & 2032
- Figure 17: Singapore ASEAN Chemical Logistics Market Revenue Share (%), by Service 2024 & 2032
- Figure 18: Singapore ASEAN Chemical Logistics Market Revenue (Million), by Mode of Transportation 2024 & 2032
- Figure 19: Singapore ASEAN Chemical Logistics Market Revenue Share (%), by Mode of Transportation 2024 & 2032
- Figure 20: Singapore ASEAN Chemical Logistics Market Revenue (Million), by End User 2024 & 2032
- Figure 21: Singapore ASEAN Chemical Logistics Market Revenue Share (%), by End User 2024 & 2032
- Figure 22: Singapore ASEAN Chemical Logistics Market Revenue (Million), by Geography 2024 & 2032
- Figure 23: Singapore ASEAN Chemical Logistics Market Revenue Share (%), by Geography 2024 & 2032
- Figure 24: Singapore ASEAN Chemical Logistics Market Revenue (Million), by Country 2024 & 2032
- Figure 25: Singapore ASEAN Chemical Logistics Market Revenue Share (%), by Country 2024 & 2032
- Figure 26: Thailand ASEAN Chemical Logistics Market Revenue (Million), by Service 2024 & 2032
- Figure 27: Thailand ASEAN Chemical Logistics Market Revenue Share (%), by Service 2024 & 2032
- Figure 28: Thailand ASEAN Chemical Logistics Market Revenue (Million), by Mode of Transportation 2024 & 2032
- Figure 29: Thailand ASEAN Chemical Logistics Market Revenue Share (%), by Mode of Transportation 2024 & 2032
- Figure 30: Thailand ASEAN Chemical Logistics Market Revenue (Million), by End User 2024 & 2032
- Figure 31: Thailand ASEAN Chemical Logistics Market Revenue Share (%), by End User 2024 & 2032
- Figure 32: Thailand ASEAN Chemical Logistics Market Revenue (Million), by Geography 2024 & 2032
- Figure 33: Thailand ASEAN Chemical Logistics Market Revenue Share (%), by Geography 2024 & 2032
- Figure 34: Thailand ASEAN Chemical Logistics Market Revenue (Million), by Country 2024 & 2032
- Figure 35: Thailand ASEAN Chemical Logistics Market Revenue Share (%), by Country 2024 & 2032
- Figure 36: Malaysia ASEAN Chemical Logistics Market Revenue (Million), by Service 2024 & 2032
- Figure 37: Malaysia ASEAN Chemical Logistics Market Revenue Share (%), by Service 2024 & 2032
- Figure 38: Malaysia ASEAN Chemical Logistics Market Revenue (Million), by Mode of Transportation 2024 & 2032
- Figure 39: Malaysia ASEAN Chemical Logistics Market Revenue Share (%), by Mode of Transportation 2024 & 2032
- Figure 40: Malaysia ASEAN Chemical Logistics Market Revenue (Million), by End User 2024 & 2032
- Figure 41: Malaysia ASEAN Chemical Logistics Market Revenue Share (%), by End User 2024 & 2032
- Figure 42: Malaysia ASEAN Chemical Logistics Market Revenue (Million), by Geography 2024 & 2032
- Figure 43: Malaysia ASEAN Chemical Logistics Market Revenue Share (%), by Geography 2024 & 2032
- Figure 44: Malaysia ASEAN Chemical Logistics Market Revenue (Million), by Country 2024 & 2032
- Figure 45: Malaysia ASEAN Chemical Logistics Market Revenue Share (%), by Country 2024 & 2032
- Figure 46: Vietnam ASEAN Chemical Logistics Market Revenue (Million), by Service 2024 & 2032
- Figure 47: Vietnam ASEAN Chemical Logistics Market Revenue Share (%), by Service 2024 & 2032
- Figure 48: Vietnam ASEAN Chemical Logistics Market Revenue (Million), by Mode of Transportation 2024 & 2032
- Figure 49: Vietnam ASEAN Chemical Logistics Market Revenue Share (%), by Mode of Transportation 2024 & 2032
- Figure 50: Vietnam ASEAN Chemical Logistics Market Revenue (Million), by End User 2024 & 2032
- Figure 51: Vietnam ASEAN Chemical Logistics Market Revenue Share (%), by End User 2024 & 2032
- Figure 52: Vietnam ASEAN Chemical Logistics Market Revenue (Million), by Geography 2024 & 2032
- Figure 53: Vietnam ASEAN Chemical Logistics Market Revenue Share (%), by Geography 2024 & 2032
- Figure 54: Vietnam ASEAN Chemical Logistics Market Revenue (Million), by Country 2024 & 2032
- Figure 55: Vietnam ASEAN Chemical Logistics Market Revenue Share (%), by Country 2024 & 2032
- Figure 56: Indonesia ASEAN Chemical Logistics Market Revenue (Million), by Service 2024 & 2032
- Figure 57: Indonesia ASEAN Chemical Logistics Market Revenue Share (%), by Service 2024 & 2032
- Figure 58: Indonesia ASEAN Chemical Logistics Market Revenue (Million), by Mode of Transportation 2024 & 2032
- Figure 59: Indonesia ASEAN Chemical Logistics Market Revenue Share (%), by Mode of Transportation 2024 & 2032
- Figure 60: Indonesia ASEAN Chemical Logistics Market Revenue (Million), by End User 2024 & 2032
- Figure 61: Indonesia ASEAN Chemical Logistics Market Revenue Share (%), by End User 2024 & 2032
- Figure 62: Indonesia ASEAN Chemical Logistics Market Revenue (Million), by Geography 2024 & 2032
- Figure 63: Indonesia ASEAN Chemical Logistics Market Revenue Share (%), by Geography 2024 & 2032
- Figure 64: Indonesia ASEAN Chemical Logistics Market Revenue (Million), by Country 2024 & 2032
- Figure 65: Indonesia ASEAN Chemical Logistics Market Revenue Share (%), by Country 2024 & 2032
- Figure 66: Philippines ASEAN Chemical Logistics Market Revenue (Million), by Service 2024 & 2032
- Figure 67: Philippines ASEAN Chemical Logistics Market Revenue Share (%), by Service 2024 & 2032
- Figure 68: Philippines ASEAN Chemical Logistics Market Revenue (Million), by Mode of Transportation 2024 & 2032
- Figure 69: Philippines ASEAN Chemical Logistics Market Revenue Share (%), by Mode of Transportation 2024 & 2032
- Figure 70: Philippines ASEAN Chemical Logistics Market Revenue (Million), by End User 2024 & 2032
- Figure 71: Philippines ASEAN Chemical Logistics Market Revenue Share (%), by End User 2024 & 2032
- Figure 72: Philippines ASEAN Chemical Logistics Market Revenue (Million), by Geography 2024 & 2032
- Figure 73: Philippines ASEAN Chemical Logistics Market Revenue Share (%), by Geography 2024 & 2032
- Figure 74: Philippines ASEAN Chemical Logistics Market Revenue (Million), by Country 2024 & 2032
- Figure 75: Philippines ASEAN Chemical Logistics Market Revenue Share (%), by Country 2024 & 2032
- Figure 76: Rest of ASEAN ASEAN Chemical Logistics Market Revenue (Million), by Service 2024 & 2032
- Figure 77: Rest of ASEAN ASEAN Chemical Logistics Market Revenue Share (%), by Service 2024 & 2032
- Figure 78: Rest of ASEAN ASEAN Chemical Logistics Market Revenue (Million), by Mode of Transportation 2024 & 2032
- Figure 79: Rest of ASEAN ASEAN Chemical Logistics Market Revenue Share (%), by Mode of Transportation 2024 & 2032
- Figure 80: Rest of ASEAN ASEAN Chemical Logistics Market Revenue (Million), by End User 2024 & 2032
- Figure 81: Rest of ASEAN ASEAN Chemical Logistics Market Revenue Share (%), by End User 2024 & 2032
- Figure 82: Rest of ASEAN ASEAN Chemical Logistics Market Revenue (Million), by Geography 2024 & 2032
- Figure 83: Rest of ASEAN ASEAN Chemical Logistics Market Revenue Share (%), by Geography 2024 & 2032
- Figure 84: Rest of ASEAN ASEAN Chemical Logistics Market Revenue (Million), by Country 2024 & 2032
- Figure 85: Rest of ASEAN ASEAN Chemical Logistics Market Revenue Share (%), by Country 2024 & 2032
List of Tables
- Table 1: Global ASEAN Chemical Logistics Market Revenue Million Forecast, by Region 2019 & 2032
- Table 2: Global ASEAN Chemical Logistics Market Revenue Million Forecast, by Service 2019 & 2032
- Table 3: Global ASEAN Chemical Logistics Market Revenue Million Forecast, by Mode of Transportation 2019 & 2032
- Table 4: Global ASEAN Chemical Logistics Market Revenue Million Forecast, by End User 2019 & 2032
- Table 5: Global ASEAN Chemical Logistics Market Revenue Million Forecast, by Geography 2019 & 2032
- Table 6: Global ASEAN Chemical Logistics Market Revenue Million Forecast, by Region 2019 & 2032
- Table 7: Global ASEAN Chemical Logistics Market Revenue Million Forecast, by Country 2019 & 2032
- Table 8: ASEAN Chemical Logistics Market Revenue (Million) Forecast, by Application 2019 & 2032
- Table 9: Global ASEAN Chemical Logistics Market Revenue Million Forecast, by Country 2019 & 2032
- Table 10: ASEAN Chemical Logistics Market Revenue (Million) Forecast, by Application 2019 & 2032
- Table 11: Global ASEAN Chemical Logistics Market Revenue Million Forecast, by Country 2019 & 2032
- Table 12: ASEAN Chemical Logistics Market Revenue (Million) Forecast, by Application 2019 & 2032
- Table 13: Global ASEAN Chemical Logistics Market Revenue Million Forecast, by Country 2019 & 2032
- Table 14: ASEAN Chemical Logistics Market Revenue (Million) Forecast, by Application 2019 & 2032
- Table 15: Global ASEAN Chemical Logistics Market Revenue Million Forecast, by Country 2019 & 2032
- Table 16: ASEAN Chemical Logistics Market Revenue (Million) Forecast, by Application 2019 & 2032
- Table 17: Global ASEAN Chemical Logistics Market Revenue Million Forecast, by Country 2019 & 2032
- Table 18: ASEAN Chemical Logistics Market Revenue (Million) Forecast, by Application 2019 & 2032
- Table 19: Global ASEAN Chemical Logistics Market Revenue Million Forecast, by Country 2019 & 2032
- Table 20: ASEAN Chemical Logistics Market Revenue (Million) Forecast, by Application 2019 & 2032
- Table 21: Global ASEAN Chemical Logistics Market Revenue Million Forecast, by Service 2019 & 2032
- Table 22: Global ASEAN Chemical Logistics Market Revenue Million Forecast, by Mode of Transportation 2019 & 2032
- Table 23: Global ASEAN Chemical Logistics Market Revenue Million Forecast, by End User 2019 & 2032
- Table 24: Global ASEAN Chemical Logistics Market Revenue Million Forecast, by Geography 2019 & 2032
- Table 25: Global ASEAN Chemical Logistics Market Revenue Million Forecast, by Country 2019 & 2032
- Table 26: Global ASEAN Chemical Logistics Market Revenue Million Forecast, by Service 2019 & 2032
- Table 27: Global ASEAN Chemical Logistics Market Revenue Million Forecast, by Mode of Transportation 2019 & 2032
- Table 28: Global ASEAN Chemical Logistics Market Revenue Million Forecast, by End User 2019 & 2032
- Table 29: Global ASEAN Chemical Logistics Market Revenue Million Forecast, by Geography 2019 & 2032
- Table 30: Global ASEAN Chemical Logistics Market Revenue Million Forecast, by Country 2019 & 2032
- Table 31: Global ASEAN Chemical Logistics Market Revenue Million Forecast, by Service 2019 & 2032
- Table 32: Global ASEAN Chemical Logistics Market Revenue Million Forecast, by Mode of Transportation 2019 & 2032
- Table 33: Global ASEAN Chemical Logistics Market Revenue Million Forecast, by End User 2019 & 2032
- Table 34: Global ASEAN Chemical Logistics Market Revenue Million Forecast, by Geography 2019 & 2032
- Table 35: Global ASEAN Chemical Logistics Market Revenue Million Forecast, by Country 2019 & 2032
- Table 36: Global ASEAN Chemical Logistics Market Revenue Million Forecast, by Service 2019 & 2032
- Table 37: Global ASEAN Chemical Logistics Market Revenue Million Forecast, by Mode of Transportation 2019 & 2032
- Table 38: Global ASEAN Chemical Logistics Market Revenue Million Forecast, by End User 2019 & 2032
- Table 39: Global ASEAN Chemical Logistics Market Revenue Million Forecast, by Geography 2019 & 2032
- Table 40: Global ASEAN Chemical Logistics Market Revenue Million Forecast, by Country 2019 & 2032
- Table 41: Global ASEAN Chemical Logistics Market Revenue Million Forecast, by Service 2019 & 2032
- Table 42: Global ASEAN Chemical Logistics Market Revenue Million Forecast, by Mode of Transportation 2019 & 2032
- Table 43: Global ASEAN Chemical Logistics Market Revenue Million Forecast, by End User 2019 & 2032
- Table 44: Global ASEAN Chemical Logistics Market Revenue Million Forecast, by Geography 2019 & 2032
- Table 45: Global ASEAN Chemical Logistics Market Revenue Million Forecast, by Country 2019 & 2032
- Table 46: Global ASEAN Chemical Logistics Market Revenue Million Forecast, by Service 2019 & 2032
- Table 47: Global ASEAN Chemical Logistics Market Revenue Million Forecast, by Mode of Transportation 2019 & 2032
- Table 48: Global ASEAN Chemical Logistics Market Revenue Million Forecast, by End User 2019 & 2032
- Table 49: Global ASEAN Chemical Logistics Market Revenue Million Forecast, by Geography 2019 & 2032
- Table 50: Global ASEAN Chemical Logistics Market Revenue Million Forecast, by Country 2019 & 2032
- Table 51: Global ASEAN Chemical Logistics Market Revenue Million Forecast, by Service 2019 & 2032
- Table 52: Global ASEAN Chemical Logistics Market Revenue Million Forecast, by Mode of Transportation 2019 & 2032
- Table 53: Global ASEAN Chemical Logistics Market Revenue Million Forecast, by End User 2019 & 2032
- Table 54: Global ASEAN Chemical Logistics Market Revenue Million Forecast, by Geography 2019 & 2032
- Table 55: Global ASEAN Chemical Logistics Market Revenue Million Forecast, by Country 2019 & 2032
Frequently Asked Questions
1. What is the projected Compound Annual Growth Rate (CAGR) of the ASEAN Chemical Logistics Market?
The projected CAGR is approximately > 5.50%.
2. Which companies are prominent players in the ASEAN Chemical Logistics Market?
Key companies in the market include DHL, A&R Logistics, JWD InfoLogistics Public Company Limited, Alps Logistics**List Not Exhaustive, CEVA Logistics, Agility Logistics, CT Logistics, Tiong Nam Logistics Holdings BhD, Eagles Air & Sea, BDP International, Rinchem, Rhenus Logistics.
3. What are the main segments of the ASEAN Chemical Logistics Market?
The market segments include Service, Mode of Transportation, End User, Geography.
4. Can you provide details about the market size?
The market size is estimated to be USD XX Million as of 2022.
5. What are some drivers contributing to market growth?
The Rise in Demand for Specialty Chemicals in ASEAN Countries Increasing Trade Logistics Activity; Partnerships and Collaborations Between Major Players in the Chemical Logistics Market are Being Formed for the Creation of Innovative Goods and Technologically Enhanced Services.
6. What are the notable trends driving market growth?
The Rise in Chemical Production is Expected to Propel the Growth of the Chemical Logistics Market.
7. Are there any restraints impacting market growth?
Complexities Related to Chemical Logistics; High Cost Involved in the Transportation of Chemicals.
8. Can you provide examples of recent developments in the market?
October 2022: Rinchem is nearing the completion of a brand-new chemical warehouse based in Malaysia slated to be ready in Q2 of 2023. While the company currently has two other warehouses in the Asia Pacific (Taiwan & South Korea), this will be Rinchem's first warehouse located in Malaysia. The 45,000 sq. ft. dangerous goods warehouse will have the capacity to store 3100 pallet positions. Rinchem's warehouses are custom-built to support the proper segregation of various hazard classes and to offer multiple temperature zones.
9. What pricing options are available for accessing the report?
Pricing options include single-user, multi-user, and enterprise licenses priced at USD 4750, USD 5250, and USD 8750 respectively.
10. Is the market size provided in terms of value or volume?
The market size is provided in terms of value, measured in Million.
11. Are there any specific market keywords associated with the report?
Yes, the market keyword associated with the report is "ASEAN Chemical Logistics Market," which aids in identifying and referencing the specific market segment covered.
12. How do I determine which pricing option suits my needs best?
The pricing options vary based on user requirements and access needs. Individual users may opt for single-user licenses, while businesses requiring broader access may choose multi-user or enterprise licenses for cost-effective access to the report.
13. Are there any additional resources or data provided in the ASEAN Chemical Logistics Market report?
While the report offers comprehensive insights, it's advisable to review the specific contents or supplementary materials provided to ascertain if additional resources or data are available.
14. How can I stay updated on further developments or reports in the ASEAN Chemical Logistics Market?
To stay informed about further developments, trends, and reports in the ASEAN Chemical Logistics Market, consider subscribing to industry newsletters, following relevant companies and organizations, or regularly checking reputable industry news sources and publications.
Methodology
Step 1 - Identification of Relevant Samples Size from Population Database


Step 2 - Approaches for Defining Global Market Size (Value, Volume* & Price*)

Note*: In applicable scenarios
Step 3 - Data Sources
Primary Research
- Web Analytics
- Survey Reports
- Research Institute
- Latest Research Reports
- Opinion Leaders
Secondary Research
- Annual Reports
- White Paper
- Latest Press Release
- Industry Association
- Paid Database
- Investor Presentations

Step 4 - Data Triangulation
Involves using different sources of information in order to increase the validity of a study
These sources are likely to be stakeholders in a program - participants, other researchers, program staff, other community members, and so on.
Then we put all data in single framework & apply various statistical tools to find out the dynamic on the market.
During the analysis stage, feedback from the stakeholder groups would be compared to determine areas of agreement as well as areas of divergence
