

Key Insights
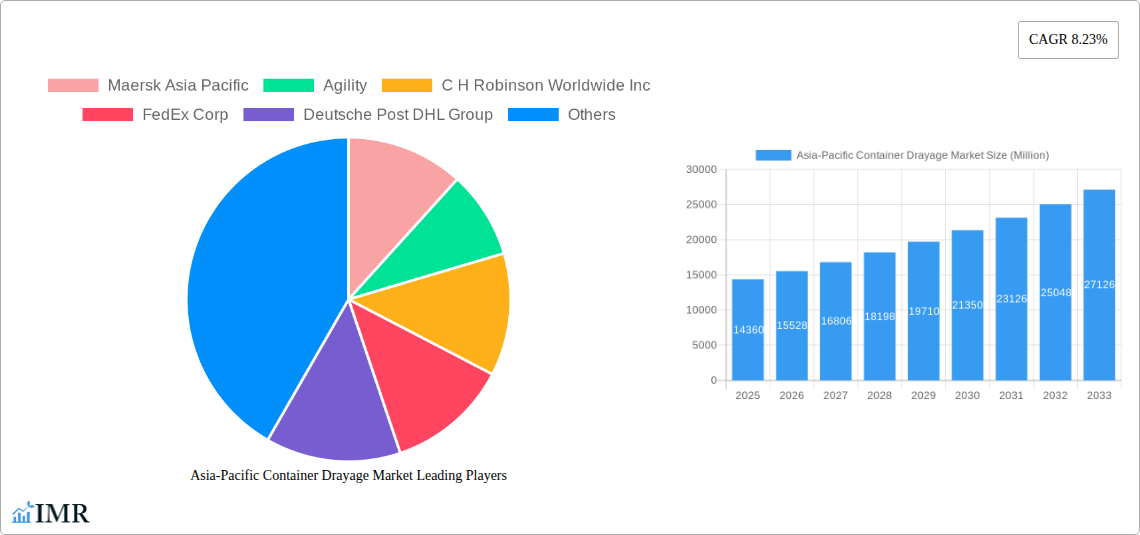
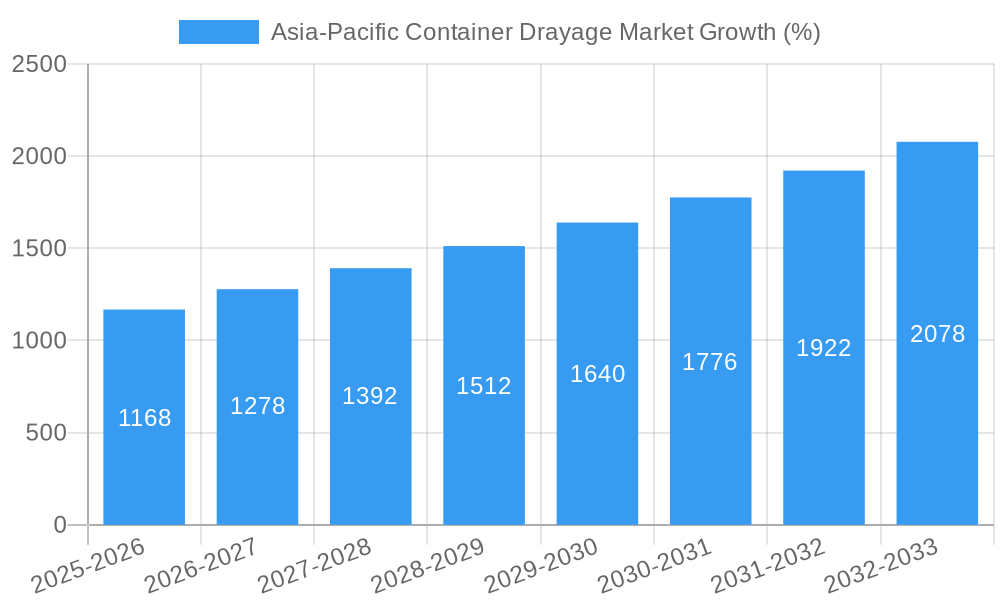
The Asia-Pacific container drayage market, valued at $14.36 billion in 2025, is poised for robust growth, exhibiting a compound annual growth rate (CAGR) of 8.23% from 2025 to 2033. This expansion is fueled by several key factors. The burgeoning e-commerce sector in the region significantly boosts demand for efficient last-mile delivery solutions, driving the need for reliable container drayage services. Furthermore, increasing port congestion and the rising costs of inland transportation are compelling businesses to optimize their supply chains, making container drayage a crucial component. Investments in infrastructure improvements, including improved road networks and intermodal transportation facilities, are also contributing to market growth. While challenges remain, such as driver shortages and fluctuating fuel prices, innovative solutions like improved route optimization software and the adoption of autonomous vehicles are mitigating these concerns and paving the way for continued market expansion. The market is segmented by various factors including transportation mode (rail, road, etc.), cargo type, and service provider type (3PL, integrated logistics providers etc.). Key players like Maersk Asia Pacific, Agility, C.H. Robinson, FedEx, DHL, and others are actively shaping market dynamics through strategic partnerships, technological advancements, and geographical expansion.
The forecast period (2025-2033) suggests continued growth, driven by the aforementioned factors, along with the increasing adoption of technology like digital freight matching platforms to enhance operational efficiency. The competitive landscape is characterized by a mix of large multinational logistics companies and smaller regional players, leading to a dynamic market where innovation and customer service are vital for success. The geographic distribution of the market is likely skewed toward major port cities and economic hubs within the Asia-Pacific region, reflecting the concentration of import/export activities. While precise regional breakdowns are not provided, market penetration in rapidly developing economies is expected to increase significantly during the forecast period.
Asia-Pacific Container Drayage Market: A Comprehensive Report (2019-2033)
This comprehensive report provides a detailed analysis of the Asia-Pacific Container Drayage Market, offering invaluable insights for industry professionals, investors, and strategic decision-makers. With a study period spanning 2019-2033 (base year 2025, forecast period 2025-2033), this report leverages extensive data analysis to project market trends and identify lucrative opportunities within this dynamic sector. The market is segmented by various factors to provide a granular understanding of the competitive landscape and growth drivers.
Asia-Pacific Container Drayage Market Market Dynamics & Structure
This section delves into the intricate dynamics of the Asia-Pacific container drayage market, analyzing its structure and influencing factors. The market exhibits a moderately concentrated structure, with a few dominant players and a significant number of smaller regional operators. The market share of the top five players is estimated at xx%, while the remaining xx% is shared among numerous smaller players.
Market Concentration & Competition:
- High competition among established players and emerging regional companies
- Market share consolidation driven by mergers and acquisitions (M&A) activities
- Strategic alliances and partnerships to enhance market reach and operational efficiency
- Intense price competition, especially in the segment with high supply
- Differentiation through specialized services and technological integration
Technological Innovation:
- Adoption of telematics and IoT solutions to improve visibility and efficiency
- Implementation of AI-powered route optimization and predictive analytics
- Growing integration of blockchain technology for enhanced transparency and security
- Focus on driver safety and automation through advanced driver-assistance systems (ADAS)
- Development of sustainable solutions, including electric and hybrid vehicles
Regulatory Frameworks & Compliance:
- Varying regulations across different countries and regions impacting operational costs and efficiency.
- Stricter emission standards driving adoption of cleaner technologies
- Labor laws and regulations affecting driver wages and working conditions
- International trade agreements impacting cross-border transportation
- Infrastructure development and maintenance influencing the cost of transportation
Competitive Product Substitutes:
- Rail freight and inland waterway transportation as alternatives in specific regions.
- Intermodal transportation offering cost-effective solutions for long distances
- Technological advancements in other modes of transportation posing competition
- Emerging last-mile delivery solutions impacting the demand for drayage services.
End-User Demographics:
- Growing demand from e-commerce and retail sectors
- Increased reliance on containerized transportation by manufacturing companies
- Significant contributions from food and beverage and consumer goods sectors
- Market expansion driven by rising population and industrial activities.
M&A Trends:
- Recent M&A activities focused on expansion into new markets and service diversification.
- Acquisition of smaller companies to strengthen market position and operational efficiency.
- Consolidation expected to intensify to achieve economies of scale and improve market dominance.
Asia-Pacific Container Drayage Market Growth Trends & Insights
The Asia-Pacific container drayage market is experiencing robust growth, propelled by a surge in global trade, escalating e-commerce activities, and substantial investments in port infrastructure and logistics networks. The market size is projected to reach xx Million units by 2025, exhibiting a CAGR of xx% during the forecast period (2025-2033). This growth trajectory is significantly influenced by increasing consumer spending, industrial expansion, and efficient supply chain management. Technological disruptions, such as the deployment of telematics and IoT-enabled solutions, further accelerate adoption rates and process optimization.
Changes in consumer behaviour, particularly the rise of e-commerce, are driving the need for faster and more efficient last-mile delivery solutions, directly impacting the demand for drayage services. Market penetration rates are increasing as more businesses recognize the cost-effectiveness and efficiency gains associated with utilizing container drayage. The market is segmented into various types based on transportation mode (road, rail, intermodal), container type, and cargo type, each displaying distinct growth patterns influenced by varying factors. Certain regional markets within the Asia-Pacific, owing to robust economic development and favourable government policies, are projected to witness considerably higher growth rates compared to others.
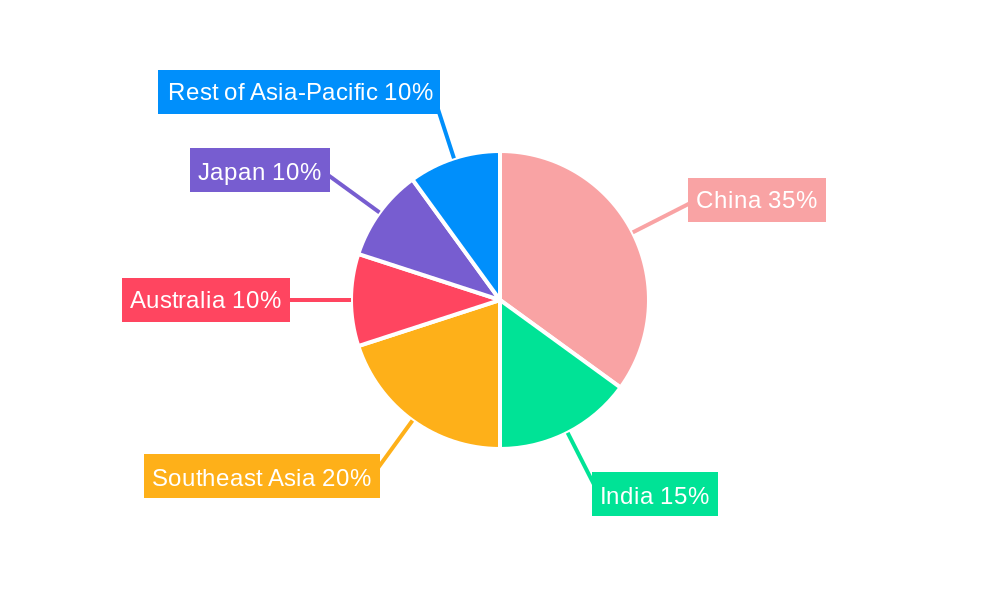
Dominant Regions, Countries, or Segments in Asia-Pacific Container Drayage Market
China, India, and Singapore are the leading countries driving the growth of the Asia-Pacific container drayage market. This dominance is attributable to several key factors:
- China:
- Massive manufacturing base and exports
- Extensive port infrastructure and growing e-commerce sector
- Government initiatives promoting infrastructure development and logistics efficiency.
- India:
- Rapid economic growth and rising industrialization
- Government investments in port modernization and infrastructure development
- Growing consumer spending and expansion of e-commerce.
- Singapore:
- Strategic location and highly developed port facilities (Port of Singapore)
- Efficient logistics network and supportive government policies
- Strong presence of multinational companies in shipping and logistics.
These countries account for a significant share of the overall market size and are projected to continue to be major contributors to market growth in the coming years. Other key regional markets include Japan, South Korea, Australia, and Southeast Asian nations. The growth potential varies based on factors such as the level of economic development, infrastructure quality, and supportive government policies. These growth dynamics are analyzed in detail in the report.
Asia-Pacific Container Drayage Market Product Landscape
The Asia-Pacific container drayage market offers a range of services including over-the-road trucking, rail drayage, and intermodal solutions, each tailored to the specific needs of customers. Recent technological innovations have introduced intelligent transportation systems and optimization software, improving efficiency and reducing transportation costs. The market is witnessing a surge in the adoption of environmentally friendly solutions, including electric and hybrid trucks, to meet rising sustainability concerns. Companies are increasingly differentiating themselves through value-added services, such as real-time tracking, efficient customs clearance, and improved inventory management capabilities.
Key Drivers, Barriers & Challenges in Asia-Pacific Container Drayage Market
Key Drivers:
The growth of the Asia-Pacific container drayage market is fueled by several key factors: the rapid expansion of e-commerce, rising consumer spending, and robust industrial growth, driving the demand for efficient transportation solutions. Furthermore, government investments in infrastructure development and port modernization create favourable conditions for market expansion. Technological advancements such as IoT and AI are also improving operational efficiency and optimizing logistics processes.
Challenges & Restraints:
Several challenges hinder the growth of the Asia-Pacific container drayage market, including: driver shortages, increasing fuel prices, and stringent environmental regulations, impacting operational costs. Furthermore, intense competition, regulatory hurdles, and traffic congestion in major cities pose significant operational barriers. Supply chain disruptions and fluctuating global trade volumes also contribute to market volatility.
Emerging Opportunities in Asia-Pacific Container Drayage Market
Emerging opportunities lie in the adoption of innovative technologies like AI-powered route optimization, the use of electric vehicles to reduce environmental impact, and the development of specialized drayage solutions for niche markets such as temperature-sensitive goods. Untapped markets in less-developed regions offer considerable growth potential, while the increasing demand for last-mile delivery services presents a unique opportunity for specialized providers.
Growth Accelerators in the Asia-Pacific Container Drayage Market Industry
Long-term growth in the Asia-Pacific container drayage market will be spurred by technological advancements such as autonomous vehicles and improved infrastructure development initiatives by governments in the region. Strategic partnerships between drayage companies and technology providers will foster efficiency gains and improve service offerings. Expansion into underserved markets and diversification of services will unlock new avenues for growth.
Key Players Shaping the Asia-Pacific Container Drayage Market Market
- Maersk Asia Pacific
- Agility
- C H Robinson Worldwide Inc
- FedEx Corp
- Deutsche Post DHL Group
- Hitachi Ltd
- CMA CGM SA Group
- DB Schenker
- United Parcel Services Inc
- Ceva Logistics
- Yusen Logistics Co Ltd
- 63 Other Companies
Notable Milestones in Asia-Pacific Container Drayage Market Sector
- July 2024: DP World launches 51 new freight forwarding offices across the Asia-Pacific, expanding its reach in air and ocean freight.
- February 2024: HERE Technologies partners with PSA Singapore to improve container truck efficiency within Singapore's terminals.
In-Depth Asia-Pacific Container Drayage Market Market Outlook
The Asia-Pacific container drayage market is poised for significant growth, driven by expanding e-commerce, investments in infrastructure, and technological advancements. Opportunities exist for companies to leverage innovative technologies and strategic partnerships to enhance efficiency and expand market share. The market's future potential is significant, with substantial opportunities for growth and innovation across various segments. This report provides the necessary insights for stakeholders to capitalize on these promising trends.
Asia-Pacific Container Drayage Market Segmentation
-
1. Mode of Transport
- 1.1. Rail
- 1.2. Road
- 1.3. Other Modes of Transport
-
2. Geography
- 2.1. China
- 2.2. Japan
- 2.3. India
- 2.4. South Korea
- 2.5. Indonesia
- 2.6. Vietnam
- 2.7. Australia
- 2.8. Rest of Asia-Pacific
Asia-Pacific Container Drayage Market Segmentation By Geography
- 1. China
- 2. Japan
- 3. India
- 4. South Korea
- 5. Indonesia
- 6. Vietnam
- 7. Australia
- 8. Rest of Asia Pacific
Asia-Pacific Container Drayage Market REPORT HIGHLIGHTS
| Aspects | Details |
|---|---|
| Study Period | 2019-2033 |
| Base Year | 2024 |
| Estimated Year | 2025 |
| Forecast Period | 2025-2033 |
| Historical Period | 2019-2024 |
| Growth Rate | CAGR of 8.23% from 2019-2033 |
| Segmentation |
|
Table of Contents
- 1. Introduction
- 1.1. Research Scope
- 1.2. Market Segmentation
- 1.3. Research Methodology
- 1.4. Definitions and Assumptions
- 2. Executive Summary
- 2.1. Introduction
- 3. Market Dynamics
- 3.1. Introduction
- 3.2. Market Drivers
- 3.2.1. 4.; Increasing Railway Trade4.; Growing E-commerce Sector
- 3.3. Market Restrains
- 3.3.1. 4.; Increasing Railway Trade4.; Growing E-commerce Sector
- 3.4. Market Trends
- 3.4.1 Port Congestion Easing in Key Asian Hubs
- 3.4.2 Surge in Demand for Container Drayage Driving the Transportation Segment
- 4. Market Factor Analysis
- 4.1. Porters Five Forces
- 4.2. Supply/Value Chain
- 4.3. PESTEL analysis
- 4.4. Market Entropy
- 4.5. Patent/Trademark Analysis
- 5. Global Asia-Pacific Container Drayage Market Analysis, Insights and Forecast, 2019-2031
- 5.1. Market Analysis, Insights and Forecast - by Mode of Transport
- 5.1.1. Rail
- 5.1.2. Road
- 5.1.3. Other Modes of Transport
- 5.2. Market Analysis, Insights and Forecast - by Geography
- 5.2.1. China
- 5.2.2. Japan
- 5.2.3. India
- 5.2.4. South Korea
- 5.2.5. Indonesia
- 5.2.6. Vietnam
- 5.2.7. Australia
- 5.2.8. Rest of Asia-Pacific
- 5.3. Market Analysis, Insights and Forecast - by Region
- 5.3.1. China
- 5.3.2. Japan
- 5.3.3. India
- 5.3.4. South Korea
- 5.3.5. Indonesia
- 5.3.6. Vietnam
- 5.3.7. Australia
- 5.3.8. Rest of Asia Pacific
- 5.1. Market Analysis, Insights and Forecast - by Mode of Transport
- 6. China Asia-Pacific Container Drayage Market Analysis, Insights and Forecast, 2019-2031
- 6.1. Market Analysis, Insights and Forecast - by Mode of Transport
- 6.1.1. Rail
- 6.1.2. Road
- 6.1.3. Other Modes of Transport
- 6.2. Market Analysis, Insights and Forecast - by Geography
- 6.2.1. China
- 6.2.2. Japan
- 6.2.3. India
- 6.2.4. South Korea
- 6.2.5. Indonesia
- 6.2.6. Vietnam
- 6.2.7. Australia
- 6.2.8. Rest of Asia-Pacific
- 6.1. Market Analysis, Insights and Forecast - by Mode of Transport
- 7. Japan Asia-Pacific Container Drayage Market Analysis, Insights and Forecast, 2019-2031
- 7.1. Market Analysis, Insights and Forecast - by Mode of Transport
- 7.1.1. Rail
- 7.1.2. Road
- 7.1.3. Other Modes of Transport
- 7.2. Market Analysis, Insights and Forecast - by Geography
- 7.2.1. China
- 7.2.2. Japan
- 7.2.3. India
- 7.2.4. South Korea
- 7.2.5. Indonesia
- 7.2.6. Vietnam
- 7.2.7. Australia
- 7.2.8. Rest of Asia-Pacific
- 7.1. Market Analysis, Insights and Forecast - by Mode of Transport
- 8. India Asia-Pacific Container Drayage Market Analysis, Insights and Forecast, 2019-2031
- 8.1. Market Analysis, Insights and Forecast - by Mode of Transport
- 8.1.1. Rail
- 8.1.2. Road
- 8.1.3. Other Modes of Transport
- 8.2. Market Analysis, Insights and Forecast - by Geography
- 8.2.1. China
- 8.2.2. Japan
- 8.2.3. India
- 8.2.4. South Korea
- 8.2.5. Indonesia
- 8.2.6. Vietnam
- 8.2.7. Australia
- 8.2.8. Rest of Asia-Pacific
- 8.1. Market Analysis, Insights and Forecast - by Mode of Transport
- 9. South Korea Asia-Pacific Container Drayage Market Analysis, Insights and Forecast, 2019-2031
- 9.1. Market Analysis, Insights and Forecast - by Mode of Transport
- 9.1.1. Rail
- 9.1.2. Road
- 9.1.3. Other Modes of Transport
- 9.2. Market Analysis, Insights and Forecast - by Geography
- 9.2.1. China
- 9.2.2. Japan
- 9.2.3. India
- 9.2.4. South Korea
- 9.2.5. Indonesia
- 9.2.6. Vietnam
- 9.2.7. Australia
- 9.2.8. Rest of Asia-Pacific
- 9.1. Market Analysis, Insights and Forecast - by Mode of Transport
- 10. Indonesia Asia-Pacific Container Drayage Market Analysis, Insights and Forecast, 2019-2031
- 10.1. Market Analysis, Insights and Forecast - by Mode of Transport
- 10.1.1. Rail
- 10.1.2. Road
- 10.1.3. Other Modes of Transport
- 10.2. Market Analysis, Insights and Forecast - by Geography
- 10.2.1. China
- 10.2.2. Japan
- 10.2.3. India
- 10.2.4. South Korea
- 10.2.5. Indonesia
- 10.2.6. Vietnam
- 10.2.7. Australia
- 10.2.8. Rest of Asia-Pacific
- 10.1. Market Analysis, Insights and Forecast - by Mode of Transport
- 11. Vietnam Asia-Pacific Container Drayage Market Analysis, Insights and Forecast, 2019-2031
- 11.1. Market Analysis, Insights and Forecast - by Mode of Transport
- 11.1.1. Rail
- 11.1.2. Road
- 11.1.3. Other Modes of Transport
- 11.2. Market Analysis, Insights and Forecast - by Geography
- 11.2.1. China
- 11.2.2. Japan
- 11.2.3. India
- 11.2.4. South Korea
- 11.2.5. Indonesia
- 11.2.6. Vietnam
- 11.2.7. Australia
- 11.2.8. Rest of Asia-Pacific
- 11.1. Market Analysis, Insights and Forecast - by Mode of Transport
- 12. Australia Asia-Pacific Container Drayage Market Analysis, Insights and Forecast, 2019-2031
- 12.1. Market Analysis, Insights and Forecast - by Mode of Transport
- 12.1.1. Rail
- 12.1.2. Road
- 12.1.3. Other Modes of Transport
- 12.2. Market Analysis, Insights and Forecast - by Geography
- 12.2.1. China
- 12.2.2. Japan
- 12.2.3. India
- 12.2.4. South Korea
- 12.2.5. Indonesia
- 12.2.6. Vietnam
- 12.2.7. Australia
- 12.2.8. Rest of Asia-Pacific
- 12.1. Market Analysis, Insights and Forecast - by Mode of Transport
- 13. Rest of Asia Pacific Asia-Pacific Container Drayage Market Analysis, Insights and Forecast, 2019-2031
- 13.1. Market Analysis, Insights and Forecast - by Mode of Transport
- 13.1.1. Rail
- 13.1.2. Road
- 13.1.3. Other Modes of Transport
- 13.2. Market Analysis, Insights and Forecast - by Geography
- 13.2.1. China
- 13.2.2. Japan
- 13.2.3. India
- 13.2.4. South Korea
- 13.2.5. Indonesia
- 13.2.6. Vietnam
- 13.2.7. Australia
- 13.2.8. Rest of Asia-Pacific
- 13.1. Market Analysis, Insights and Forecast - by Mode of Transport
- 14. Competitive Analysis
- 14.1. Global Market Share Analysis 2024
- 14.2. Company Profiles
- 14.2.1 Maersk Asia Pacific
- 14.2.1.1. Overview
- 14.2.1.2. Products
- 14.2.1.3. SWOT Analysis
- 14.2.1.4. Recent Developments
- 14.2.1.5. Financials (Based on Availability)
- 14.2.2 Agility
- 14.2.2.1. Overview
- 14.2.2.2. Products
- 14.2.2.3. SWOT Analysis
- 14.2.2.4. Recent Developments
- 14.2.2.5. Financials (Based on Availability)
- 14.2.3 C H Robinson Worldwide Inc
- 14.2.3.1. Overview
- 14.2.3.2. Products
- 14.2.3.3. SWOT Analysis
- 14.2.3.4. Recent Developments
- 14.2.3.5. Financials (Based on Availability)
- 14.2.4 FedEx Corp
- 14.2.4.1. Overview
- 14.2.4.2. Products
- 14.2.4.3. SWOT Analysis
- 14.2.4.4. Recent Developments
- 14.2.4.5. Financials (Based on Availability)
- 14.2.5 Deutsche Post DHL Group
- 14.2.5.1. Overview
- 14.2.5.2. Products
- 14.2.5.3. SWOT Analysis
- 14.2.5.4. Recent Developments
- 14.2.5.5. Financials (Based on Availability)
- 14.2.6 Hitachi Ltd
- 14.2.6.1. Overview
- 14.2.6.2. Products
- 14.2.6.3. SWOT Analysis
- 14.2.6.4. Recent Developments
- 14.2.6.5. Financials (Based on Availability)
- 14.2.7 CMA CGM SA Group
- 14.2.7.1. Overview
- 14.2.7.2. Products
- 14.2.7.3. SWOT Analysis
- 14.2.7.4. Recent Developments
- 14.2.7.5. Financials (Based on Availability)
- 14.2.8 DB Schenker
- 14.2.8.1. Overview
- 14.2.8.2. Products
- 14.2.8.3. SWOT Analysis
- 14.2.8.4. Recent Developments
- 14.2.8.5. Financials (Based on Availability)
- 14.2.9 United Parcel Services Inc
- 14.2.9.1. Overview
- 14.2.9.2. Products
- 14.2.9.3. SWOT Analysis
- 14.2.9.4. Recent Developments
- 14.2.9.5. Financials (Based on Availability)
- 14.2.10 Ceva Logistics
- 14.2.10.1. Overview
- 14.2.10.2. Products
- 14.2.10.3. SWOT Analysis
- 14.2.10.4. Recent Developments
- 14.2.10.5. Financials (Based on Availability)
- 14.2.11 Yusen Logistics Co Ltd**List Not Exhaustive 6 3 Other Companie
- 14.2.11.1. Overview
- 14.2.11.2. Products
- 14.2.11.3. SWOT Analysis
- 14.2.11.4. Recent Developments
- 14.2.11.5. Financials (Based on Availability)
- 14.2.1 Maersk Asia Pacific
List of Figures
- Figure 1: Global Asia-Pacific Container Drayage Market Revenue Breakdown (Million, %) by Region 2024 & 2032
- Figure 2: Global Asia-Pacific Container Drayage Market Volume Breakdown (Billion, %) by Region 2024 & 2032
- Figure 3: China Asia-Pacific Container Drayage Market Revenue (Million), by Mode of Transport 2024 & 2032
- Figure 4: China Asia-Pacific Container Drayage Market Volume (Billion), by Mode of Transport 2024 & 2032
- Figure 5: China Asia-Pacific Container Drayage Market Revenue Share (%), by Mode of Transport 2024 & 2032
- Figure 6: China Asia-Pacific Container Drayage Market Volume Share (%), by Mode of Transport 2024 & 2032
- Figure 7: China Asia-Pacific Container Drayage Market Revenue (Million), by Geography 2024 & 2032
- Figure 8: China Asia-Pacific Container Drayage Market Volume (Billion), by Geography 2024 & 2032
- Figure 9: China Asia-Pacific Container Drayage Market Revenue Share (%), by Geography 2024 & 2032
- Figure 10: China Asia-Pacific Container Drayage Market Volume Share (%), by Geography 2024 & 2032
- Figure 11: China Asia-Pacific Container Drayage Market Revenue (Million), by Country 2024 & 2032
- Figure 12: China Asia-Pacific Container Drayage Market Volume (Billion), by Country 2024 & 2032
- Figure 13: China Asia-Pacific Container Drayage Market Revenue Share (%), by Country 2024 & 2032
- Figure 14: China Asia-Pacific Container Drayage Market Volume Share (%), by Country 2024 & 2032
- Figure 15: Japan Asia-Pacific Container Drayage Market Revenue (Million), by Mode of Transport 2024 & 2032
- Figure 16: Japan Asia-Pacific Container Drayage Market Volume (Billion), by Mode of Transport 2024 & 2032
- Figure 17: Japan Asia-Pacific Container Drayage Market Revenue Share (%), by Mode of Transport 2024 & 2032
- Figure 18: Japan Asia-Pacific Container Drayage Market Volume Share (%), by Mode of Transport 2024 & 2032
- Figure 19: Japan Asia-Pacific Container Drayage Market Revenue (Million), by Geography 2024 & 2032
- Figure 20: Japan Asia-Pacific Container Drayage Market Volume (Billion), by Geography 2024 & 2032
- Figure 21: Japan Asia-Pacific Container Drayage Market Revenue Share (%), by Geography 2024 & 2032
- Figure 22: Japan Asia-Pacific Container Drayage Market Volume Share (%), by Geography 2024 & 2032
- Figure 23: Japan Asia-Pacific Container Drayage Market Revenue (Million), by Country 2024 & 2032
- Figure 24: Japan Asia-Pacific Container Drayage Market Volume (Billion), by Country 2024 & 2032
- Figure 25: Japan Asia-Pacific Container Drayage Market Revenue Share (%), by Country 2024 & 2032
- Figure 26: Japan Asia-Pacific Container Drayage Market Volume Share (%), by Country 2024 & 2032
- Figure 27: India Asia-Pacific Container Drayage Market Revenue (Million), by Mode of Transport 2024 & 2032
- Figure 28: India Asia-Pacific Container Drayage Market Volume (Billion), by Mode of Transport 2024 & 2032
- Figure 29: India Asia-Pacific Container Drayage Market Revenue Share (%), by Mode of Transport 2024 & 2032
- Figure 30: India Asia-Pacific Container Drayage Market Volume Share (%), by Mode of Transport 2024 & 2032
- Figure 31: India Asia-Pacific Container Drayage Market Revenue (Million), by Geography 2024 & 2032
- Figure 32: India Asia-Pacific Container Drayage Market Volume (Billion), by Geography 2024 & 2032
- Figure 33: India Asia-Pacific Container Drayage Market Revenue Share (%), by Geography 2024 & 2032
- Figure 34: India Asia-Pacific Container Drayage Market Volume Share (%), by Geography 2024 & 2032
- Figure 35: India Asia-Pacific Container Drayage Market Revenue (Million), by Country 2024 & 2032
- Figure 36: India Asia-Pacific Container Drayage Market Volume (Billion), by Country 2024 & 2032
- Figure 37: India Asia-Pacific Container Drayage Market Revenue Share (%), by Country 2024 & 2032
- Figure 38: India Asia-Pacific Container Drayage Market Volume Share (%), by Country 2024 & 2032
- Figure 39: South Korea Asia-Pacific Container Drayage Market Revenue (Million), by Mode of Transport 2024 & 2032
- Figure 40: South Korea Asia-Pacific Container Drayage Market Volume (Billion), by Mode of Transport 2024 & 2032
- Figure 41: South Korea Asia-Pacific Container Drayage Market Revenue Share (%), by Mode of Transport 2024 & 2032
- Figure 42: South Korea Asia-Pacific Container Drayage Market Volume Share (%), by Mode of Transport 2024 & 2032
- Figure 43: South Korea Asia-Pacific Container Drayage Market Revenue (Million), by Geography 2024 & 2032
- Figure 44: South Korea Asia-Pacific Container Drayage Market Volume (Billion), by Geography 2024 & 2032
- Figure 45: South Korea Asia-Pacific Container Drayage Market Revenue Share (%), by Geography 2024 & 2032
- Figure 46: South Korea Asia-Pacific Container Drayage Market Volume Share (%), by Geography 2024 & 2032
- Figure 47: South Korea Asia-Pacific Container Drayage Market Revenue (Million), by Country 2024 & 2032
- Figure 48: South Korea Asia-Pacific Container Drayage Market Volume (Billion), by Country 2024 & 2032
- Figure 49: South Korea Asia-Pacific Container Drayage Market Revenue Share (%), by Country 2024 & 2032
- Figure 50: South Korea Asia-Pacific Container Drayage Market Volume Share (%), by Country 2024 & 2032
- Figure 51: Indonesia Asia-Pacific Container Drayage Market Revenue (Million), by Mode of Transport 2024 & 2032
- Figure 52: Indonesia Asia-Pacific Container Drayage Market Volume (Billion), by Mode of Transport 2024 & 2032
- Figure 53: Indonesia Asia-Pacific Container Drayage Market Revenue Share (%), by Mode of Transport 2024 & 2032
- Figure 54: Indonesia Asia-Pacific Container Drayage Market Volume Share (%), by Mode of Transport 2024 & 2032
- Figure 55: Indonesia Asia-Pacific Container Drayage Market Revenue (Million), by Geography 2024 & 2032
- Figure 56: Indonesia Asia-Pacific Container Drayage Market Volume (Billion), by Geography 2024 & 2032
- Figure 57: Indonesia Asia-Pacific Container Drayage Market Revenue Share (%), by Geography 2024 & 2032
- Figure 58: Indonesia Asia-Pacific Container Drayage Market Volume Share (%), by Geography 2024 & 2032
- Figure 59: Indonesia Asia-Pacific Container Drayage Market Revenue (Million), by Country 2024 & 2032
- Figure 60: Indonesia Asia-Pacific Container Drayage Market Volume (Billion), by Country 2024 & 2032
- Figure 61: Indonesia Asia-Pacific Container Drayage Market Revenue Share (%), by Country 2024 & 2032
- Figure 62: Indonesia Asia-Pacific Container Drayage Market Volume Share (%), by Country 2024 & 2032
- Figure 63: Vietnam Asia-Pacific Container Drayage Market Revenue (Million), by Mode of Transport 2024 & 2032
- Figure 64: Vietnam Asia-Pacific Container Drayage Market Volume (Billion), by Mode of Transport 2024 & 2032
- Figure 65: Vietnam Asia-Pacific Container Drayage Market Revenue Share (%), by Mode of Transport 2024 & 2032
- Figure 66: Vietnam Asia-Pacific Container Drayage Market Volume Share (%), by Mode of Transport 2024 & 2032
- Figure 67: Vietnam Asia-Pacific Container Drayage Market Revenue (Million), by Geography 2024 & 2032
- Figure 68: Vietnam Asia-Pacific Container Drayage Market Volume (Billion), by Geography 2024 & 2032
- Figure 69: Vietnam Asia-Pacific Container Drayage Market Revenue Share (%), by Geography 2024 & 2032
- Figure 70: Vietnam Asia-Pacific Container Drayage Market Volume Share (%), by Geography 2024 & 2032
- Figure 71: Vietnam Asia-Pacific Container Drayage Market Revenue (Million), by Country 2024 & 2032
- Figure 72: Vietnam Asia-Pacific Container Drayage Market Volume (Billion), by Country 2024 & 2032
- Figure 73: Vietnam Asia-Pacific Container Drayage Market Revenue Share (%), by Country 2024 & 2032
- Figure 74: Vietnam Asia-Pacific Container Drayage Market Volume Share (%), by Country 2024 & 2032
- Figure 75: Australia Asia-Pacific Container Drayage Market Revenue (Million), by Mode of Transport 2024 & 2032
- Figure 76: Australia Asia-Pacific Container Drayage Market Volume (Billion), by Mode of Transport 2024 & 2032
- Figure 77: Australia Asia-Pacific Container Drayage Market Revenue Share (%), by Mode of Transport 2024 & 2032
- Figure 78: Australia Asia-Pacific Container Drayage Market Volume Share (%), by Mode of Transport 2024 & 2032
- Figure 79: Australia Asia-Pacific Container Drayage Market Revenue (Million), by Geography 2024 & 2032
- Figure 80: Australia Asia-Pacific Container Drayage Market Volume (Billion), by Geography 2024 & 2032
- Figure 81: Australia Asia-Pacific Container Drayage Market Revenue Share (%), by Geography 2024 & 2032
- Figure 82: Australia Asia-Pacific Container Drayage Market Volume Share (%), by Geography 2024 & 2032
- Figure 83: Australia Asia-Pacific Container Drayage Market Revenue (Million), by Country 2024 & 2032
- Figure 84: Australia Asia-Pacific Container Drayage Market Volume (Billion), by Country 2024 & 2032
- Figure 85: Australia Asia-Pacific Container Drayage Market Revenue Share (%), by Country 2024 & 2032
- Figure 86: Australia Asia-Pacific Container Drayage Market Volume Share (%), by Country 2024 & 2032
- Figure 87: Rest of Asia Pacific Asia-Pacific Container Drayage Market Revenue (Million), by Mode of Transport 2024 & 2032
- Figure 88: Rest of Asia Pacific Asia-Pacific Container Drayage Market Volume (Billion), by Mode of Transport 2024 & 2032
- Figure 89: Rest of Asia Pacific Asia-Pacific Container Drayage Market Revenue Share (%), by Mode of Transport 2024 & 2032
- Figure 90: Rest of Asia Pacific Asia-Pacific Container Drayage Market Volume Share (%), by Mode of Transport 2024 & 2032
- Figure 91: Rest of Asia Pacific Asia-Pacific Container Drayage Market Revenue (Million), by Geography 2024 & 2032
- Figure 92: Rest of Asia Pacific Asia-Pacific Container Drayage Market Volume (Billion), by Geography 2024 & 2032
- Figure 93: Rest of Asia Pacific Asia-Pacific Container Drayage Market Revenue Share (%), by Geography 2024 & 2032
- Figure 94: Rest of Asia Pacific Asia-Pacific Container Drayage Market Volume Share (%), by Geography 2024 & 2032
- Figure 95: Rest of Asia Pacific Asia-Pacific Container Drayage Market Revenue (Million), by Country 2024 & 2032
- Figure 96: Rest of Asia Pacific Asia-Pacific Container Drayage Market Volume (Billion), by Country 2024 & 2032
- Figure 97: Rest of Asia Pacific Asia-Pacific Container Drayage Market Revenue Share (%), by Country 2024 & 2032
- Figure 98: Rest of Asia Pacific Asia-Pacific Container Drayage Market Volume Share (%), by Country 2024 & 2032
List of Tables
- Table 1: Global Asia-Pacific Container Drayage Market Revenue Million Forecast, by Region 2019 & 2032
- Table 2: Global Asia-Pacific Container Drayage Market Volume Billion Forecast, by Region 2019 & 2032
- Table 3: Global Asia-Pacific Container Drayage Market Revenue Million Forecast, by Mode of Transport 2019 & 2032
- Table 4: Global Asia-Pacific Container Drayage Market Volume Billion Forecast, by Mode of Transport 2019 & 2032
- Table 5: Global Asia-Pacific Container Drayage Market Revenue Million Forecast, by Geography 2019 & 2032
- Table 6: Global Asia-Pacific Container Drayage Market Volume Billion Forecast, by Geography 2019 & 2032
- Table 7: Global Asia-Pacific Container Drayage Market Revenue Million Forecast, by Region 2019 & 2032
- Table 8: Global Asia-Pacific Container Drayage Market Volume Billion Forecast, by Region 2019 & 2032
- Table 9: Global Asia-Pacific Container Drayage Market Revenue Million Forecast, by Mode of Transport 2019 & 2032
- Table 10: Global Asia-Pacific Container Drayage Market Volume Billion Forecast, by Mode of Transport 2019 & 2032
- Table 11: Global Asia-Pacific Container Drayage Market Revenue Million Forecast, by Geography 2019 & 2032
- Table 12: Global Asia-Pacific Container Drayage Market Volume Billion Forecast, by Geography 2019 & 2032
- Table 13: Global Asia-Pacific Container Drayage Market Revenue Million Forecast, by Country 2019 & 2032
- Table 14: Global Asia-Pacific Container Drayage Market Volume Billion Forecast, by Country 2019 & 2032
- Table 15: Global Asia-Pacific Container Drayage Market Revenue Million Forecast, by Mode of Transport 2019 & 2032
- Table 16: Global Asia-Pacific Container Drayage Market Volume Billion Forecast, by Mode of Transport 2019 & 2032
- Table 17: Global Asia-Pacific Container Drayage Market Revenue Million Forecast, by Geography 2019 & 2032
- Table 18: Global Asia-Pacific Container Drayage Market Volume Billion Forecast, by Geography 2019 & 2032
- Table 19: Global Asia-Pacific Container Drayage Market Revenue Million Forecast, by Country 2019 & 2032
- Table 20: Global Asia-Pacific Container Drayage Market Volume Billion Forecast, by Country 2019 & 2032
- Table 21: Global Asia-Pacific Container Drayage Market Revenue Million Forecast, by Mode of Transport 2019 & 2032
- Table 22: Global Asia-Pacific Container Drayage Market Volume Billion Forecast, by Mode of Transport 2019 & 2032
- Table 23: Global Asia-Pacific Container Drayage Market Revenue Million Forecast, by Geography 2019 & 2032
- Table 24: Global Asia-Pacific Container Drayage Market Volume Billion Forecast, by Geography 2019 & 2032
- Table 25: Global Asia-Pacific Container Drayage Market Revenue Million Forecast, by Country 2019 & 2032
- Table 26: Global Asia-Pacific Container Drayage Market Volume Billion Forecast, by Country 2019 & 2032
- Table 27: Global Asia-Pacific Container Drayage Market Revenue Million Forecast, by Mode of Transport 2019 & 2032
- Table 28: Global Asia-Pacific Container Drayage Market Volume Billion Forecast, by Mode of Transport 2019 & 2032
- Table 29: Global Asia-Pacific Container Drayage Market Revenue Million Forecast, by Geography 2019 & 2032
- Table 30: Global Asia-Pacific Container Drayage Market Volume Billion Forecast, by Geography 2019 & 2032
- Table 31: Global Asia-Pacific Container Drayage Market Revenue Million Forecast, by Country 2019 & 2032
- Table 32: Global Asia-Pacific Container Drayage Market Volume Billion Forecast, by Country 2019 & 2032
- Table 33: Global Asia-Pacific Container Drayage Market Revenue Million Forecast, by Mode of Transport 2019 & 2032
- Table 34: Global Asia-Pacific Container Drayage Market Volume Billion Forecast, by Mode of Transport 2019 & 2032
- Table 35: Global Asia-Pacific Container Drayage Market Revenue Million Forecast, by Geography 2019 & 2032
- Table 36: Global Asia-Pacific Container Drayage Market Volume Billion Forecast, by Geography 2019 & 2032
- Table 37: Global Asia-Pacific Container Drayage Market Revenue Million Forecast, by Country 2019 & 2032
- Table 38: Global Asia-Pacific Container Drayage Market Volume Billion Forecast, by Country 2019 & 2032
- Table 39: Global Asia-Pacific Container Drayage Market Revenue Million Forecast, by Mode of Transport 2019 & 2032
- Table 40: Global Asia-Pacific Container Drayage Market Volume Billion Forecast, by Mode of Transport 2019 & 2032
- Table 41: Global Asia-Pacific Container Drayage Market Revenue Million Forecast, by Geography 2019 & 2032
- Table 42: Global Asia-Pacific Container Drayage Market Volume Billion Forecast, by Geography 2019 & 2032
- Table 43: Global Asia-Pacific Container Drayage Market Revenue Million Forecast, by Country 2019 & 2032
- Table 44: Global Asia-Pacific Container Drayage Market Volume Billion Forecast, by Country 2019 & 2032
- Table 45: Global Asia-Pacific Container Drayage Market Revenue Million Forecast, by Mode of Transport 2019 & 2032
- Table 46: Global Asia-Pacific Container Drayage Market Volume Billion Forecast, by Mode of Transport 2019 & 2032
- Table 47: Global Asia-Pacific Container Drayage Market Revenue Million Forecast, by Geography 2019 & 2032
- Table 48: Global Asia-Pacific Container Drayage Market Volume Billion Forecast, by Geography 2019 & 2032
- Table 49: Global Asia-Pacific Container Drayage Market Revenue Million Forecast, by Country 2019 & 2032
- Table 50: Global Asia-Pacific Container Drayage Market Volume Billion Forecast, by Country 2019 & 2032
- Table 51: Global Asia-Pacific Container Drayage Market Revenue Million Forecast, by Mode of Transport 2019 & 2032
- Table 52: Global Asia-Pacific Container Drayage Market Volume Billion Forecast, by Mode of Transport 2019 & 2032
- Table 53: Global Asia-Pacific Container Drayage Market Revenue Million Forecast, by Geography 2019 & 2032
- Table 54: Global Asia-Pacific Container Drayage Market Volume Billion Forecast, by Geography 2019 & 2032
- Table 55: Global Asia-Pacific Container Drayage Market Revenue Million Forecast, by Country 2019 & 2032
- Table 56: Global Asia-Pacific Container Drayage Market Volume Billion Forecast, by Country 2019 & 2032
Frequently Asked Questions
1. What is the projected Compound Annual Growth Rate (CAGR) of the Asia-Pacific Container Drayage Market?
The projected CAGR is approximately 8.23%.
2. Which companies are prominent players in the Asia-Pacific Container Drayage Market?
Key companies in the market include Maersk Asia Pacific, Agility, C H Robinson Worldwide Inc, FedEx Corp, Deutsche Post DHL Group, Hitachi Ltd, CMA CGM SA Group, DB Schenker, United Parcel Services Inc, Ceva Logistics, Yusen Logistics Co Ltd**List Not Exhaustive 6 3 Other Companie.
3. What are the main segments of the Asia-Pacific Container Drayage Market?
The market segments include Mode of Transport, Geography.
4. Can you provide details about the market size?
The market size is estimated to be USD 14.36 Million as of 2022.
5. What are some drivers contributing to market growth?
4.; Increasing Railway Trade4.; Growing E-commerce Sector.
6. What are the notable trends driving market growth?
Port Congestion Easing in Key Asian Hubs. Surge in Demand for Container Drayage Driving the Transportation Segment.
7. Are there any restraints impacting market growth?
4.; Increasing Railway Trade4.; Growing E-commerce Sector.
8. Can you provide examples of recent developments in the market?
July 2024: DP World, the Dubai-based ports and logistics leader, unveiled 51 fresh freight forwarding offices in the Asia-Pacific. These new offices, specializing in air and ocean freight, leverage DP World's robust infrastructure, spanning ports, terminals, warehouses, trucks, rail, and vessels.February 2024: HERE Technologies, a leading provider of location data and technology solutions, partnered with PSA Singapore, the operator of the world's largest transshipment hub, to transform Singapore's container truck ecosystem. Their goal is to boost the efficiency of goods transportation within Singapore's terminals. Singapore, a global maritime leader, hosts the world's second busiest container port, the Port of Singapore. PSA's network spans 600+ ports globally, and in the previous year, it managed an impressive 38.8 million TEUs.
9. What pricing options are available for accessing the report?
Pricing options include single-user, multi-user, and enterprise licenses priced at USD 4750, USD 5250, and USD 8750 respectively.
10. Is the market size provided in terms of value or volume?
The market size is provided in terms of value, measured in Million and volume, measured in Billion.
11. Are there any specific market keywords associated with the report?
Yes, the market keyword associated with the report is "Asia-Pacific Container Drayage Market," which aids in identifying and referencing the specific market segment covered.
12. How do I determine which pricing option suits my needs best?
The pricing options vary based on user requirements and access needs. Individual users may opt for single-user licenses, while businesses requiring broader access may choose multi-user or enterprise licenses for cost-effective access to the report.
13. Are there any additional resources or data provided in the Asia-Pacific Container Drayage Market report?
While the report offers comprehensive insights, it's advisable to review the specific contents or supplementary materials provided to ascertain if additional resources or data are available.
14. How can I stay updated on further developments or reports in the Asia-Pacific Container Drayage Market?
To stay informed about further developments, trends, and reports in the Asia-Pacific Container Drayage Market, consider subscribing to industry newsletters, following relevant companies and organizations, or regularly checking reputable industry news sources and publications.
Methodology
Step 1 - Identification of Relevant Samples Size from Population Database


Step 2 - Approaches for Defining Global Market Size (Value, Volume* & Price*)

Note*: In applicable scenarios
Step 3 - Data Sources
Primary Research
- Web Analytics
- Survey Reports
- Research Institute
- Latest Research Reports
- Opinion Leaders
Secondary Research
- Annual Reports
- White Paper
- Latest Press Release
- Industry Association
- Paid Database
- Investor Presentations

Step 4 - Data Triangulation
Involves using different sources of information in order to increase the validity of a study
These sources are likely to be stakeholders in a program - participants, other researchers, program staff, other community members, and so on.
Then we put all data in single framework & apply various statistical tools to find out the dynamic on the market.
During the analysis stage, feedback from the stakeholder groups would be compared to determine areas of agreement as well as areas of divergence
