

Key Insights
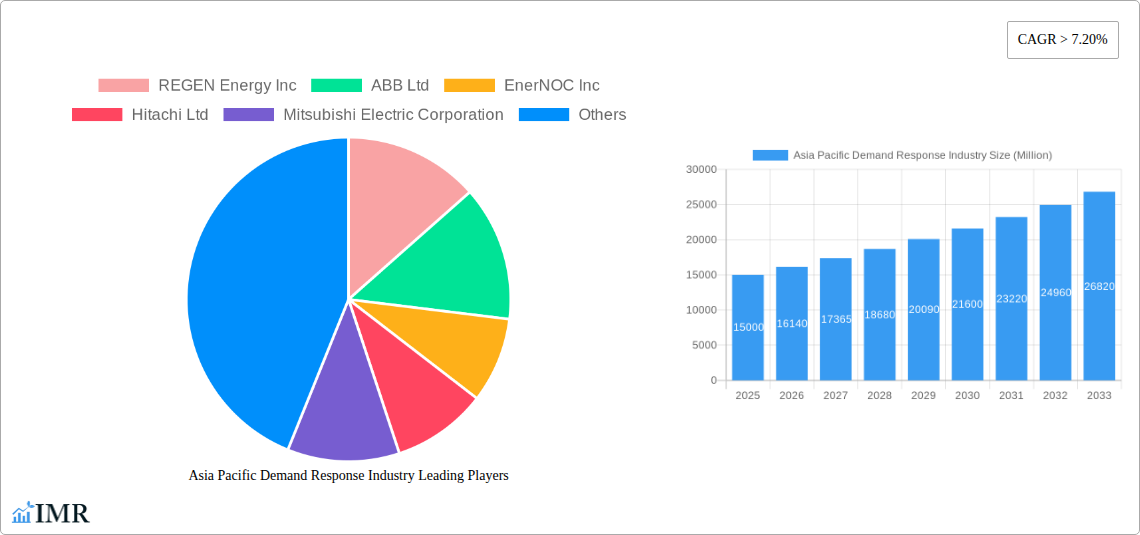
The Asia-Pacific Demand Response (DR) market is experiencing robust growth, driven by increasing electricity demand, rising energy prices, and government initiatives promoting renewable energy integration and grid stability. The region's diverse energy landscape, coupled with rapid urbanization and industrialization, presents significant opportunities for DR technologies. A Compound Annual Growth Rate (CAGR) exceeding 7.20% indicates a substantial expansion from 2019 to 2033. The market is segmented by type (Conventional and Automated DR) and end-use (Residential, Commercial, Industrial), with the Commercial and Industrial sectors likely leading the growth trajectory due to higher energy consumption and greater potential for cost savings through optimized energy management. Within the Asia-Pacific region, China, Japan, India, and South Korea are key markets, showcasing significant investment in smart grid technologies and DR programs. However, challenges remain, including regulatory hurdles in some countries, interoperability issues between different DR systems, and the need for increased consumer awareness and participation, particularly in the residential sector. Furthermore, the initial investment cost for implementing DR technologies might hinder adoption in some segments, but the long-term cost savings and environmental benefits are expected to drive greater penetration. The competitive landscape is characterized by a mix of established players like ABB, Siemens, and Schneider Electric, and specialized DR solution providers like Autogrid Systems and Silver Spring Networks. These companies are constantly innovating and expanding their offerings to cater to the evolving needs of the market.
The forecast period from 2025 to 2033 will witness significant advancements in automated DR systems, leveraging Artificial Intelligence (AI) and machine learning for optimized energy management. The integration of DR with renewable energy sources, particularly solar and wind power, will further enhance grid stability and resilience. The increasing adoption of smart meters and advanced metering infrastructure (AMI) is also expected to play a crucial role in facilitating the growth of the DR market. The focus on improving energy efficiency and reducing carbon emissions will continue to drive government policies supportive of DR adoption, fostering a more sustainable and efficient energy sector in the Asia-Pacific region. Despite the challenges, the long-term outlook for the Asia-Pacific DR market remains highly positive, with substantial growth potential across various segments and countries.
Asia Pacific Demand Response Industry Market Report: 2019-2033
This comprehensive report provides an in-depth analysis of the Asia Pacific demand response industry, offering crucial insights for investors, industry professionals, and strategic decision-makers. The report covers the period 2019-2033, with a focus on the 2025-2033 forecast period, and utilizes data from the base year 2025. We delve into market dynamics, growth trends, regional performance, key players, and future opportunities within the parent market of energy management and its child markets of residential, commercial, and industrial demand response solutions. The report features detailed analysis of both conventional and automated demand response systems across major APAC nations. Market values are presented in millions of USD.
Asia Pacific Demand Response Industry Market Dynamics & Structure
The Asia Pacific demand response market is characterized by increasing market concentration, driven by technological advancements and strategic mergers and acquisitions (M&A). The market size in 2025 is estimated at xx Million. Regulatory frameworks vary significantly across the region, influencing adoption rates and investment. Technological innovation, primarily in automation and AI-driven solutions, is a key driver, while the rising cost of electricity and increasing government incentives propel growth. However, challenges remain, including interoperability issues and a lack of standardization across different systems. M&A activity is expected to continue, consolidating the market and shaping the competitive landscape.
- Market Concentration: High (xx%), with top 5 players holding xx% market share in 2025.
- Technological Innovation: Focus on AI-powered predictive analytics, improved grid integration, and IoT-enabled devices.
- Regulatory Framework: Differentiated across countries, with some promoting strong incentives and others facing regulatory hurdles.
- Competitive Substitutes: Traditional energy efficiency measures, but demand response offers greater flexibility and cost savings.
- End-User Demographics: Shift towards higher adoption in commercial and industrial sectors, with residential penetration still developing.
- M&A Trends: Expected xx deals annually (2025-2033), focusing on technology integration and geographical expansion.
Asia Pacific Demand Response Industry Growth Trends & Insights
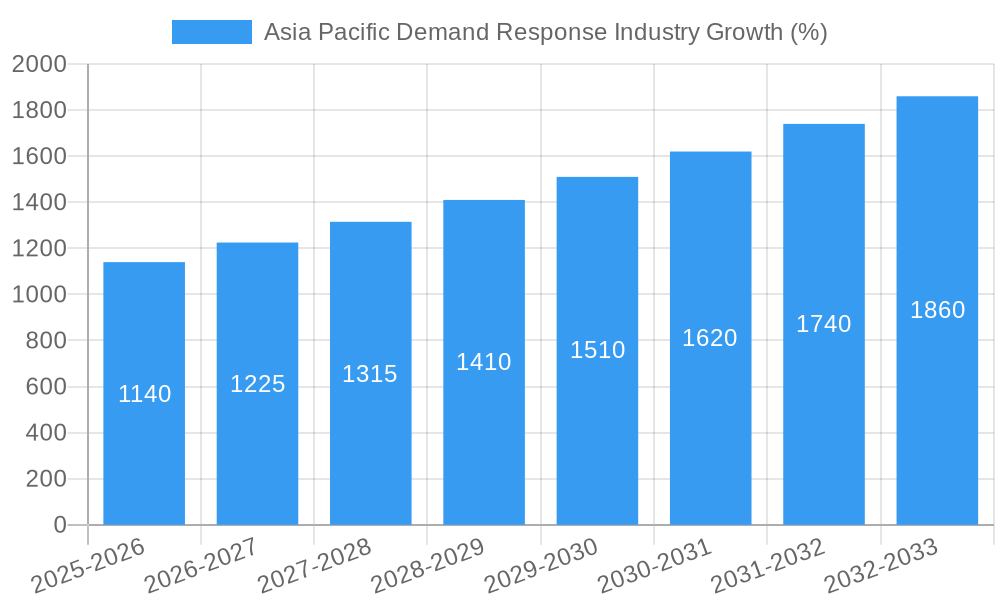
The Asia Pacific demand response market exhibits robust growth, driven by factors such as increasing energy demand, rising electricity prices, and supportive government policies. The market experienced a CAGR of xx% during the historical period (2019-2024), and is projected to grow at a CAGR of xx% from 2025 to 2033. Market penetration is relatively low in several countries, presenting significant upside potential. Technological disruptions, particularly in areas of smart metering and advanced analytics, are accelerating adoption and driving market expansion. Consumer behaviour is shifting towards greater energy consciousness and cost optimization, fueling demand for demand response solutions.
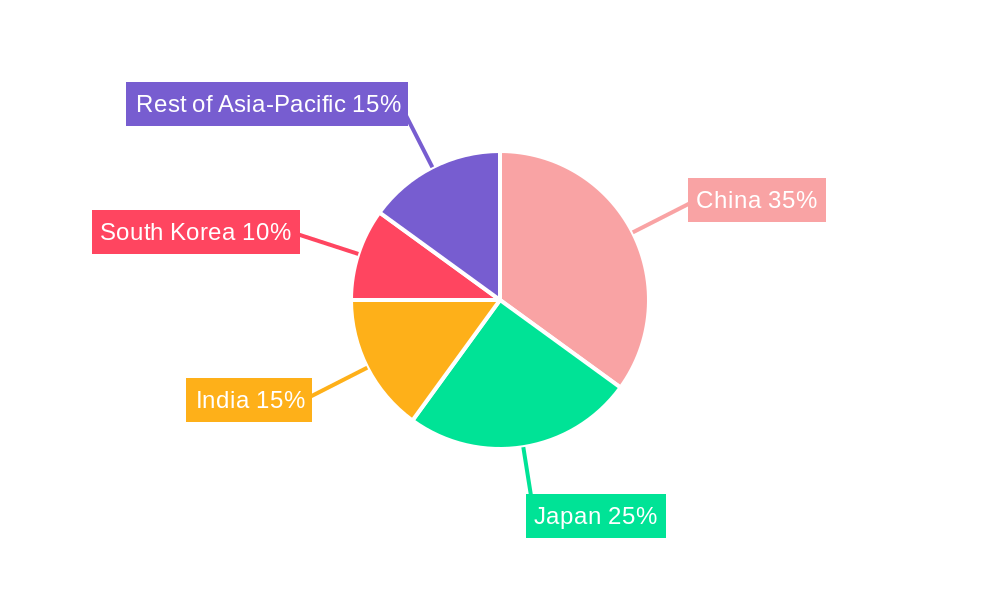
Dominant Regions, Countries, or Segments in Asia Pacific Demand Response Industry
China, Japan, and India are the leading markets, accounting for xx% of the total market size in 2025. Within segments, the automated demand response sector demonstrates faster growth than conventional methods, driven by technological advancements and higher efficiency. The industrial end-use segment holds the largest market share due to high energy consumption and significant cost savings opportunities.
- China: Strong government support, massive infrastructure development, and increasing industrialization drive market growth.
- Japan: High energy costs, advanced technological capabilities, and focus on energy efficiency contribute to market leadership.
- India: Growing energy demand, supportive government policies, and cost-reduction initiatives drive rapid expansion.
- Automated Demand Response: Higher growth due to advanced analytics and improved grid integration.
- Industrial Segment: Largest market share due to high energy consumption and significant cost-saving potential.
- South Korea, Southeast Asia, Oceania: Demonstrating significant growth potential, driven by increasing energy prices and government initiatives.
Asia Pacific Demand Response Industry Product Landscape
The product landscape is characterized by a range of solutions, including smart meters, advanced energy management systems (EMS), and communication networks. Innovation is focused on improving system efficiency, enhancing grid integration, and providing greater customer control and transparency. Key features include real-time monitoring, predictive analytics, and seamless integration with existing infrastructure. The market emphasizes user-friendly interfaces and cost-effective solutions to maximize market penetration.
Key Drivers, Barriers & Challenges in Asia Pacific Demand Response Industry
Key Drivers:
- Increasing electricity prices and energy security concerns.
- Government policies promoting renewable energy integration and grid stability.
- Technological advancements in IoT, AI, and big data analytics.
Key Barriers and Challenges:
- High initial investment costs for implementing demand response technologies.
- Lack of awareness and understanding of demand response benefits among consumers.
- Interoperability issues and lack of standardization across different systems. This results in an estimated xx Million loss annually.
Emerging Opportunities in Asia Pacific Demand Response Industry
- Expansion into untapped markets within Southeast Asia and Oceania.
- Development of innovative applications, such as integration with EVs and battery storage.
- Leveraging big data and AI for enhanced predictive capabilities and personalized energy management.
Growth Accelerators in the Asia Pacific Demand Response Industry
Technological breakthroughs in AI and machine learning, coupled with strategic partnerships between technology providers and energy utilities, are significant catalysts for market expansion. Government initiatives focused on smart grid development and renewable energy integration further accelerate market growth. Expansion into new geographic markets and the development of innovative business models will drive future success.
Key Players Shaping the Asia Pacific Demand Response Industry Market
- REGEN Energy Inc
- ABB Ltd
- EnerNOC Inc
- Hitachi Ltd
- Mitsubishi Electric Corporation
- Siemens AG
- Schneider Electric SE
- Eaton Corporation PLC
- Alstom Inc
- General Electric Company
- Silver Spring Networks
- Autogrid Systems Inc
Notable Milestones in Asia Pacific Demand Response Industry Sector
- 2022 Q3: Launch of a new AI-powered demand response platform by ABB Ltd.
- 2023 Q1: Government of Japan announces increased incentives for demand response adoption.
- 2024 Q2: Merger between two leading demand response providers in India. (Further details pending)
In-Depth Asia Pacific Demand Response Industry Market Outlook
The Asia Pacific demand response market is poised for significant growth over the forecast period, driven by a confluence of factors including technological innovation, supportive government policies, and increasing consumer awareness. Strategic partnerships, market expansion into developing economies, and the integration of demand response with other energy solutions present considerable opportunities for market players. The market is expected to reach xx Million by 2033, presenting significant investment potential and long-term growth opportunities.
Asia Pacific Demand Response Industry Segmentation
-
1. Type
- 1.1. Conventional Demand Response
- 1.2. Automated Demand Response
-
2. Geography
- 2.1. Australia
- 2.2. China
- 2.3. India
- 2.4. Japan
- 2.5. Rest of Asia-Pacific
Asia Pacific Demand Response Industry Segmentation By Geography
- 1. Australia
- 2. China
- 3. India
- 4. Japan
- 5. Rest of Asia Pacific
Asia Pacific Demand Response Industry REPORT HIGHLIGHTS
| Aspects | Details |
|---|---|
| Study Period | 2019-2033 |
| Base Year | 2024 |
| Estimated Year | 2025 |
| Forecast Period | 2025-2033 |
| Historical Period | 2019-2024 |
| Growth Rate | CAGR of > 7.20% from 2019-2033 |
| Segmentation |
|
Table of Contents
- 1. Introduction
- 1.1. Research Scope
- 1.2. Market Segmentation
- 1.3. Research Methodology
- 1.4. Definitions and Assumptions
- 2. Executive Summary
- 2.1. Introduction
- 3. Market Dynamics
- 3.1. Introduction
- 3.2. Market Drivers
- 3.2.1. 4.; Growing Demand for Energy As A Service4.; Increasing Adoption of Distributed Energy Generation in Commercial and Industrial Sectors
- 3.3. Market Restrains
- 3.3.1. 4.; Lack of Awareness in Developing Economies and High Technological Costs
- 3.4. Market Trends
- 3.4.1. Automated Demand Response System Likely To Drive The Market
- 4. Market Factor Analysis
- 4.1. Porters Five Forces
- 4.2. Supply/Value Chain
- 4.3. PESTEL analysis
- 4.4. Market Entropy
- 4.5. Patent/Trademark Analysis
- 5. Asia Pacific Demand Response Industry Analysis, Insights and Forecast, 2019-2031
- 5.1. Market Analysis, Insights and Forecast - by Type
- 5.1.1. Conventional Demand Response
- 5.1.2. Automated Demand Response
- 5.2. Market Analysis, Insights and Forecast - by Geography
- 5.2.1. Australia
- 5.2.2. China
- 5.2.3. India
- 5.2.4. Japan
- 5.2.5. Rest of Asia-Pacific
- 5.3. Market Analysis, Insights and Forecast - by Region
- 5.3.1. Australia
- 5.3.2. China
- 5.3.3. India
- 5.3.4. Japan
- 5.3.5. Rest of Asia Pacific
- 5.1. Market Analysis, Insights and Forecast - by Type
- 6. Australia Asia Pacific Demand Response Industry Analysis, Insights and Forecast, 2019-2031
- 6.1. Market Analysis, Insights and Forecast - by Type
- 6.1.1. Conventional Demand Response
- 6.1.2. Automated Demand Response
- 6.2. Market Analysis, Insights and Forecast - by Geography
- 6.2.1. Australia
- 6.2.2. China
- 6.2.3. India
- 6.2.4. Japan
- 6.2.5. Rest of Asia-Pacific
- 6.1. Market Analysis, Insights and Forecast - by Type
- 7. China Asia Pacific Demand Response Industry Analysis, Insights and Forecast, 2019-2031
- 7.1. Market Analysis, Insights and Forecast - by Type
- 7.1.1. Conventional Demand Response
- 7.1.2. Automated Demand Response
- 7.2. Market Analysis, Insights and Forecast - by Geography
- 7.2.1. Australia
- 7.2.2. China
- 7.2.3. India
- 7.2.4. Japan
- 7.2.5. Rest of Asia-Pacific
- 7.1. Market Analysis, Insights and Forecast - by Type
- 8. India Asia Pacific Demand Response Industry Analysis, Insights and Forecast, 2019-2031
- 8.1. Market Analysis, Insights and Forecast - by Type
- 8.1.1. Conventional Demand Response
- 8.1.2. Automated Demand Response
- 8.2. Market Analysis, Insights and Forecast - by Geography
- 8.2.1. Australia
- 8.2.2. China
- 8.2.3. India
- 8.2.4. Japan
- 8.2.5. Rest of Asia-Pacific
- 8.1. Market Analysis, Insights and Forecast - by Type
- 9. Japan Asia Pacific Demand Response Industry Analysis, Insights and Forecast, 2019-2031
- 9.1. Market Analysis, Insights and Forecast - by Type
- 9.1.1. Conventional Demand Response
- 9.1.2. Automated Demand Response
- 9.2. Market Analysis, Insights and Forecast - by Geography
- 9.2.1. Australia
- 9.2.2. China
- 9.2.3. India
- 9.2.4. Japan
- 9.2.5. Rest of Asia-Pacific
- 9.1. Market Analysis, Insights and Forecast - by Type
- 10. Rest of Asia Pacific Asia Pacific Demand Response Industry Analysis, Insights and Forecast, 2019-2031
- 10.1. Market Analysis, Insights and Forecast - by Type
- 10.1.1. Conventional Demand Response
- 10.1.2. Automated Demand Response
- 10.2. Market Analysis, Insights and Forecast - by Geography
- 10.2.1. Australia
- 10.2.2. China
- 10.2.3. India
- 10.2.4. Japan
- 10.2.5. Rest of Asia-Pacific
- 10.1. Market Analysis, Insights and Forecast - by Type
- 11. China Asia Pacific Demand Response Industry Analysis, Insights and Forecast, 2019-2031
- 12. Japan Asia Pacific Demand Response Industry Analysis, Insights and Forecast, 2019-2031
- 13. India Asia Pacific Demand Response Industry Analysis, Insights and Forecast, 2019-2031
- 14. South Korea Asia Pacific Demand Response Industry Analysis, Insights and Forecast, 2019-2031
- 15. Taiwan Asia Pacific Demand Response Industry Analysis, Insights and Forecast, 2019-2031
- 16. Australia Asia Pacific Demand Response Industry Analysis, Insights and Forecast, 2019-2031
- 17. Rest of Asia-Pacific Asia Pacific Demand Response Industry Analysis, Insights and Forecast, 2019-2031
- 18. Competitive Analysis
- 18.1. Market Share Analysis 2024
- 18.2. Company Profiles
- 18.2.1 REGEN Energy Inc
- 18.2.1.1. Overview
- 18.2.1.2. Products
- 18.2.1.3. SWOT Analysis
- 18.2.1.4. Recent Developments
- 18.2.1.5. Financials (Based on Availability)
- 18.2.2 ABB Ltd
- 18.2.2.1. Overview
- 18.2.2.2. Products
- 18.2.2.3. SWOT Analysis
- 18.2.2.4. Recent Developments
- 18.2.2.5. Financials (Based on Availability)
- 18.2.3 EnerNOC Inc
- 18.2.3.1. Overview
- 18.2.3.2. Products
- 18.2.3.3. SWOT Analysis
- 18.2.3.4. Recent Developments
- 18.2.3.5. Financials (Based on Availability)
- 18.2.4 Hitachi Ltd
- 18.2.4.1. Overview
- 18.2.4.2. Products
- 18.2.4.3. SWOT Analysis
- 18.2.4.4. Recent Developments
- 18.2.4.5. Financials (Based on Availability)
- 18.2.5 Mitsubishi Electric Corporation
- 18.2.5.1. Overview
- 18.2.5.2. Products
- 18.2.5.3. SWOT Analysis
- 18.2.5.4. Recent Developments
- 18.2.5.5. Financials (Based on Availability)
- 18.2.6 Siemens AG
- 18.2.6.1. Overview
- 18.2.6.2. Products
- 18.2.6.3. SWOT Analysis
- 18.2.6.4. Recent Developments
- 18.2.6.5. Financials (Based on Availability)
- 18.2.7 Schneider Electric SE
- 18.2.7.1. Overview
- 18.2.7.2. Products
- 18.2.7.3. SWOT Analysis
- 18.2.7.4. Recent Developments
- 18.2.7.5. Financials (Based on Availability)
- 18.2.8 Eaton Corporation PLC
- 18.2.8.1. Overview
- 18.2.8.2. Products
- 18.2.8.3. SWOT Analysis
- 18.2.8.4. Recent Developments
- 18.2.8.5. Financials (Based on Availability)
- 18.2.9 Alstom Inc
- 18.2.9.1. Overview
- 18.2.9.2. Products
- 18.2.9.3. SWOT Analysis
- 18.2.9.4. Recent Developments
- 18.2.9.5. Financials (Based on Availability)
- 18.2.10 General Electric Company
- 18.2.10.1. Overview
- 18.2.10.2. Products
- 18.2.10.3. SWOT Analysis
- 18.2.10.4. Recent Developments
- 18.2.10.5. Financials (Based on Availability)
- 18.2.11 Silver Spring Networks
- 18.2.11.1. Overview
- 18.2.11.2. Products
- 18.2.11.3. SWOT Analysis
- 18.2.11.4. Recent Developments
- 18.2.11.5. Financials (Based on Availability)
- 18.2.12 Autogrid Systems Inc
- 18.2.12.1. Overview
- 18.2.12.2. Products
- 18.2.12.3. SWOT Analysis
- 18.2.12.4. Recent Developments
- 18.2.12.5. Financials (Based on Availability)
- 18.2.1 REGEN Energy Inc
List of Figures
- Figure 1: Asia Pacific Demand Response Industry Revenue Breakdown (Million, %) by Product 2024 & 2032
- Figure 2: Asia Pacific Demand Response Industry Share (%) by Company 2024
List of Tables
- Table 1: Asia Pacific Demand Response Industry Revenue Million Forecast, by Region 2019 & 2032
- Table 2: Asia Pacific Demand Response Industry Revenue Million Forecast, by Type 2019 & 2032
- Table 3: Asia Pacific Demand Response Industry Revenue Million Forecast, by Geography 2019 & 2032
- Table 4: Asia Pacific Demand Response Industry Revenue Million Forecast, by Region 2019 & 2032
- Table 5: Asia Pacific Demand Response Industry Revenue Million Forecast, by Country 2019 & 2032
- Table 6: China Asia Pacific Demand Response Industry Revenue (Million) Forecast, by Application 2019 & 2032
- Table 7: Japan Asia Pacific Demand Response Industry Revenue (Million) Forecast, by Application 2019 & 2032
- Table 8: India Asia Pacific Demand Response Industry Revenue (Million) Forecast, by Application 2019 & 2032
- Table 9: South Korea Asia Pacific Demand Response Industry Revenue (Million) Forecast, by Application 2019 & 2032
- Table 10: Taiwan Asia Pacific Demand Response Industry Revenue (Million) Forecast, by Application 2019 & 2032
- Table 11: Australia Asia Pacific Demand Response Industry Revenue (Million) Forecast, by Application 2019 & 2032
- Table 12: Rest of Asia-Pacific Asia Pacific Demand Response Industry Revenue (Million) Forecast, by Application 2019 & 2032
- Table 13: Asia Pacific Demand Response Industry Revenue Million Forecast, by Type 2019 & 2032
- Table 14: Asia Pacific Demand Response Industry Revenue Million Forecast, by Geography 2019 & 2032
- Table 15: Asia Pacific Demand Response Industry Revenue Million Forecast, by Country 2019 & 2032
- Table 16: Asia Pacific Demand Response Industry Revenue Million Forecast, by Type 2019 & 2032
- Table 17: Asia Pacific Demand Response Industry Revenue Million Forecast, by Geography 2019 & 2032
- Table 18: Asia Pacific Demand Response Industry Revenue Million Forecast, by Country 2019 & 2032
- Table 19: Asia Pacific Demand Response Industry Revenue Million Forecast, by Type 2019 & 2032
- Table 20: Asia Pacific Demand Response Industry Revenue Million Forecast, by Geography 2019 & 2032
- Table 21: Asia Pacific Demand Response Industry Revenue Million Forecast, by Country 2019 & 2032
- Table 22: Asia Pacific Demand Response Industry Revenue Million Forecast, by Type 2019 & 2032
- Table 23: Asia Pacific Demand Response Industry Revenue Million Forecast, by Geography 2019 & 2032
- Table 24: Asia Pacific Demand Response Industry Revenue Million Forecast, by Country 2019 & 2032
- Table 25: Asia Pacific Demand Response Industry Revenue Million Forecast, by Type 2019 & 2032
- Table 26: Asia Pacific Demand Response Industry Revenue Million Forecast, by Geography 2019 & 2032
- Table 27: Asia Pacific Demand Response Industry Revenue Million Forecast, by Country 2019 & 2032
Frequently Asked Questions
1. What is the projected Compound Annual Growth Rate (CAGR) of the Asia Pacific Demand Response Industry?
The projected CAGR is approximately > 7.20%.
2. Which companies are prominent players in the Asia Pacific Demand Response Industry?
Key companies in the market include REGEN Energy Inc, ABB Ltd, EnerNOC Inc, Hitachi Ltd, Mitsubishi Electric Corporation, Siemens AG, Schneider Electric SE, Eaton Corporation PLC, Alstom Inc, General Electric Company, Silver Spring Networks, Autogrid Systems Inc.
3. What are the main segments of the Asia Pacific Demand Response Industry?
The market segments include Type, Geography.
4. Can you provide details about the market size?
The market size is estimated to be USD XX Million as of 2022.
5. What are some drivers contributing to market growth?
4.; Growing Demand for Energy As A Service4.; Increasing Adoption of Distributed Energy Generation in Commercial and Industrial Sectors.
6. What are the notable trends driving market growth?
Automated Demand Response System Likely To Drive The Market.
7. Are there any restraints impacting market growth?
4.; Lack of Awareness in Developing Economies and High Technological Costs.
8. Can you provide examples of recent developments in the market?
N/A
9. What pricing options are available for accessing the report?
Pricing options include single-user, multi-user, and enterprise licenses priced at USD 4750, USD 5250, and USD 8750 respectively.
10. Is the market size provided in terms of value or volume?
The market size is provided in terms of value, measured in Million.
11. Are there any specific market keywords associated with the report?
Yes, the market keyword associated with the report is "Asia Pacific Demand Response Industry," which aids in identifying and referencing the specific market segment covered.
12. How do I determine which pricing option suits my needs best?
The pricing options vary based on user requirements and access needs. Individual users may opt for single-user licenses, while businesses requiring broader access may choose multi-user or enterprise licenses for cost-effective access to the report.
13. Are there any additional resources or data provided in the Asia Pacific Demand Response Industry report?
While the report offers comprehensive insights, it's advisable to review the specific contents or supplementary materials provided to ascertain if additional resources or data are available.
14. How can I stay updated on further developments or reports in the Asia Pacific Demand Response Industry?
To stay informed about further developments, trends, and reports in the Asia Pacific Demand Response Industry, consider subscribing to industry newsletters, following relevant companies and organizations, or regularly checking reputable industry news sources and publications.
Methodology
Step 1 - Identification of Relevant Samples Size from Population Database


Step 2 - Approaches for Defining Global Market Size (Value, Volume* & Price*)

Note*: In applicable scenarios
Step 3 - Data Sources
Primary Research
- Web Analytics
- Survey Reports
- Research Institute
- Latest Research Reports
- Opinion Leaders
Secondary Research
- Annual Reports
- White Paper
- Latest Press Release
- Industry Association
- Paid Database
- Investor Presentations

Step 4 - Data Triangulation
Involves using different sources of information in order to increase the validity of a study
These sources are likely to be stakeholders in a program - participants, other researchers, program staff, other community members, and so on.
Then we put all data in single framework & apply various statistical tools to find out the dynamic on the market.
During the analysis stage, feedback from the stakeholder groups would be compared to determine areas of agreement as well as areas of divergence
