

Key Insights
The global nuclear reactor construction market is poised for robust expansion, with a projected Compound Annual Growth Rate (CAGR) of 2.47%. This growth is propelled by escalating global energy demands, particularly in rapidly industrializing nations. The need to modernize aging nuclear infrastructure in developed economies further fuels investment. Technological advancements, including improved reactor designs and the development of Small Modular Reactors (SMRs), are enhancing efficiency and safety, thereby supporting market expansion. Key challenges include stringent regulations, high capital expenditures, and public concerns regarding safety and waste management. The market is segmented by service (equipment and auxiliary equipment installation), reactor type, and geography. Leading players are driving innovation, strategic partnerships, and global expansion. The Asia-Pacific region, especially China and India, is expected to lead growth due to rising electricity needs and governmental support for nuclear energy.
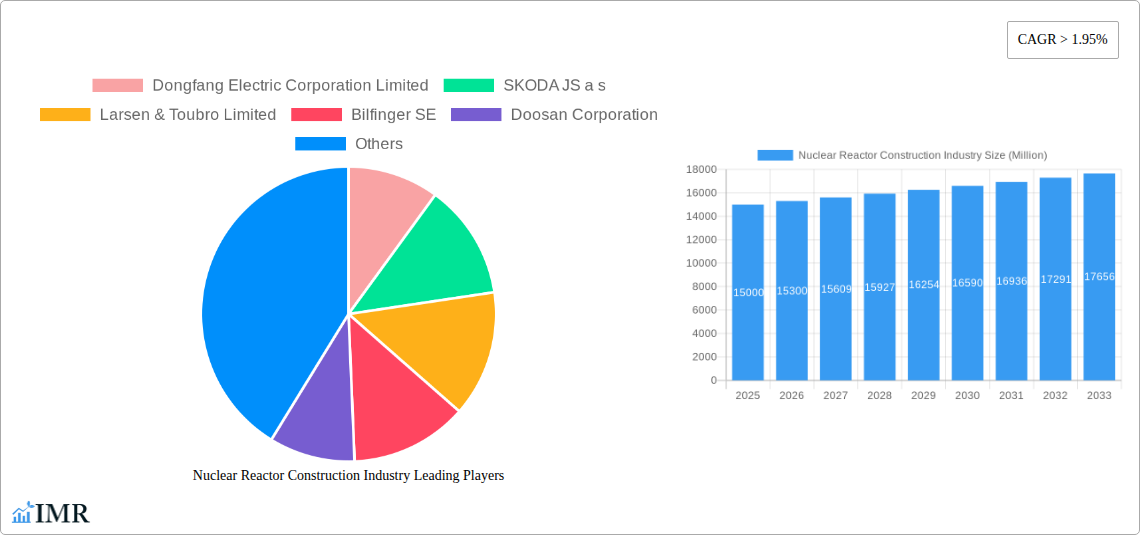
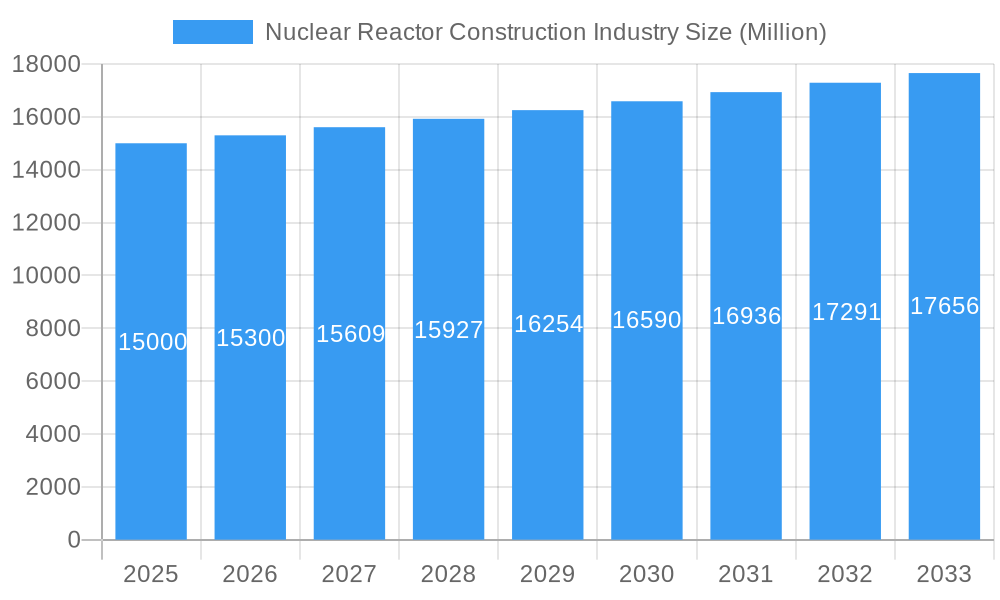
Nuclear Reactor Construction Industry Market Size (In Billion)
The competitive arena features a blend of established global entities and regional specialists, characterized by expertise in project management, engineering, and construction, alongside strong government and regulatory relationships. Future growth is intrinsically linked to innovations in reactor design, construction methodologies, advanced nuclear fuels, and the promising cost and safety advantages of SMRs. The global imperative for sustainability and reduced carbon emissions positions nuclear energy as a critical clean energy solution, fostering an optimistic long-term outlook despite persistent cost and public perception hurdles. Addressing these challenges is paramount for sustained growth and widespread nuclear power adoption.
Nuclear Reactor Construction Industry Company Market Share
This comprehensive report offers an in-depth analysis of the Nuclear Reactor Construction Industry, covering market dynamics, growth trajectories, regional leadership, product portfolios, and key stakeholders. The analysis spans from 2019 to 2033, with a detailed forecast for 2025-2033, using 2025 as the base year. The market size is valued at 7.73 billion. This report is an essential resource for industry professionals, investors, and policymakers seeking to understand the sector's complexities and future potential. The market is segmented by service (Equipment, Auxiliary Equipment Installation), reactor type (Pressurized Water Reactor, Pressurized Heavy Water Reactor, Boiling Water Reactor, High-Temperature Gas-Cooled Reactor, Liquid-Metal Fast-Breeder Reactor), and geographical regions.
Nuclear Reactor Construction Industry Market Dynamics & Structure
The nuclear reactor construction industry is characterized by high capital intensity, stringent regulatory environments, and a relatively concentrated market structure. While the global market size reached xx Million in 2024, it is expected to show moderate growth due to several factors. Market concentration is significant, with a few dominant players holding substantial market share. For example, China National Nuclear Corporation and Rosatom Corp. hold a combined xx% market share, while other major players like Westinghouse Electric and Mitsubishi Heavy Industries account for xx%.
- Market Concentration: High, with a few multinational corporations dominating.
- Technological Innovation: Driven by advancements in SMR technology and improved safety features.
- Regulatory Frameworks: Stringent safety and environmental regulations influence project timelines and costs. This is also a barrier to entry for smaller companies.
- Competitive Product Substitutes: Renewable energy sources, such as solar and wind power, present increasing competition.
- End-User Demographics: Primarily government entities and state-owned energy companies.
- M&A Trends: Moderate activity, driven by strategic partnerships and technology acquisitions. The total value of M&A deals in the period 2019-2024 was estimated at xx Million.
Nuclear Reactor Construction Industry Growth Trends & Insights
The global nuclear reactor construction market exhibits a complex growth trajectory. While historical growth (2019-2024) averaged xx% CAGR, the forecast period (2025-2033) projects a xx% CAGR, reaching xx Million by 2033. This reflects a combination of factors, including increasing energy demand in developing nations, the need for reliable baseload power, and ongoing advancements in reactor technology. The adoption rate of new reactor designs, particularly Small Modular Reactors (SMRs), is a key growth driver. Consumer behavior, reflected in government policies favoring nuclear power in some regions, also significantly impacts market growth. Technological disruptions, primarily from SMR innovations, are expected to revolutionize the industry.
Dominant Regions, Countries, or Segments in Nuclear Reactor Construction Industry
Asia, particularly China and India, is the dominant region in nuclear reactor construction, accounting for xx% of the global market share in 2024. This dominance is driven by:
- China: Massive investments in nuclear power expansion and a strong domestic industry.
- India: Aggressive plans for fleet-mode reactor construction and a focus on PHWR technology.
- Other Regions: North America and Europe show slower but steady growth, influenced by regulations and public opinion.
Within the segments, Pressurized Water Reactors (PWR) and Pressurized Heavy Water Reactors (PHWR) dominate, making up xx% of the market share. Equipment services hold a larger market share than auxiliary equipment installation, due to the high cost and complexity of reactor components.
Nuclear Reactor Construction Industry Product Landscape
The product landscape is characterized by a shift towards SMRs, which offer enhanced safety, reduced capital costs, and flexible deployment options. Advanced materials, improved control systems, and digital twin technologies are key innovations improving reactor performance and efficiency. These advancements offer unique selling propositions, addressing safety concerns and reducing the environmental impact of nuclear power generation.
Key Drivers, Barriers & Challenges in Nuclear Reactor Construction Industry
Key Drivers:
- Increasing energy demand: Global energy consumption continues to rise, driving the need for reliable baseload power.
- Climate change concerns: Nuclear power offers a low-carbon alternative to fossil fuels.
- Government support: Many countries are actively promoting nuclear power as part of their energy security strategies.
Key Challenges:
- High capital costs: Nuclear power plants require significant upfront investment.
- Stringent regulations: Compliance with safety and environmental standards is complex and time-consuming.
- Public perception: Negative public perception of nuclear power remains a hurdle in some regions. The Fukushima disaster significantly impacted public opinion. Supply chain disruptions can cause delays and cost overruns, with a quantifiable impact estimated at xx% of project budgets.
Emerging Opportunities in Nuclear Reactor Construction Industry
Emerging opportunities lie in the development and deployment of SMRs, particularly in developing countries and regions with limited grid infrastructure. The application of advanced technologies such as artificial intelligence (AI) and machine learning for predictive maintenance and improved operational efficiency also presents promising opportunities. The growing interest in nuclear energy for hydrogen production presents a new avenue for market expansion.
Growth Accelerators in the Nuclear Reactor Construction Industry
Technological breakthroughs in SMR technology, coupled with strategic partnerships between governments and private companies, are key growth accelerators. Expanding into untapped markets, particularly in Africa and Southeast Asia, also presents significant potential. Moreover, innovations in reactor designs that enhance safety and reduce operational costs are driving industry growth.
Key Players Shaping the Nuclear Reactor Construction Industry Market
- Dongfang Electric Corporation Limited
- SKODA JS a.s.
- Larsen & Toubro Limited
- Bilfinger SE
- Doosan Corporation
- China National Nuclear Corporation
- Shanghai Electric Group Company Limited
- KEPCO Engineering & Construction
- Westinghouse Electric Company LLC (Toshiba)
- Rosatom Corp
- Mitsubishi Heavy Industries Ltd
- GE-Hitachi Nuclear Energy Inc
Notable Milestones in Nuclear Reactor Construction Industry Sector
- March 2022: India initiates fleet-mode reactor construction, starting with two 700 MWe PHWRs at Kaiga. This signals a significant acceleration in India's nuclear power expansion.
- October 2022: The US and Japan partner with Ghana to support SMR deployment. This signifies a growing global interest in SMR technology and its potential for addressing energy needs in developing nations.
In-Depth Nuclear Reactor Construction Industry Market Outlook
The future of the nuclear reactor construction industry is bright, driven by a confluence of factors including growing energy demand, climate change concerns, and technological advancements. SMRs are poised to play a significant role in shaping the industry’s future, offering a safer, more economical, and flexible approach to nuclear power generation. The strategic opportunities lie in fostering partnerships, investing in technological innovation, and expanding into emerging markets, thereby capitalizing on the substantial long-term growth potential of this essential sector.
Nuclear Reactor Construction Industry Segmentation
-
1. Service
-
1.1. Equipment
- 1.1.1. Island Equipment
- 1.1.2. Auxiliary Equipment
- 1.2. Installation
-
1.1. Equipment
-
2. Reactor Type
- 2.1. Pressuri
- 2.2. Boiling Water Reactor
- 2.3. High-temperature Gas Cooled Reactor
- 2.4. Liquid-metal Fast-Breeder Reactor
Nuclear Reactor Construction Industry Segmentation By Geography
- 1. North America
- 2. Europe
- 3. Asia Pacific
- 4. South America
- 5. Middle East and Africa
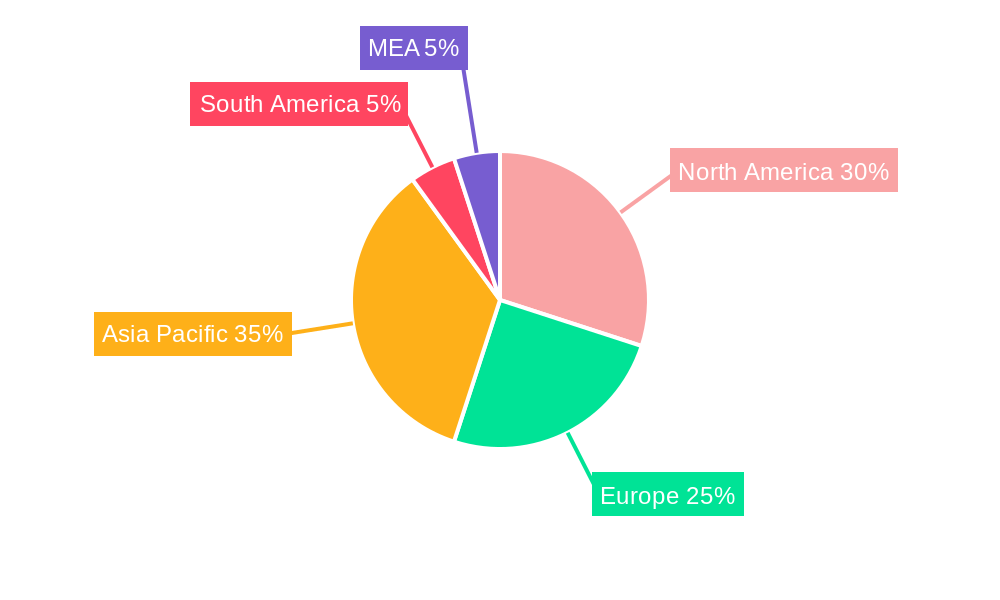
Nuclear Reactor Construction Industry Regional Market Share
Geographic Coverage of Nuclear Reactor Construction Industry
Nuclear Reactor Construction Industry REPORT HIGHLIGHTS
| Aspects | Details |
|---|---|
| Study Period | 2020-2034 |
| Base Year | 2025 |
| Estimated Year | 2026 |
| Forecast Period | 2026-2034 |
| Historical Period | 2020-2025 |
| Growth Rate | CAGR of 2.47% from 2020-2034 |
| Segmentation |
|
Table of Contents
- 1. Introduction
- 1.1. Research Scope
- 1.2. Market Segmentation
- 1.3. Research Objective
- 1.4. Definitions and Assumptions
- 2. Executive Summary
- 2.1. Market Snapshot
- 3. Market Dynamics
- 3.1. Market Drivers
- 3.2. Market Restrains
- 3.3. Market Trends
- 3.4. Market Opportunities
- 4. Market Factor Analysis
- 4.1. Porters Five Forces
- 4.1.1. Bargaining Power of Suppliers
- 4.1.2. Bargaining Power of Buyers
- 4.1.3. Threat of New Entrants
- 4.1.4. Threat of Substitutes
- 4.1.5. Competitive Rivalry
- 4.2. PESTEL analysis
- 4.3. BCG Analysis
- 4.3.1. Stars (High Growth, High Market Share)
- 4.3.2. Cash Cows (Low Growth, High Market Share)
- 4.3.3. Question Mark (High Growth, Low Market Share)
- 4.3.4. Dogs (Low Growth, Low Market Share)
- 4.4. Ansoff Matrix Analysis
- 4.5. Supply Chain Analysis
- 4.6. Regulatory Landscape
- 4.7. Current Market Potential and Opportunity Assessment (TAM–SAM–SOM Framework)
- 4.8. IMR Analyst Note
- 4.1. Porters Five Forces
- 5. Market Analysis, Insights and Forecast 2021-2033
- 5.1. Market Analysis, Insights and Forecast - by Service
- 5.1.1. Equipment
- 5.1.1.1. Island Equipment
- 5.1.1.2. Auxiliary Equipment
- 5.1.2. Installation
- 5.1.1. Equipment
- 5.2. Market Analysis, Insights and Forecast - by Reactor Type
- 5.2.1. Pressuri
- 5.2.2. Boiling Water Reactor
- 5.2.3. High-temperature Gas Cooled Reactor
- 5.2.4. Liquid-metal Fast-Breeder Reactor
- 5.3. Market Analysis, Insights and Forecast - by Region
- 5.3.1. North America
- 5.3.2. Europe
- 5.3.3. Asia Pacific
- 5.3.4. South America
- 5.3.5. Middle East and Africa
- 5.1. Market Analysis, Insights and Forecast - by Service
- 6. Global Nuclear Reactor Construction Industry Analysis, Insights and Forecast, 2021-2033
- 6.1. Market Analysis, Insights and Forecast - by Service
- 6.1.1. Equipment
- 6.1.1.1. Island Equipment
- 6.1.1.2. Auxiliary Equipment
- 6.1.2. Installation
- 6.1.1. Equipment
- 6.2. Market Analysis, Insights and Forecast - by Reactor Type
- 6.2.1. Pressuri
- 6.2.2. Boiling Water Reactor
- 6.2.3. High-temperature Gas Cooled Reactor
- 6.2.4. Liquid-metal Fast-Breeder Reactor
- 6.1. Market Analysis, Insights and Forecast - by Service
- 7. North America Nuclear Reactor Construction Industry Analysis, Insights and Forecast, 2020-2032
- 7.1. Market Analysis, Insights and Forecast - by Service
- 7.1.1. Equipment
- 7.1.1.1. Island Equipment
- 7.1.1.2. Auxiliary Equipment
- 7.1.2. Installation
- 7.1.1. Equipment
- 7.2. Market Analysis, Insights and Forecast - by Reactor Type
- 7.2.1. Pressuri
- 7.2.2. Boiling Water Reactor
- 7.2.3. High-temperature Gas Cooled Reactor
- 7.2.4. Liquid-metal Fast-Breeder Reactor
- 7.1. Market Analysis, Insights and Forecast - by Service
- 8. Europe Nuclear Reactor Construction Industry Analysis, Insights and Forecast, 2020-2032
- 8.1. Market Analysis, Insights and Forecast - by Service
- 8.1.1. Equipment
- 8.1.1.1. Island Equipment
- 8.1.1.2. Auxiliary Equipment
- 8.1.2. Installation
- 8.1.1. Equipment
- 8.2. Market Analysis, Insights and Forecast - by Reactor Type
- 8.2.1. Pressuri
- 8.2.2. Boiling Water Reactor
- 8.2.3. High-temperature Gas Cooled Reactor
- 8.2.4. Liquid-metal Fast-Breeder Reactor
- 8.1. Market Analysis, Insights and Forecast - by Service
- 9. Asia Pacific Nuclear Reactor Construction Industry Analysis, Insights and Forecast, 2020-2032
- 9.1. Market Analysis, Insights and Forecast - by Service
- 9.1.1. Equipment
- 9.1.1.1. Island Equipment
- 9.1.1.2. Auxiliary Equipment
- 9.1.2. Installation
- 9.1.1. Equipment
- 9.2. Market Analysis, Insights and Forecast - by Reactor Type
- 9.2.1. Pressuri
- 9.2.2. Boiling Water Reactor
- 9.2.3. High-temperature Gas Cooled Reactor
- 9.2.4. Liquid-metal Fast-Breeder Reactor
- 9.1. Market Analysis, Insights and Forecast - by Service
- 10. South America Nuclear Reactor Construction Industry Analysis, Insights and Forecast, 2020-2032
- 10.1. Market Analysis, Insights and Forecast - by Service
- 10.1.1. Equipment
- 10.1.1.1. Island Equipment
- 10.1.1.2. Auxiliary Equipment
- 10.1.2. Installation
- 10.1.1. Equipment
- 10.2. Market Analysis, Insights and Forecast - by Reactor Type
- 10.2.1. Pressuri
- 10.2.2. Boiling Water Reactor
- 10.2.3. High-temperature Gas Cooled Reactor
- 10.2.4. Liquid-metal Fast-Breeder Reactor
- 10.1. Market Analysis, Insights and Forecast - by Service
- 11. Middle East and Africa Nuclear Reactor Construction Industry Analysis, Insights and Forecast, 2020-2032
- 11.1. Market Analysis, Insights and Forecast - by Service
- 11.1.1. Equipment
- 11.1.1.1. Island Equipment
- 11.1.1.2. Auxiliary Equipment
- 11.1.2. Installation
- 11.1.1. Equipment
- 11.2. Market Analysis, Insights and Forecast - by Reactor Type
- 11.2.1. Pressuri
- 11.2.2. Boiling Water Reactor
- 11.2.3. High-temperature Gas Cooled Reactor
- 11.2.4. Liquid-metal Fast-Breeder Reactor
- 11.1. Market Analysis, Insights and Forecast - by Service
- 12. Competitive Analysis
- 12.1. Company Profiles
- 12.1.1 Dongfang Electric Corporation Limited
- 12.1.1.1. Company Overview
- 12.1.1.2. Products
- 12.1.1.3. Company Financials
- 12.1.1.4. SWOT Analysis
- 12.1.2 SKODA JS a s
- 12.1.2.1. Company Overview
- 12.1.2.2. Products
- 12.1.2.3. Company Financials
- 12.1.2.4. SWOT Analysis
- 12.1.3 Larsen & Toubro Limited
- 12.1.3.1. Company Overview
- 12.1.3.2. Products
- 12.1.3.3. Company Financials
- 12.1.3.4. SWOT Analysis
- 12.1.4 Bilfinger SE
- 12.1.4.1. Company Overview
- 12.1.4.2. Products
- 12.1.4.3. Company Financials
- 12.1.4.4. SWOT Analysis
- 12.1.5 Doosan Corporation
- 12.1.5.1. Company Overview
- 12.1.5.2. Products
- 12.1.5.3. Company Financials
- 12.1.5.4. SWOT Analysis
- 12.1.6 China National Nuclear Corporation
- 12.1.6.1. Company Overview
- 12.1.6.2. Products
- 12.1.6.3. Company Financials
- 12.1.6.4. SWOT Analysis
- 12.1.7 Shanghai Electric Group Company Limited
- 12.1.7.1. Company Overview
- 12.1.7.2. Products
- 12.1.7.3. Company Financials
- 12.1.7.4. SWOT Analysis
- 12.1.8 KEPCO Engineering & Construction
- 12.1.8.1. Company Overview
- 12.1.8.2. Products
- 12.1.8.3. Company Financials
- 12.1.8.4. SWOT Analysis
- 12.1.9 Westinghouse Electric Company LLC (Toshiba)
- 12.1.9.1. Company Overview
- 12.1.9.2. Products
- 12.1.9.3. Company Financials
- 12.1.9.4. SWOT Analysis
- 12.1.10 Rosatom Corp*List Not Exhaustive
- 12.1.10.1. Company Overview
- 12.1.10.2. Products
- 12.1.10.3. Company Financials
- 12.1.10.4. SWOT Analysis
- 12.1.11 Mitsubishi Heavy Industries Ltd
- 12.1.11.1. Company Overview
- 12.1.11.2. Products
- 12.1.11.3. Company Financials
- 12.1.11.4. SWOT Analysis
- 12.1.12 GE-Hitachi Nuclear Energy Inc
- 12.1.12.1. Company Overview
- 12.1.12.2. Products
- 12.1.12.3. Company Financials
- 12.1.12.4. SWOT Analysis
- 12.1.1 Dongfang Electric Corporation Limited
- 12.2. Market Entropy
- 12.2.1 Company's Key Areas Served
- 12.2.2 Recent Developments
- 12.3. Company Market Share Analysis 2025
- 12.3.1 Top 5 Companies Market Share Analysis
- 12.3.2 Top 3 Companies Market Share Analysis
- 12.4. List of Potential Customers
- 13. Research Methodology
List of Figures
- Figure 1: Global Nuclear Reactor Construction Industry Revenue Breakdown (billion, %) by Region 2025 & 2033
- Figure 2: North America Nuclear Reactor Construction Industry Revenue (billion), by Service 2025 & 2033
- Figure 3: North America Nuclear Reactor Construction Industry Revenue Share (%), by Service 2025 & 2033
- Figure 4: North America Nuclear Reactor Construction Industry Revenue (billion), by Reactor Type 2025 & 2033
- Figure 5: North America Nuclear Reactor Construction Industry Revenue Share (%), by Reactor Type 2025 & 2033
- Figure 6: North America Nuclear Reactor Construction Industry Revenue (billion), by Country 2025 & 2033
- Figure 7: North America Nuclear Reactor Construction Industry Revenue Share (%), by Country 2025 & 2033
- Figure 8: Europe Nuclear Reactor Construction Industry Revenue (billion), by Service 2025 & 2033
- Figure 9: Europe Nuclear Reactor Construction Industry Revenue Share (%), by Service 2025 & 2033
- Figure 10: Europe Nuclear Reactor Construction Industry Revenue (billion), by Reactor Type 2025 & 2033
- Figure 11: Europe Nuclear Reactor Construction Industry Revenue Share (%), by Reactor Type 2025 & 2033
- Figure 12: Europe Nuclear Reactor Construction Industry Revenue (billion), by Country 2025 & 2033
- Figure 13: Europe Nuclear Reactor Construction Industry Revenue Share (%), by Country 2025 & 2033
- Figure 14: Asia Pacific Nuclear Reactor Construction Industry Revenue (billion), by Service 2025 & 2033
- Figure 15: Asia Pacific Nuclear Reactor Construction Industry Revenue Share (%), by Service 2025 & 2033
- Figure 16: Asia Pacific Nuclear Reactor Construction Industry Revenue (billion), by Reactor Type 2025 & 2033
- Figure 17: Asia Pacific Nuclear Reactor Construction Industry Revenue Share (%), by Reactor Type 2025 & 2033
- Figure 18: Asia Pacific Nuclear Reactor Construction Industry Revenue (billion), by Country 2025 & 2033
- Figure 19: Asia Pacific Nuclear Reactor Construction Industry Revenue Share (%), by Country 2025 & 2033
- Figure 20: South America Nuclear Reactor Construction Industry Revenue (billion), by Service 2025 & 2033
- Figure 21: South America Nuclear Reactor Construction Industry Revenue Share (%), by Service 2025 & 2033
- Figure 22: South America Nuclear Reactor Construction Industry Revenue (billion), by Reactor Type 2025 & 2033
- Figure 23: South America Nuclear Reactor Construction Industry Revenue Share (%), by Reactor Type 2025 & 2033
- Figure 24: South America Nuclear Reactor Construction Industry Revenue (billion), by Country 2025 & 2033
- Figure 25: South America Nuclear Reactor Construction Industry Revenue Share (%), by Country 2025 & 2033
- Figure 26: Middle East and Africa Nuclear Reactor Construction Industry Revenue (billion), by Service 2025 & 2033
- Figure 27: Middle East and Africa Nuclear Reactor Construction Industry Revenue Share (%), by Service 2025 & 2033
- Figure 28: Middle East and Africa Nuclear Reactor Construction Industry Revenue (billion), by Reactor Type 2025 & 2033
- Figure 29: Middle East and Africa Nuclear Reactor Construction Industry Revenue Share (%), by Reactor Type 2025 & 2033
- Figure 30: Middle East and Africa Nuclear Reactor Construction Industry Revenue (billion), by Country 2025 & 2033
- Figure 31: Middle East and Africa Nuclear Reactor Construction Industry Revenue Share (%), by Country 2025 & 2033
List of Tables
- Table 1: Global Nuclear Reactor Construction Industry Revenue billion Forecast, by Service 2020 & 2033
- Table 2: Global Nuclear Reactor Construction Industry Revenue billion Forecast, by Reactor Type 2020 & 2033
- Table 3: Global Nuclear Reactor Construction Industry Revenue billion Forecast, by Region 2020 & 2033
- Table 4: Global Nuclear Reactor Construction Industry Revenue billion Forecast, by Service 2020 & 2033
- Table 5: Global Nuclear Reactor Construction Industry Revenue billion Forecast, by Reactor Type 2020 & 2033
- Table 6: Global Nuclear Reactor Construction Industry Revenue billion Forecast, by Country 2020 & 2033
- Table 7: Global Nuclear Reactor Construction Industry Revenue billion Forecast, by Service 2020 & 2033
- Table 8: Global Nuclear Reactor Construction Industry Revenue billion Forecast, by Reactor Type 2020 & 2033
- Table 9: Global Nuclear Reactor Construction Industry Revenue billion Forecast, by Country 2020 & 2033
- Table 10: Global Nuclear Reactor Construction Industry Revenue billion Forecast, by Service 2020 & 2033
- Table 11: Global Nuclear Reactor Construction Industry Revenue billion Forecast, by Reactor Type 2020 & 2033
- Table 12: Global Nuclear Reactor Construction Industry Revenue billion Forecast, by Country 2020 & 2033
- Table 13: Global Nuclear Reactor Construction Industry Revenue billion Forecast, by Service 2020 & 2033
- Table 14: Global Nuclear Reactor Construction Industry Revenue billion Forecast, by Reactor Type 2020 & 2033
- Table 15: Global Nuclear Reactor Construction Industry Revenue billion Forecast, by Country 2020 & 2033
- Table 16: Global Nuclear Reactor Construction Industry Revenue billion Forecast, by Service 2020 & 2033
- Table 17: Global Nuclear Reactor Construction Industry Revenue billion Forecast, by Reactor Type 2020 & 2033
- Table 18: Global Nuclear Reactor Construction Industry Revenue billion Forecast, by Country 2020 & 2033
Frequently Asked Questions
1. What is the projected Compound Annual Growth Rate (CAGR) of the Nuclear Reactor Construction Industry?
The projected CAGR is approximately 2.47%.
2. Which companies are prominent players in the Nuclear Reactor Construction Industry?
Key companies in the market include Dongfang Electric Corporation Limited, SKODA JS a s, Larsen & Toubro Limited, Bilfinger SE, Doosan Corporation, China National Nuclear Corporation, Shanghai Electric Group Company Limited, KEPCO Engineering & Construction, Westinghouse Electric Company LLC (Toshiba), Rosatom Corp*List Not Exhaustive, Mitsubishi Heavy Industries Ltd, GE-Hitachi Nuclear Energy Inc.
3. What are the main segments of the Nuclear Reactor Construction Industry?
The market segments include Service, Reactor Type.
4. Can you provide details about the market size?
The market size is estimated to be USD 7.73 billion as of 2022.
5. What are some drivers contributing to market growth?
4.; Rising Demand for Reliable Electricity4.; Increasing Government Support for Hydropower Gneeration.
6. What are the notable trends driving market growth?
Pressurized Water Reactor to Dominate the Market.
7. Are there any restraints impacting market growth?
4.; Negative Environmental Consequences of Hydropower Projects.
8. Can you provide examples of recent developments in the market?
October 2022: The United States and Japan announced a partnership with Ghana at the International Atomic Energy Agency Nuclear Power Ministerial Conference in Washington, DC, to support its goal of leading Africa to deploy small modular reactors. Since Ghana's nuclear power program is currently technology neutral, the collaboration will facilitate the deployment of Small Modular Reactor (SMR) technology in Ghana.
9. What pricing options are available for accessing the report?
Pricing options include single-user, multi-user, and enterprise licenses priced at USD 4750, USD 5250, and USD 8750 respectively.
10. Is the market size provided in terms of value or volume?
The market size is provided in terms of value, measured in billion.
11. Are there any specific market keywords associated with the report?
Yes, the market keyword associated with the report is "Nuclear Reactor Construction Industry," which aids in identifying and referencing the specific market segment covered.
12. How do I determine which pricing option suits my needs best?
The pricing options vary based on user requirements and access needs. Individual users may opt for single-user licenses, while businesses requiring broader access may choose multi-user or enterprise licenses for cost-effective access to the report.
13. Are there any additional resources or data provided in the Nuclear Reactor Construction Industry report?
While the report offers comprehensive insights, it's advisable to review the specific contents or supplementary materials provided to ascertain if additional resources or data are available.
14. How can I stay updated on further developments or reports in the Nuclear Reactor Construction Industry?
To stay informed about further developments, trends, and reports in the Nuclear Reactor Construction Industry, consider subscribing to industry newsletters, following relevant companies and organizations, or regularly checking reputable industry news sources and publications.
Methodology
Step 1 - Identification of Relevant Samples Size from Population Database


Step 2 - Approaches for Defining Global Market Size (Value, Volume* & Price*)

Note*: In applicable scenarios
Step 3 - Data Sources
Primary Research
- Web Analytics
- Survey Reports
- Research Institute
- Latest Research Reports
- Opinion Leaders
Secondary Research
- Annual Reports
- White Paper
- Latest Press Release
- Industry Association
- Paid Database
- Investor Presentations

Step 4 - Data Triangulation
Involves using different sources of information in order to increase the validity of a study
These sources are likely to be stakeholders in a program - participants, other researchers, program staff, other community members, and so on.
Then we put all data in single framework & apply various statistical tools to find out the dynamic on the market.
During the analysis stage, feedback from the stakeholder groups would be compared to determine areas of agreement as well as areas of divergence