

Key Insights
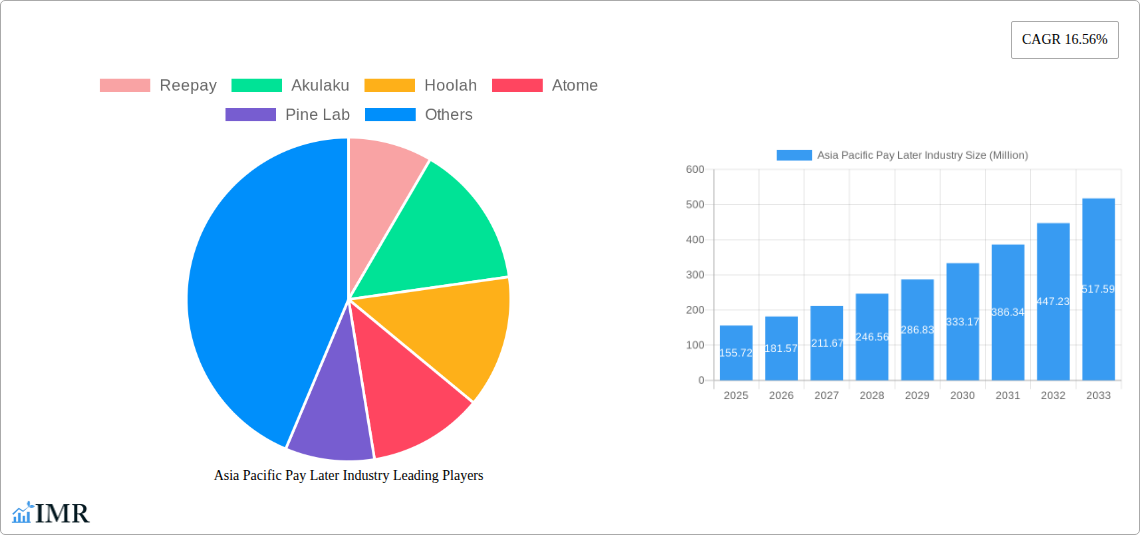
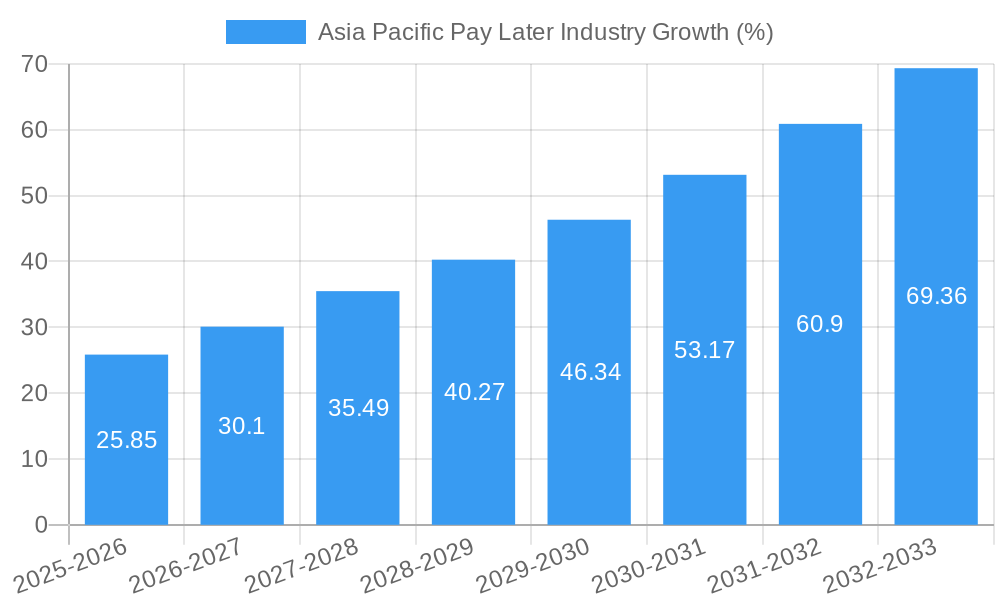
The Asia Pacific Buy Now, Pay Later (BNPL) market is experiencing explosive growth, projected to reach \$155.72 million in 2025 and maintain a robust Compound Annual Growth Rate (CAGR) of 16.56% from 2025 to 2033. This surge is driven by several key factors. Increasing smartphone penetration and e-commerce adoption across the region are fueling consumer demand for flexible payment options. A predominantly young and digitally savvy population readily embraces BNPL services, further accelerating market expansion. Furthermore, the rise of fintech companies offering innovative BNPL solutions tailored to local preferences and regulations contributes significantly to the market's dynamism. Competition is fierce, with established players like Reepay, Akulaku, Hoolah, Atome, and Pine Labs vying for market share alongside regional players like Rely (Singapore) and Limepay (Australia). The market's growth is not without challenges; regulatory scrutiny and concerns about consumer debt are potential restraints. However, the overall positive momentum suggests continued expansion, particularly in countries with high rates of mobile adoption and burgeoning e-commerce sectors.
The market segmentation is likely diverse, encompassing various transaction sizes, merchant categories, and consumer demographics. Further granular analysis would reveal specific growth patterns within segments like e-commerce, travel, and healthcare. Future market penetration will likely depend on enhancing consumer trust through robust risk management strategies and promoting financial literacy among users. The ability of BNPL providers to adapt to evolving regulations and maintain a positive consumer experience will be pivotal to long-term success. Strategic partnerships with merchants and financial institutions will also be crucial for further market expansion, particularly in untapped markets within the Asia Pacific region. The predicted growth trajectory indicates a significant opportunity for both existing and emerging players, but success hinges on navigating the dynamic regulatory landscape and maintaining sustainable business practices.
This comprehensive report provides an in-depth analysis of the Asia Pacific Buy Now Pay Later (BNPL) industry, encompassing market size, growth trends, competitive landscape, and future projections. The study period covers 2019-2033, with 2025 as the base and estimated year. The report is crucial for investors, businesses, and industry professionals seeking a detailed understanding of this rapidly evolving market. Parent markets include e-commerce and digital finance, while child markets encompass online retail, travel, and healthcare. The market size is projected to reach xx Million by 2033.
Asia Pacific Pay Later Industry Market Dynamics & Structure
This section analyzes the market concentration, technological innovation, regulatory environment, competitive landscape, and M&A activities within the Asia Pacific BNPL industry. The market is characterized by a mix of established players and emerging fintech companies.
- Market Concentration: The market is moderately concentrated, with a few dominant players and numerous smaller competitors. Market share data for 2024 shows that the top 5 players hold approximately xx% of the market.
- Technological Innovation: Key drivers include advancements in AI-powered risk assessment, open banking integration, and mobile payment technologies. Barriers include data privacy concerns and the need for robust fraud prevention systems.
- Regulatory Frameworks: Varying regulatory landscapes across different Asia Pacific countries impact market growth, posing both opportunities and challenges for BNPL providers.
- Competitive Product Substitutes: Traditional credit cards and installment payment plans remain primary substitutes. The competitive intensity is high, leading to price wars and innovation in service offerings.
- End-User Demographics: The primary target demographic comprises millennials and Gen Z, known for their digital affinity and preference for flexible payment options. Their adoption rates significantly drive market growth.
- M&A Trends: The BNPL sector has witnessed a surge in mergers and acquisitions in recent years, primarily driven by companies seeking to expand their market reach and product offerings. An estimated xx M&A deals were recorded between 2020 and 2024.
Asia Pacific Pay Later Industry Growth Trends & Insights
The Asia Pacific BNPL market has experienced significant growth, driven by increasing e-commerce adoption, rising smartphone penetration, and changing consumer preferences for flexible payment solutions. Utilizing proprietary data and market research, this section presents a detailed analysis of market size evolution, adoption rates, and consumer behaviour shifts.
The market is projected to grow at a Compound Annual Growth Rate (CAGR) of xx% from 2025 to 2033, exceeding xx Million by the end of the forecast period. Market penetration is estimated at xx% in 2025 and is expected to reach xx% by 2033. Technological disruptions, such as embedded finance and super apps, are accelerating adoption rates. Consumer behaviour is shifting towards greater preference for instant gratification and flexible payment options, contributing to the market's expansion.
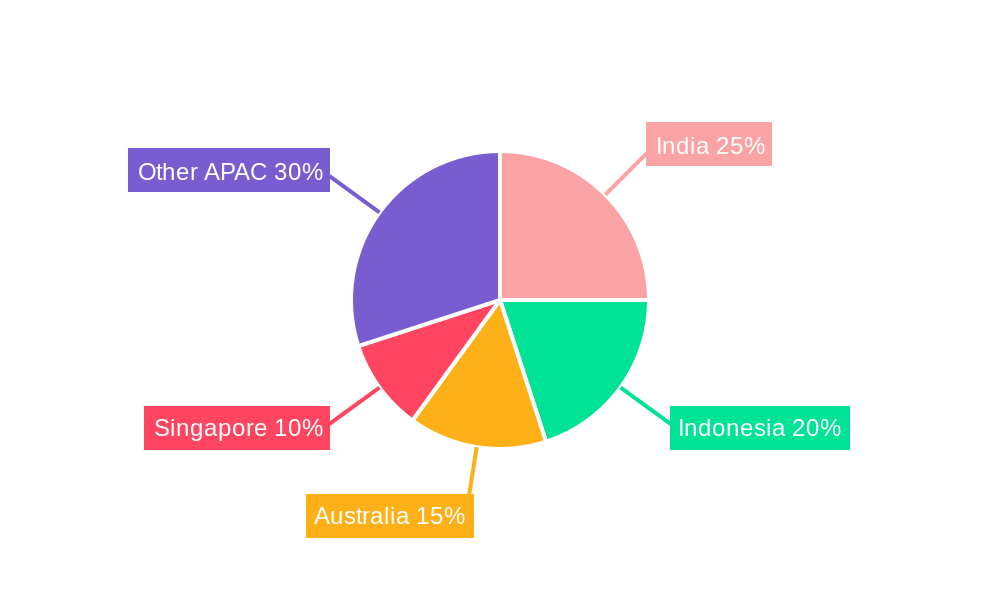
Dominant Regions, Countries, or Segments in Asia Pacific Pay Later Industry
This section identifies the leading regions and countries driving growth within the Asia Pacific BNPL market.
- Key Drivers: Rapid digitalization, increasing smartphone penetration, and supportive government policies are major growth drivers. Robust e-commerce infrastructure in countries like China, India, and Australia is another crucial factor.
- Dominance Factors: China and India are currently the dominant markets due to their vast populations, high e-commerce penetration, and rising middle class. However, other countries like Australia, Singapore, and Indonesia are experiencing rapid growth.
- Market Share & Growth Potential: China holds the largest market share, followed by India and Australia. Countries with high growth potential include Indonesia, Vietnam, and the Philippines, due to their young populations and increasing internet/smartphone penetration.
Asia Pacific Pay Later Industry Product Landscape
The BNPL product landscape encompasses various offerings, including point-of-sale financing, installment loans, and buy now, pay later services integrated with e-commerce platforms. Innovation focuses on enhancing user experience, improving risk management, and providing personalized payment options. Key technological advancements involve AI-powered credit scoring and seamless integration with existing payment gateways. Unique selling propositions (USPs) include flexible repayment terms, ease of use, and reduced paperwork.
Key Drivers, Barriers & Challenges in Asia Pacific Pay Later Industry
Key Drivers: The rising popularity of e-commerce, increasing smartphone penetration, and the growing preference for convenient and flexible payment options are primary drivers. Technological advancements, like AI-powered risk assessment and streamlined onboarding processes, are also accelerating market growth. Government support for digital finance initiatives in several countries provides further impetus.
Challenges & Restraints: Regulatory uncertainty and varying legal frameworks across different countries create challenges for BNPL providers. High default rates, especially in emerging markets, can negatively impact profitability. Intense competition and the risk of fraud also pose significant challenges. Supply chain disruptions due to global events impact businesses depending on BNPL.
Emerging Opportunities in Asia Pacific Pay Later Industry
Untapped markets in Southeast Asia present significant opportunities for expansion. Integration with super apps and embedded finance platforms can provide wider reach and enhance user experience. Tailoring BNPL solutions to specific industry needs, such as healthcare and education, also presents promising avenues. The adoption of innovative technologies, including blockchain and AI, offers further opportunities to enhance security and efficiency.
Growth Accelerators in the Asia Pacific Pay Later Industry
Technological advancements, such as AI-driven fraud detection and personalized payment plans, will significantly drive growth. Strategic partnerships with e-commerce platforms and financial institutions will broaden market reach. Expansion into underserved markets and developing customized solutions for specific customer segments will further accelerate the industry's growth.
Key Players Shaping the Asia Pacific Pay Later Industry Market
- Reepay
- Akulaku
- Hoolah
- Atome
- Pine Lab
- Zest Money BNPL
- Openpay (Australia)
- Rely (Singapore)
- Limepay (Australia)
- PayRight (Australia)
- List Not Exhaustive
Notable Milestones in Asia Pacific Pay Later Industry Sector
- June 2022: Kuaishou launched Sesame Credit's BNPL service in China, enabling users to try before they buy.
- February 2023: CRED launched its BNPL service in India, partnering with various merchants.
In-Depth Asia Pacific Pay Later Industry Market Outlook
The Asia Pacific BNPL market is poised for continued expansion, driven by technological innovation, increasing digital adoption, and evolving consumer preferences. Strategic partnerships, market expansion into untapped regions, and the development of innovative payment solutions will shape the industry's future. The market’s robust growth potential attracts significant investment and creates ample opportunities for both established players and emerging fintech companies.
Asia Pacific Pay Later Industry Segmentation
-
1. Channel
- 1.1. Online
- 1.2. POS
-
2. Enterprise
- 2.1. Large Enterprises
- 2.2. Small & Medium Enterprises
- 2.3. Others
-
3. End User
- 3.1. Consmer electronics
- 3.2. Fashion & garments
- 3.3. Healthcare
- 3.4. Leisure & entertainment
- 3.5. Retail
- 3.6. Others
Asia Pacific Pay Later Industry Segmentation By Geography
-
1. Asia Pacific
- 1.1. China
- 1.2. Japan
- 1.3. South Korea
- 1.4. India
- 1.5. Australia
- 1.6. New Zealand
- 1.7. Indonesia
- 1.8. Malaysia
- 1.9. Singapore
- 1.10. Thailand
- 1.11. Vietnam
- 1.12. Philippines
Asia Pacific Pay Later Industry REPORT HIGHLIGHTS
| Aspects | Details |
|---|---|
| Study Period | 2019-2033 |
| Base Year | 2024 |
| Estimated Year | 2025 |
| Forecast Period | 2025-2033 |
| Historical Period | 2019-2024 |
| Growth Rate | CAGR of 16.56% from 2019-2033 |
| Segmentation |
|
Table of Contents
- 1. Introduction
- 1.1. Research Scope
- 1.2. Market Segmentation
- 1.3. Research Methodology
- 1.4. Definitions and Assumptions
- 2. Executive Summary
- 2.1. Introduction
- 3. Market Dynamics
- 3.1. Introduction
- 3.2. Market Drivers
- 3.2.1. Lack Of Credit Availability In Small Transaction Driving BNPL Services; Rise In The Value Of Digital Transaction In Asia Pacific
- 3.3. Market Restrains
- 3.3.1. Lack Of Credit Availability In Small Transaction Driving BNPL Services; Rise In The Value Of Digital Transaction In Asia Pacific
- 3.4. Market Trends
- 3.4.1. Rising Digital Payments
- 4. Market Factor Analysis
- 4.1. Porters Five Forces
- 4.2. Supply/Value Chain
- 4.3. PESTEL analysis
- 4.4. Market Entropy
- 4.5. Patent/Trademark Analysis
- 5. Asia Pacific Pay Later Industry Analysis, Insights and Forecast, 2019-2031
- 5.1. Market Analysis, Insights and Forecast - by Channel
- 5.1.1. Online
- 5.1.2. POS
- 5.2. Market Analysis, Insights and Forecast - by Enterprise
- 5.2.1. Large Enterprises
- 5.2.2. Small & Medium Enterprises
- 5.2.3. Others
- 5.3. Market Analysis, Insights and Forecast - by End User
- 5.3.1. Consmer electronics
- 5.3.2. Fashion & garments
- 5.3.3. Healthcare
- 5.3.4. Leisure & entertainment
- 5.3.5. Retail
- 5.3.6. Others
- 5.4. Market Analysis, Insights and Forecast - by Region
- 5.4.1. Asia Pacific
- 5.1. Market Analysis, Insights and Forecast - by Channel
- 6. Competitive Analysis
- 6.1. Market Share Analysis 2024
- 6.2. Company Profiles
- 6.2.1 Reepay
- 6.2.1.1. Overview
- 6.2.1.2. Products
- 6.2.1.3. SWOT Analysis
- 6.2.1.4. Recent Developments
- 6.2.1.5. Financials (Based on Availability)
- 6.2.2 Akulaku
- 6.2.2.1. Overview
- 6.2.2.2. Products
- 6.2.2.3. SWOT Analysis
- 6.2.2.4. Recent Developments
- 6.2.2.5. Financials (Based on Availability)
- 6.2.3 Hoolah
- 6.2.3.1. Overview
- 6.2.3.2. Products
- 6.2.3.3. SWOT Analysis
- 6.2.3.4. Recent Developments
- 6.2.3.5. Financials (Based on Availability)
- 6.2.4 Atome
- 6.2.4.1. Overview
- 6.2.4.2. Products
- 6.2.4.3. SWOT Analysis
- 6.2.4.4. Recent Developments
- 6.2.4.5. Financials (Based on Availability)
- 6.2.5 Pine Lab
- 6.2.5.1. Overview
- 6.2.5.2. Products
- 6.2.5.3. SWOT Analysis
- 6.2.5.4. Recent Developments
- 6.2.5.5. Financials (Based on Availability)
- 6.2.6 Zest Money BNPL
- 6.2.6.1. Overview
- 6.2.6.2. Products
- 6.2.6.3. SWOT Analysis
- 6.2.6.4. Recent Developments
- 6.2.6.5. Financials (Based on Availability)
- 6.2.7 Openpay (Australia)
- 6.2.7.1. Overview
- 6.2.7.2. Products
- 6.2.7.3. SWOT Analysis
- 6.2.7.4. Recent Developments
- 6.2.7.5. Financials (Based on Availability)
- 6.2.8 Rely (Singapore)
- 6.2.8.1. Overview
- 6.2.8.2. Products
- 6.2.8.3. SWOT Analysis
- 6.2.8.4. Recent Developments
- 6.2.8.5. Financials (Based on Availability)
- 6.2.9 Limepay (Australia)
- 6.2.9.1. Overview
- 6.2.9.2. Products
- 6.2.9.3. SWOT Analysis
- 6.2.9.4. Recent Developments
- 6.2.9.5. Financials (Based on Availability)
- 6.2.10 PayRight (Australia)**List Not Exhaustive
- 6.2.10.1. Overview
- 6.2.10.2. Products
- 6.2.10.3. SWOT Analysis
- 6.2.10.4. Recent Developments
- 6.2.10.5. Financials (Based on Availability)
- 6.2.1 Reepay
List of Figures
- Figure 1: Asia Pacific Pay Later Industry Revenue Breakdown (Million, %) by Product 2024 & 2032
- Figure 2: Asia Pacific Pay Later Industry Share (%) by Company 2024
List of Tables
- Table 1: Asia Pacific Pay Later Industry Revenue Million Forecast, by Region 2019 & 2032
- Table 2: Asia Pacific Pay Later Industry Volume Billion Forecast, by Region 2019 & 2032
- Table 3: Asia Pacific Pay Later Industry Revenue Million Forecast, by Channel 2019 & 2032
- Table 4: Asia Pacific Pay Later Industry Volume Billion Forecast, by Channel 2019 & 2032
- Table 5: Asia Pacific Pay Later Industry Revenue Million Forecast, by Enterprise 2019 & 2032
- Table 6: Asia Pacific Pay Later Industry Volume Billion Forecast, by Enterprise 2019 & 2032
- Table 7: Asia Pacific Pay Later Industry Revenue Million Forecast, by End User 2019 & 2032
- Table 8: Asia Pacific Pay Later Industry Volume Billion Forecast, by End User 2019 & 2032
- Table 9: Asia Pacific Pay Later Industry Revenue Million Forecast, by Region 2019 & 2032
- Table 10: Asia Pacific Pay Later Industry Volume Billion Forecast, by Region 2019 & 2032
- Table 11: Asia Pacific Pay Later Industry Revenue Million Forecast, by Channel 2019 & 2032
- Table 12: Asia Pacific Pay Later Industry Volume Billion Forecast, by Channel 2019 & 2032
- Table 13: Asia Pacific Pay Later Industry Revenue Million Forecast, by Enterprise 2019 & 2032
- Table 14: Asia Pacific Pay Later Industry Volume Billion Forecast, by Enterprise 2019 & 2032
- Table 15: Asia Pacific Pay Later Industry Revenue Million Forecast, by End User 2019 & 2032
- Table 16: Asia Pacific Pay Later Industry Volume Billion Forecast, by End User 2019 & 2032
- Table 17: Asia Pacific Pay Later Industry Revenue Million Forecast, by Country 2019 & 2032
- Table 18: Asia Pacific Pay Later Industry Volume Billion Forecast, by Country 2019 & 2032
- Table 19: China Asia Pacific Pay Later Industry Revenue (Million) Forecast, by Application 2019 & 2032
- Table 20: China Asia Pacific Pay Later Industry Volume (Billion) Forecast, by Application 2019 & 2032
- Table 21: Japan Asia Pacific Pay Later Industry Revenue (Million) Forecast, by Application 2019 & 2032
- Table 22: Japan Asia Pacific Pay Later Industry Volume (Billion) Forecast, by Application 2019 & 2032
- Table 23: South Korea Asia Pacific Pay Later Industry Revenue (Million) Forecast, by Application 2019 & 2032
- Table 24: South Korea Asia Pacific Pay Later Industry Volume (Billion) Forecast, by Application 2019 & 2032
- Table 25: India Asia Pacific Pay Later Industry Revenue (Million) Forecast, by Application 2019 & 2032
- Table 26: India Asia Pacific Pay Later Industry Volume (Billion) Forecast, by Application 2019 & 2032
- Table 27: Australia Asia Pacific Pay Later Industry Revenue (Million) Forecast, by Application 2019 & 2032
- Table 28: Australia Asia Pacific Pay Later Industry Volume (Billion) Forecast, by Application 2019 & 2032
- Table 29: New Zealand Asia Pacific Pay Later Industry Revenue (Million) Forecast, by Application 2019 & 2032
- Table 30: New Zealand Asia Pacific Pay Later Industry Volume (Billion) Forecast, by Application 2019 & 2032
- Table 31: Indonesia Asia Pacific Pay Later Industry Revenue (Million) Forecast, by Application 2019 & 2032
- Table 32: Indonesia Asia Pacific Pay Later Industry Volume (Billion) Forecast, by Application 2019 & 2032
- Table 33: Malaysia Asia Pacific Pay Later Industry Revenue (Million) Forecast, by Application 2019 & 2032
- Table 34: Malaysia Asia Pacific Pay Later Industry Volume (Billion) Forecast, by Application 2019 & 2032
- Table 35: Singapore Asia Pacific Pay Later Industry Revenue (Million) Forecast, by Application 2019 & 2032
- Table 36: Singapore Asia Pacific Pay Later Industry Volume (Billion) Forecast, by Application 2019 & 2032
- Table 37: Thailand Asia Pacific Pay Later Industry Revenue (Million) Forecast, by Application 2019 & 2032
- Table 38: Thailand Asia Pacific Pay Later Industry Volume (Billion) Forecast, by Application 2019 & 2032
- Table 39: Vietnam Asia Pacific Pay Later Industry Revenue (Million) Forecast, by Application 2019 & 2032
- Table 40: Vietnam Asia Pacific Pay Later Industry Volume (Billion) Forecast, by Application 2019 & 2032
- Table 41: Philippines Asia Pacific Pay Later Industry Revenue (Million) Forecast, by Application 2019 & 2032
- Table 42: Philippines Asia Pacific Pay Later Industry Volume (Billion) Forecast, by Application 2019 & 2032
Frequently Asked Questions
1. What is the projected Compound Annual Growth Rate (CAGR) of the Asia Pacific Pay Later Industry?
The projected CAGR is approximately 16.56%.
2. Which companies are prominent players in the Asia Pacific Pay Later Industry?
Key companies in the market include Reepay, Akulaku, Hoolah, Atome, Pine Lab, Zest Money BNPL, Openpay (Australia), Rely (Singapore), Limepay (Australia), PayRight (Australia)**List Not Exhaustive.
3. What are the main segments of the Asia Pacific Pay Later Industry?
The market segments include Channel, Enterprise, End User.
4. Can you provide details about the market size?
The market size is estimated to be USD 155.72 Million as of 2022.
5. What are some drivers contributing to market growth?
Lack Of Credit Availability In Small Transaction Driving BNPL Services; Rise In The Value Of Digital Transaction In Asia Pacific.
6. What are the notable trends driving market growth?
Rising Digital Payments.
7. Are there any restraints impacting market growth?
Lack Of Credit Availability In Small Transaction Driving BNPL Services; Rise In The Value Of Digital Transaction In Asia Pacific.
8. Can you provide examples of recent developments in the market?
In June 2022, China E-commerce firm Kuaishou launched Sesame Credit's buy now and pay later (BNPL) service. Under the service users with a Sesame score of 550 and above will be able to order, receive, and try the products before paying on its e-commerce platform allowing its customers to easily return and exchange goods.
9. What pricing options are available for accessing the report?
Pricing options include single-user, multi-user, and enterprise licenses priced at USD 4750, USD 4950, and USD 6800 respectively.
10. Is the market size provided in terms of value or volume?
The market size is provided in terms of value, measured in Million and volume, measured in Billion.
11. Are there any specific market keywords associated with the report?
Yes, the market keyword associated with the report is "Asia Pacific Pay Later Industry," which aids in identifying and referencing the specific market segment covered.
12. How do I determine which pricing option suits my needs best?
The pricing options vary based on user requirements and access needs. Individual users may opt for single-user licenses, while businesses requiring broader access may choose multi-user or enterprise licenses for cost-effective access to the report.
13. Are there any additional resources or data provided in the Asia Pacific Pay Later Industry report?
While the report offers comprehensive insights, it's advisable to review the specific contents or supplementary materials provided to ascertain if additional resources or data are available.
14. How can I stay updated on further developments or reports in the Asia Pacific Pay Later Industry?
To stay informed about further developments, trends, and reports in the Asia Pacific Pay Later Industry, consider subscribing to industry newsletters, following relevant companies and organizations, or regularly checking reputable industry news sources and publications.
Methodology
Step 1 - Identification of Relevant Samples Size from Population Database


Step 2 - Approaches for Defining Global Market Size (Value, Volume* & Price*)

Note*: In applicable scenarios
Step 3 - Data Sources
Primary Research
- Web Analytics
- Survey Reports
- Research Institute
- Latest Research Reports
- Opinion Leaders
Secondary Research
- Annual Reports
- White Paper
- Latest Press Release
- Industry Association
- Paid Database
- Investor Presentations

Step 4 - Data Triangulation
Involves using different sources of information in order to increase the validity of a study
These sources are likely to be stakeholders in a program - participants, other researchers, program staff, other community members, and so on.
Then we put all data in single framework & apply various statistical tools to find out the dynamic on the market.
During the analysis stage, feedback from the stakeholder groups would be compared to determine areas of agreement as well as areas of divergence
