

Key Insights
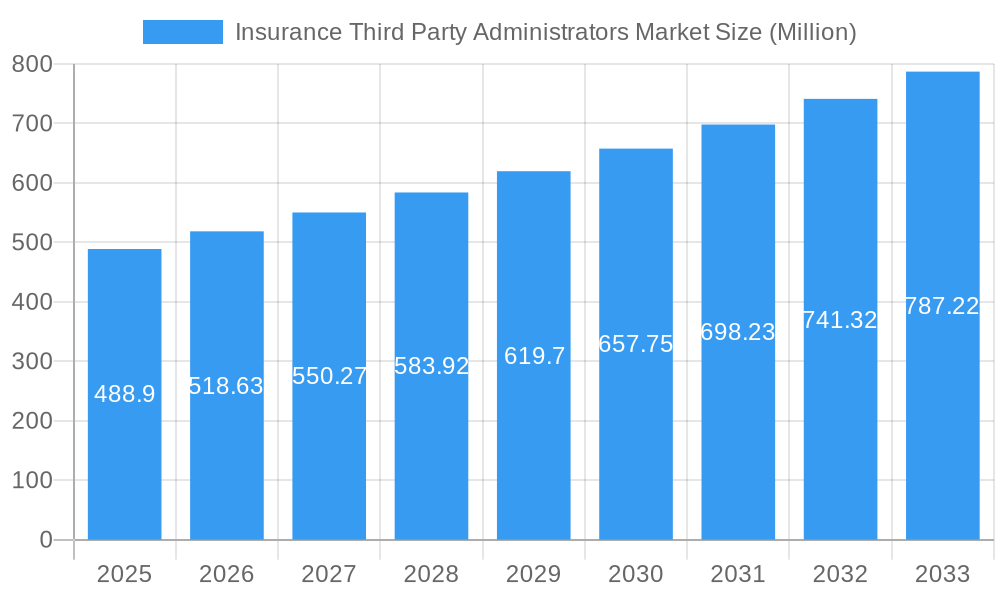
The Insurance Third Party Administrators (TPA) market, valued at $488.90 million in 2025, is projected to experience robust growth, driven by several key factors. The increasing complexity of insurance claims processing, coupled with the rising demand for cost-effective and efficient administration solutions, is fueling market expansion. A significant driver is the growing adoption of technology within the insurance sector, including automation and data analytics, which enhances accuracy and speed in claims management. Furthermore, the increasing prevalence of chronic diseases and the consequent rise in healthcare expenses are compelling insurance providers to outsource administrative tasks to TPAs, optimizing operational efficiency and resource allocation. The market is witnessing a shift towards specialized TPAs catering to niche segments like workers' compensation and healthcare, leading to heightened competition and innovation. This competitive landscape is further shaping the market through mergers, acquisitions, and the development of advanced technologies like AI-powered claims assessment and fraud detection systems. Leading players such as Sedgwick Claims Management Services Inc., UMR Inc., and Crawford & Company are actively investing in technological advancements and strategic partnerships to consolidate their market position and cater to evolving client needs.
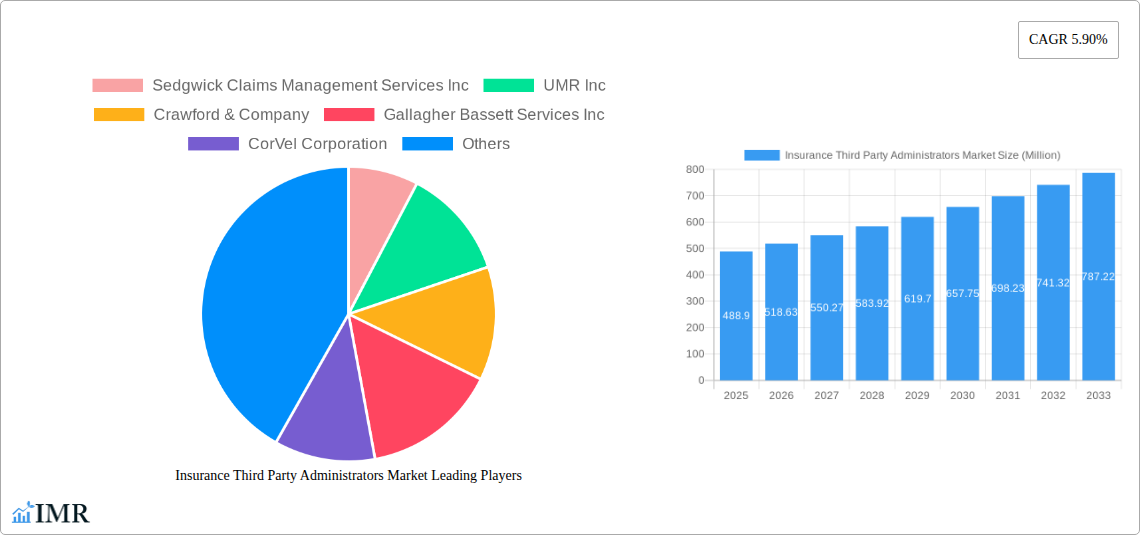
Insurance Third Party Administrators Market Market Size (In Million)
The market's Compound Annual Growth Rate (CAGR) of 5.90% from 2025 to 2033 suggests a continuous and substantial expansion. This growth trajectory is expected to be further influenced by favorable regulatory environments in several regions, encouraging the adoption of TPA services. However, potential restraints include data security concerns related to sensitive patient and claims information, and the need for robust compliance with evolving data privacy regulations. Successfully navigating these challenges will be critical for TPA providers to maintain sustainable growth and solidify their market leadership. Future growth will be significantly influenced by the level of technological adoption and the capacity of TPAs to adapt to the evolving needs of both insurance providers and beneficiaries.
Insurance Third Party Administrators Market Company Market Share
Insurance Third Party Administrators Market: A Comprehensive Report (2019-2033)
This comprehensive report provides a deep dive into the Insurance Third Party Administrators (TPA) market, offering invaluable insights for industry professionals, investors, and strategic decision-makers. With a study period spanning 2019-2033, a base year of 2025, and a forecast period of 2025-2033, this report analyzes market dynamics, growth trends, and key players, providing a clear roadmap for navigating this evolving landscape. The report's detailed analysis considers both the parent market (Insurance Services) and the child market (Third-Party Administration within Insurance). Market values are presented in million units.
Insurance Third Party Administrators Market Market Dynamics & Structure
This section analyzes the competitive landscape of the Insurance Third Party Administrators market, focusing on market concentration, technological advancements, regulatory influences, and market dynamics. The market is characterized by a moderately concentrated structure, with key players holding significant shares. However, smaller niche players also exist, particularly in specialized segments.
- Market Concentration: The top 5 players hold an estimated xx% market share in 2025. Smaller, specialized TPAs account for the remaining xx%.
- Technological Innovation: Digital transformation, including AI-powered claims processing and blockchain technology for fraud prevention, is driving significant change. However, high initial investment costs pose a barrier to entry for smaller players.
- Regulatory Frameworks: Varying regulations across different geographies significantly impact operational costs and compliance requirements. Changes in data privacy regulations, like GDPR and CCPA, also influence market dynamics.
- Competitive Product Substitutes: Insurers can manage claims in-house, although this is often less cost-effective, leading to consistent demand for TPAs.
- End-User Demographics: The market is driven by diverse end-users including large multinational corporations, small and medium-sized businesses, and individual consumers (especially in the health insurance segment).
- M&A Trends: The market has witnessed a significant number of mergers and acquisitions (M&As) in recent years, with an estimated xx deals in the last 5 years. These deals are primarily driven by expansion strategies and technological integration opportunities.
Insurance Third Party Administrators Market Growth Trends & Insights
The Insurance TPA market exhibits robust growth, fueled by the increasing outsourcing of claims management by insurance companies. Technological advancements continue to enhance efficiency, while evolving consumer expectations drive demand for improved customer service.
The market size was valued at XXX million in 2024 and is projected to reach XXX million in 2025 and XXX million by 2033, demonstrating a CAGR of xx% during the forecast period. Adoption rates are increasing steadily, driven by the cost-effectiveness and efficiency improvements TPAs offer. Technological disruptions, particularly in claims automation and data analytics, are reshaping the operational models of TPAs. Changes in consumer behavior, particularly the increasing preference for digital self-service platforms, are influencing the demand for technologically advanced TPA solutions.
Dominant Regions, Countries, or Segments in Insurance Third Party Administrators Market
North America currently dominates the global Insurance TPA market, holding the largest market share in 2025 (estimated xx%). This is attributed to the high prevalence of health and property insurance and the advanced technological infrastructure. Europe follows as a significant market, with continued growth driven by the increasing demand for outsourced insurance services. Asia Pacific is expected to witness significant growth in the forecast period, owing to its large and rapidly expanding insurance sector.
- North America: High insurance penetration, advanced technology, and a well-developed regulatory framework fuel growth.
- Europe: Stringent regulatory compliance and a large insurance market contribute to substantial demand.
- Asia Pacific: Rapid economic growth and increasing insurance awareness are key drivers of market expansion.
Insurance Third Party Administrators Market Product Landscape
The Insurance TPA market offers a range of products and services, including claims management, medical bill review, utilization management, and fraud detection. Technological advancements have led to the development of sophisticated software platforms and AI-driven solutions, significantly enhancing the efficiency and accuracy of TPA services. Unique selling propositions often center around advanced technology, specialized expertise in niche segments, and superior customer service.
Key Drivers, Barriers & Challenges in Insurance Third Party Administrators Market
Key Drivers:
- Increasing outsourcing of insurance processes by insurers to improve efficiency and reduce costs.
- Growing adoption of advanced technologies like AI and machine learning to improve claims processing and fraud detection.
- Rising demand for specialized services, such as workers' compensation and auto claims management.
Key Challenges:
- Intense competition among established and emerging players.
- Strict regulatory compliance requirements that vary by region and insurance type.
- Maintaining data security and privacy in an increasingly interconnected environment.
Emerging Opportunities in Insurance Third Party Administrators Market
Untapped markets in developing economies, the increasing adoption of telehealth and remote healthcare services, and the rising demand for specialized TPA solutions in niche insurance segments (cybersecurity, for instance) present significant growth opportunities. Innovative approaches to claims management, such as using blockchain technology for improved transparency and security, are also generating substantial interest.
Growth Accelerators in the Insurance Third Party Administrators Market Industry
Technological advancements, strategic partnerships between TPAs and insurance companies, and expansion into new geographical markets are key catalysts for long-term growth. The increasing focus on data analytics and predictive modeling is further enhancing efficiency and driving cost reduction, fostering strong market expansion.
Key Players Shaping the Insurance Third Party Administrators Market Market
- Sedgwick Claims Management Services Inc
- UMR Inc
- Crawford & Company
- Gallagher Bassett Services Inc
- CorVel Corporation
- Helmsman Management Services LLC
- ESIS Inc
- Healthscope Benefits
- Maritain Health
List Not Exhaustive
Notable Milestones in Insurance Third Party Administrators Market Sector
- March 2023: Medi Assist's acquisition of Raksha Insurance significantly expands its retail presence in India.
- December 2022: Sedgwick's launch of a new UK-based resource solutions unit strengthens its service offerings.
In-Depth Insurance Third Party Administrators Market Market Outlook
The Insurance TPA market is poised for continued growth, driven by technological innovation and increasing demand for efficient and cost-effective insurance services. Strategic partnerships, expansion into new markets, and the development of innovative solutions will be key to success in this dynamic sector. The market's future potential is substantial, offering significant opportunities for both established players and new entrants.
Insurance Third Party Administrators Market Segmentation
-
1. Insurance Type
- 1.1. Healthcare Insurance
- 1.2. Retirement Plans
- 1.3. Commercial General Liability Insurance
- 1.4. Others Insurance Types (Motor Insurance)
Insurance Third Party Administrators Market Segmentation By Geography
-
1. North America
- 1.1. United States
- 1.2. Canada
-
2. Europe
- 2.1. United Kingdom
- 2.2. Germany
- 2.3. Rest of Europe
-
3. Asia Pacific
- 3.1. China
- 3.2. India
- 3.3. Rest of Asia Pacific
-
4. Middle East and Africa
- 4.1. United Arab Emirates
- 4.2. Saudi Arabia
- 4.3. Rest of Middle East and Africa
- 5. Rest of the World
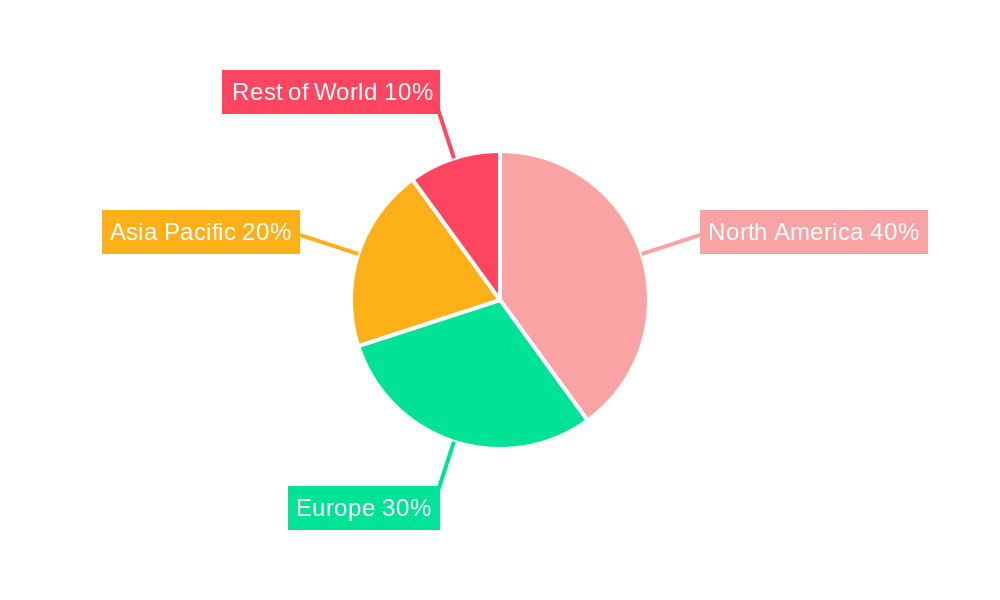
Insurance Third Party Administrators Market Regional Market Share
Geographic Coverage of Insurance Third Party Administrators Market
Insurance Third Party Administrators Market REPORT HIGHLIGHTS
| Aspects | Details |
|---|---|
| Study Period | 2020-2034 |
| Base Year | 2025 |
| Estimated Year | 2026 |
| Forecast Period | 2026-2034 |
| Historical Period | 2020-2025 |
| Growth Rate | CAGR of 5.90% from 2020-2034 |
| Segmentation |
|
Table of Contents
- 1. Introduction
- 1.1. Research Scope
- 1.2. Market Segmentation
- 1.3. Research Objective
- 1.4. Definitions and Assumptions
- 2. Executive Summary
- 2.1. Market Snapshot
- 3. Market Dynamics
- 3.1. Market Drivers
- 3.2. Market Restrains
- 3.3. Market Trends
- 3.4. Market Opportunities
- 4. Market Factor Analysis
- 4.1. Porters Five Forces
- 4.1.1. Bargaining Power of Suppliers
- 4.1.2. Bargaining Power of Buyers
- 4.1.3. Threat of New Entrants
- 4.1.4. Threat of Substitutes
- 4.1.5. Competitive Rivalry
- 4.2. PESTEL analysis
- 4.3. BCG Analysis
- 4.3.1. Stars (High Growth, High Market Share)
- 4.3.2. Cash Cows (Low Growth, High Market Share)
- 4.3.3. Question Mark (High Growth, Low Market Share)
- 4.3.4. Dogs (Low Growth, Low Market Share)
- 4.4. Ansoff Matrix Analysis
- 4.5. Supply Chain Analysis
- 4.6. Regulatory Landscape
- 4.7. Current Market Potential and Opportunity Assessment (TAM–SAM–SOM Framework)
- 4.8. IMR Analyst Note
- 4.1. Porters Five Forces
- 5. Market Analysis, Insights and Forecast 2021-2033
- 5.1. Market Analysis, Insights and Forecast - by Insurance Type
- 5.1.1. Healthcare Insurance
- 5.1.2. Retirement Plans
- 5.1.3. Commercial General Liability Insurance
- 5.1.4. Others Insurance Types (Motor Insurance)
- 5.2. Market Analysis, Insights and Forecast - by Region
- 5.2.1. North America
- 5.2.2. Europe
- 5.2.3. Asia Pacific
- 5.2.4. Middle East and Africa
- 5.2.5. Rest of the World
- 5.1. Market Analysis, Insights and Forecast - by Insurance Type
- 6. Global Insurance Third Party Administrators Market Analysis, Insights and Forecast, 2021-2033
- 6.1. Market Analysis, Insights and Forecast - by Insurance Type
- 6.1.1. Healthcare Insurance
- 6.1.2. Retirement Plans
- 6.1.3. Commercial General Liability Insurance
- 6.1.4. Others Insurance Types (Motor Insurance)
- 6.1. Market Analysis, Insights and Forecast - by Insurance Type
- 7. North America Insurance Third Party Administrators Market Analysis, Insights and Forecast, 2020-2032
- 7.1. Market Analysis, Insights and Forecast - by Insurance Type
- 7.1.1. Healthcare Insurance
- 7.1.2. Retirement Plans
- 7.1.3. Commercial General Liability Insurance
- 7.1.4. Others Insurance Types (Motor Insurance)
- 7.1. Market Analysis, Insights and Forecast - by Insurance Type
- 8. Europe Insurance Third Party Administrators Market Analysis, Insights and Forecast, 2020-2032
- 8.1. Market Analysis, Insights and Forecast - by Insurance Type
- 8.1.1. Healthcare Insurance
- 8.1.2. Retirement Plans
- 8.1.3. Commercial General Liability Insurance
- 8.1.4. Others Insurance Types (Motor Insurance)
- 8.1. Market Analysis, Insights and Forecast - by Insurance Type
- 9. Asia Pacific Insurance Third Party Administrators Market Analysis, Insights and Forecast, 2020-2032
- 9.1. Market Analysis, Insights and Forecast - by Insurance Type
- 9.1.1. Healthcare Insurance
- 9.1.2. Retirement Plans
- 9.1.3. Commercial General Liability Insurance
- 9.1.4. Others Insurance Types (Motor Insurance)
- 9.1. Market Analysis, Insights and Forecast - by Insurance Type
- 10. Middle East and Africa Insurance Third Party Administrators Market Analysis, Insights and Forecast, 2020-2032
- 10.1. Market Analysis, Insights and Forecast - by Insurance Type
- 10.1.1. Healthcare Insurance
- 10.1.2. Retirement Plans
- 10.1.3. Commercial General Liability Insurance
- 10.1.4. Others Insurance Types (Motor Insurance)
- 10.1. Market Analysis, Insights and Forecast - by Insurance Type
- 11. Rest of the World Insurance Third Party Administrators Market Analysis, Insights and Forecast, 2020-2032
- 11.1. Market Analysis, Insights and Forecast - by Insurance Type
- 11.1.1. Healthcare Insurance
- 11.1.2. Retirement Plans
- 11.1.3. Commercial General Liability Insurance
- 11.1.4. Others Insurance Types (Motor Insurance)
- 11.1. Market Analysis, Insights and Forecast - by Insurance Type
- 12. Competitive Analysis
- 12.1. Company Profiles
- 12.1.1 Sedgwick Claims Management Services Inc
- 12.1.1.1. Company Overview
- 12.1.1.2. Products
- 12.1.1.3. Company Financials
- 12.1.1.4. SWOT Analysis
- 12.1.2 UMR Inc
- 12.1.2.1. Company Overview
- 12.1.2.2. Products
- 12.1.2.3. Company Financials
- 12.1.2.4. SWOT Analysis
- 12.1.3 Crawford & Company
- 12.1.3.1. Company Overview
- 12.1.3.2. Products
- 12.1.3.3. Company Financials
- 12.1.3.4. SWOT Analysis
- 12.1.4 Gallagher Bassett Services Inc
- 12.1.4.1. Company Overview
- 12.1.4.2. Products
- 12.1.4.3. Company Financials
- 12.1.4.4. SWOT Analysis
- 12.1.5 CorVel Corporation
- 12.1.5.1. Company Overview
- 12.1.5.2. Products
- 12.1.5.3. Company Financials
- 12.1.5.4. SWOT Analysis
- 12.1.6 Helmsman Management Services LLC
- 12.1.6.1. Company Overview
- 12.1.6.2. Products
- 12.1.6.3. Company Financials
- 12.1.6.4. SWOT Analysis
- 12.1.7 ESIS Inc
- 12.1.7.1. Company Overview
- 12.1.7.2. Products
- 12.1.7.3. Company Financials
- 12.1.7.4. SWOT Analysis
- 12.1.8 Healthscope Benefits
- 12.1.8.1. Company Overview
- 12.1.8.2. Products
- 12.1.8.3. Company Financials
- 12.1.8.4. SWOT Analysis
- 12.1.9 Maritain Health**List Not Exhaustive
- 12.1.9.1. Company Overview
- 12.1.9.2. Products
- 12.1.9.3. Company Financials
- 12.1.9.4. SWOT Analysis
- 12.1.1 Sedgwick Claims Management Services Inc
- 12.2. Market Entropy
- 12.2.1 Company's Key Areas Served
- 12.2.2 Recent Developments
- 12.3. Company Market Share Analysis 2025
- 12.3.1 Top 5 Companies Market Share Analysis
- 12.3.2 Top 3 Companies Market Share Analysis
- 12.4. List of Potential Customers
- 13. Research Methodology
List of Figures
- Figure 1: Global Insurance Third Party Administrators Market Revenue Breakdown (Million, %) by Region 2025 & 2033
- Figure 2: Global Insurance Third Party Administrators Market Volume Breakdown (Billion, %) by Region 2025 & 2033
- Figure 3: North America Insurance Third Party Administrators Market Revenue (Million), by Insurance Type 2025 & 2033
- Figure 4: North America Insurance Third Party Administrators Market Volume (Billion), by Insurance Type 2025 & 2033
- Figure 5: North America Insurance Third Party Administrators Market Revenue Share (%), by Insurance Type 2025 & 2033
- Figure 6: North America Insurance Third Party Administrators Market Volume Share (%), by Insurance Type 2025 & 2033
- Figure 7: North America Insurance Third Party Administrators Market Revenue (Million), by Country 2025 & 2033
- Figure 8: North America Insurance Third Party Administrators Market Volume (Billion), by Country 2025 & 2033
- Figure 9: North America Insurance Third Party Administrators Market Revenue Share (%), by Country 2025 & 2033
- Figure 10: North America Insurance Third Party Administrators Market Volume Share (%), by Country 2025 & 2033
- Figure 11: Europe Insurance Third Party Administrators Market Revenue (Million), by Insurance Type 2025 & 2033
- Figure 12: Europe Insurance Third Party Administrators Market Volume (Billion), by Insurance Type 2025 & 2033
- Figure 13: Europe Insurance Third Party Administrators Market Revenue Share (%), by Insurance Type 2025 & 2033
- Figure 14: Europe Insurance Third Party Administrators Market Volume Share (%), by Insurance Type 2025 & 2033
- Figure 15: Europe Insurance Third Party Administrators Market Revenue (Million), by Country 2025 & 2033
- Figure 16: Europe Insurance Third Party Administrators Market Volume (Billion), by Country 2025 & 2033
- Figure 17: Europe Insurance Third Party Administrators Market Revenue Share (%), by Country 2025 & 2033
- Figure 18: Europe Insurance Third Party Administrators Market Volume Share (%), by Country 2025 & 2033
- Figure 19: Asia Pacific Insurance Third Party Administrators Market Revenue (Million), by Insurance Type 2025 & 2033
- Figure 20: Asia Pacific Insurance Third Party Administrators Market Volume (Billion), by Insurance Type 2025 & 2033
- Figure 21: Asia Pacific Insurance Third Party Administrators Market Revenue Share (%), by Insurance Type 2025 & 2033
- Figure 22: Asia Pacific Insurance Third Party Administrators Market Volume Share (%), by Insurance Type 2025 & 2033
- Figure 23: Asia Pacific Insurance Third Party Administrators Market Revenue (Million), by Country 2025 & 2033
- Figure 24: Asia Pacific Insurance Third Party Administrators Market Volume (Billion), by Country 2025 & 2033
- Figure 25: Asia Pacific Insurance Third Party Administrators Market Revenue Share (%), by Country 2025 & 2033
- Figure 26: Asia Pacific Insurance Third Party Administrators Market Volume Share (%), by Country 2025 & 2033
- Figure 27: Middle East and Africa Insurance Third Party Administrators Market Revenue (Million), by Insurance Type 2025 & 2033
- Figure 28: Middle East and Africa Insurance Third Party Administrators Market Volume (Billion), by Insurance Type 2025 & 2033
- Figure 29: Middle East and Africa Insurance Third Party Administrators Market Revenue Share (%), by Insurance Type 2025 & 2033
- Figure 30: Middle East and Africa Insurance Third Party Administrators Market Volume Share (%), by Insurance Type 2025 & 2033
- Figure 31: Middle East and Africa Insurance Third Party Administrators Market Revenue (Million), by Country 2025 & 2033
- Figure 32: Middle East and Africa Insurance Third Party Administrators Market Volume (Billion), by Country 2025 & 2033
- Figure 33: Middle East and Africa Insurance Third Party Administrators Market Revenue Share (%), by Country 2025 & 2033
- Figure 34: Middle East and Africa Insurance Third Party Administrators Market Volume Share (%), by Country 2025 & 2033
- Figure 35: Rest of the World Insurance Third Party Administrators Market Revenue (Million), by Insurance Type 2025 & 2033
- Figure 36: Rest of the World Insurance Third Party Administrators Market Volume (Billion), by Insurance Type 2025 & 2033
- Figure 37: Rest of the World Insurance Third Party Administrators Market Revenue Share (%), by Insurance Type 2025 & 2033
- Figure 38: Rest of the World Insurance Third Party Administrators Market Volume Share (%), by Insurance Type 2025 & 2033
- Figure 39: Rest of the World Insurance Third Party Administrators Market Revenue (Million), by Country 2025 & 2033
- Figure 40: Rest of the World Insurance Third Party Administrators Market Volume (Billion), by Country 2025 & 2033
- Figure 41: Rest of the World Insurance Third Party Administrators Market Revenue Share (%), by Country 2025 & 2033
- Figure 42: Rest of the World Insurance Third Party Administrators Market Volume Share (%), by Country 2025 & 2033
List of Tables
- Table 1: Global Insurance Third Party Administrators Market Revenue Million Forecast, by Insurance Type 2020 & 2033
- Table 2: Global Insurance Third Party Administrators Market Volume Billion Forecast, by Insurance Type 2020 & 2033
- Table 3: Global Insurance Third Party Administrators Market Revenue Million Forecast, by Region 2020 & 2033
- Table 4: Global Insurance Third Party Administrators Market Volume Billion Forecast, by Region 2020 & 2033
- Table 5: Global Insurance Third Party Administrators Market Revenue Million Forecast, by Insurance Type 2020 & 2033
- Table 6: Global Insurance Third Party Administrators Market Volume Billion Forecast, by Insurance Type 2020 & 2033
- Table 7: Global Insurance Third Party Administrators Market Revenue Million Forecast, by Country 2020 & 2033
- Table 8: Global Insurance Third Party Administrators Market Volume Billion Forecast, by Country 2020 & 2033
- Table 9: United States Insurance Third Party Administrators Market Revenue (Million) Forecast, by Application 2020 & 2033
- Table 10: United States Insurance Third Party Administrators Market Volume (Billion) Forecast, by Application 2020 & 2033
- Table 11: Canada Insurance Third Party Administrators Market Revenue (Million) Forecast, by Application 2020 & 2033
- Table 12: Canada Insurance Third Party Administrators Market Volume (Billion) Forecast, by Application 2020 & 2033
- Table 13: Global Insurance Third Party Administrators Market Revenue Million Forecast, by Insurance Type 2020 & 2033
- Table 14: Global Insurance Third Party Administrators Market Volume Billion Forecast, by Insurance Type 2020 & 2033
- Table 15: Global Insurance Third Party Administrators Market Revenue Million Forecast, by Country 2020 & 2033
- Table 16: Global Insurance Third Party Administrators Market Volume Billion Forecast, by Country 2020 & 2033
- Table 17: United Kingdom Insurance Third Party Administrators Market Revenue (Million) Forecast, by Application 2020 & 2033
- Table 18: United Kingdom Insurance Third Party Administrators Market Volume (Billion) Forecast, by Application 2020 & 2033
- Table 19: Germany Insurance Third Party Administrators Market Revenue (Million) Forecast, by Application 2020 & 2033
- Table 20: Germany Insurance Third Party Administrators Market Volume (Billion) Forecast, by Application 2020 & 2033
- Table 21: Rest of Europe Insurance Third Party Administrators Market Revenue (Million) Forecast, by Application 2020 & 2033
- Table 22: Rest of Europe Insurance Third Party Administrators Market Volume (Billion) Forecast, by Application 2020 & 2033
- Table 23: Global Insurance Third Party Administrators Market Revenue Million Forecast, by Insurance Type 2020 & 2033
- Table 24: Global Insurance Third Party Administrators Market Volume Billion Forecast, by Insurance Type 2020 & 2033
- Table 25: Global Insurance Third Party Administrators Market Revenue Million Forecast, by Country 2020 & 2033
- Table 26: Global Insurance Third Party Administrators Market Volume Billion Forecast, by Country 2020 & 2033
- Table 27: China Insurance Third Party Administrators Market Revenue (Million) Forecast, by Application 2020 & 2033
- Table 28: China Insurance Third Party Administrators Market Volume (Billion) Forecast, by Application 2020 & 2033
- Table 29: India Insurance Third Party Administrators Market Revenue (Million) Forecast, by Application 2020 & 2033
- Table 30: India Insurance Third Party Administrators Market Volume (Billion) Forecast, by Application 2020 & 2033
- Table 31: Rest of Asia Pacific Insurance Third Party Administrators Market Revenue (Million) Forecast, by Application 2020 & 2033
- Table 32: Rest of Asia Pacific Insurance Third Party Administrators Market Volume (Billion) Forecast, by Application 2020 & 2033
- Table 33: Global Insurance Third Party Administrators Market Revenue Million Forecast, by Insurance Type 2020 & 2033
- Table 34: Global Insurance Third Party Administrators Market Volume Billion Forecast, by Insurance Type 2020 & 2033
- Table 35: Global Insurance Third Party Administrators Market Revenue Million Forecast, by Country 2020 & 2033
- Table 36: Global Insurance Third Party Administrators Market Volume Billion Forecast, by Country 2020 & 2033
- Table 37: United Arab Emirates Insurance Third Party Administrators Market Revenue (Million) Forecast, by Application 2020 & 2033
- Table 38: United Arab Emirates Insurance Third Party Administrators Market Volume (Billion) Forecast, by Application 2020 & 2033
- Table 39: Saudi Arabia Insurance Third Party Administrators Market Revenue (Million) Forecast, by Application 2020 & 2033
- Table 40: Saudi Arabia Insurance Third Party Administrators Market Volume (Billion) Forecast, by Application 2020 & 2033
- Table 41: Rest of Middle East and Africa Insurance Third Party Administrators Market Revenue (Million) Forecast, by Application 2020 & 2033
- Table 42: Rest of Middle East and Africa Insurance Third Party Administrators Market Volume (Billion) Forecast, by Application 2020 & 2033
- Table 43: Global Insurance Third Party Administrators Market Revenue Million Forecast, by Insurance Type 2020 & 2033
- Table 44: Global Insurance Third Party Administrators Market Volume Billion Forecast, by Insurance Type 2020 & 2033
- Table 45: Global Insurance Third Party Administrators Market Revenue Million Forecast, by Country 2020 & 2033
- Table 46: Global Insurance Third Party Administrators Market Volume Billion Forecast, by Country 2020 & 2033
Frequently Asked Questions
1. What is the projected Compound Annual Growth Rate (CAGR) of the Insurance Third Party Administrators Market?
The projected CAGR is approximately 5.90%.
2. Which companies are prominent players in the Insurance Third Party Administrators Market?
Key companies in the market include Sedgwick Claims Management Services Inc, UMR Inc, Crawford & Company, Gallagher Bassett Services Inc, CorVel Corporation, Helmsman Management Services LLC, ESIS Inc, Healthscope Benefits, Maritain Health**List Not Exhaustive.
3. What are the main segments of the Insurance Third Party Administrators Market?
The market segments include Insurance Type.
4. Can you provide details about the market size?
The market size is estimated to be USD 488.90 Million as of 2022.
5. What are some drivers contributing to market growth?
Increasing Demand for Cost Effective Healthcare Solutions; Rise in Digitalization and Automation is Driving the Market.
6. What are the notable trends driving market growth?
Increasing Healthcare Insurance TPAs is Fuelling the Market.
7. Are there any restraints impacting market growth?
Increasing Demand for Cost Effective Healthcare Solutions; Rise in Digitalization and Automation is Driving the Market.
8. Can you provide examples of recent developments in the market?
March 2023: To grow, Medi Assist, a third-party administrator for health insurance, acquired Raksha Insurance. Medi Assist, based in Bengaluru, will be able to increase significantly its retail capabilities and fortify its position in the nation's interior thanks to the agreement.December 2022: Sedgwick set up a new business unit focused on resource solutions for its insurance clients in the United Kingdom. Sedgwick's experience and technical expertise help clients with temporary and permanent placements across claims handling divisions.
9. What pricing options are available for accessing the report?
Pricing options include single-user, multi-user, and enterprise licenses priced at USD 4750, USD 5250, and USD 8750 respectively.
10. Is the market size provided in terms of value or volume?
The market size is provided in terms of value, measured in Million and volume, measured in Billion.
11. Are there any specific market keywords associated with the report?
Yes, the market keyword associated with the report is "Insurance Third Party Administrators Market," which aids in identifying and referencing the specific market segment covered.
12. How do I determine which pricing option suits my needs best?
The pricing options vary based on user requirements and access needs. Individual users may opt for single-user licenses, while businesses requiring broader access may choose multi-user or enterprise licenses for cost-effective access to the report.
13. Are there any additional resources or data provided in the Insurance Third Party Administrators Market report?
While the report offers comprehensive insights, it's advisable to review the specific contents or supplementary materials provided to ascertain if additional resources or data are available.
14. How can I stay updated on further developments or reports in the Insurance Third Party Administrators Market?
To stay informed about further developments, trends, and reports in the Insurance Third Party Administrators Market, consider subscribing to industry newsletters, following relevant companies and organizations, or regularly checking reputable industry news sources and publications.
Methodology
Step 1 - Identification of Relevant Samples Size from Population Database


Step 2 - Approaches for Defining Global Market Size (Value, Volume* & Price*)

Note*: In applicable scenarios
Step 3 - Data Sources
Primary Research
- Web Analytics
- Survey Reports
- Research Institute
- Latest Research Reports
- Opinion Leaders
Secondary Research
- Annual Reports
- White Paper
- Latest Press Release
- Industry Association
- Paid Database
- Investor Presentations

Step 4 - Data Triangulation
Involves using different sources of information in order to increase the validity of a study
These sources are likely to be stakeholders in a program - participants, other researchers, program staff, other community members, and so on.
Then we put all data in single framework & apply various statistical tools to find out the dynamic on the market.
During the analysis stage, feedback from the stakeholder groups would be compared to determine areas of agreement as well as areas of divergence