

Key Insights
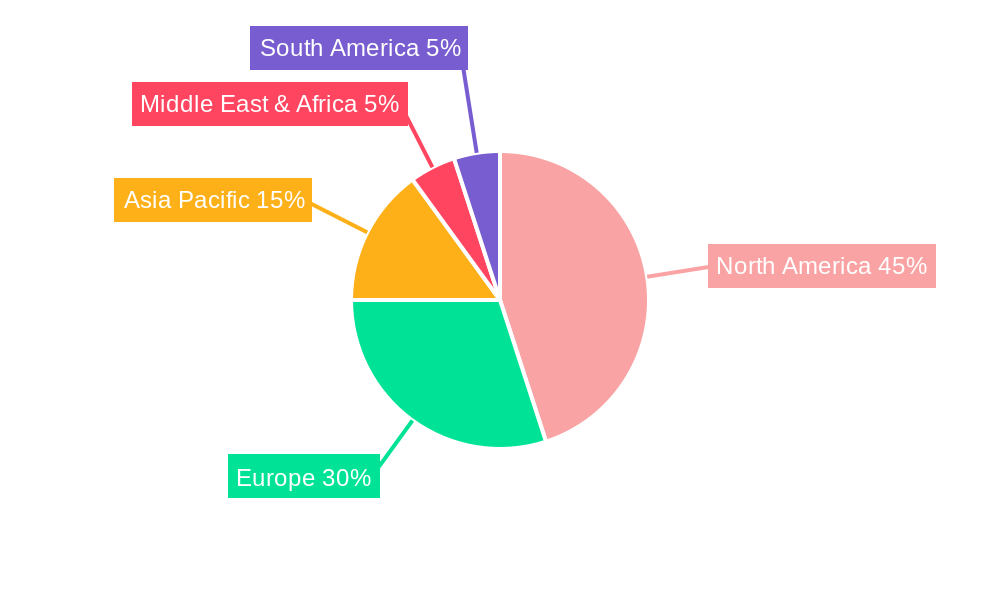
The autologous stem cell and non-stem cell-based therapies market is experiencing robust growth, driven by the increasing prevalence of chronic diseases like cancer, neurodegenerative disorders, and cardiovascular diseases. The market's expansion is fueled by advancements in cell therapy technologies, a growing understanding of stem cell biology, and rising investments in research and development. Personalized medicine approaches, using a patient's own cells, minimize the risk of rejection and offer significant therapeutic potential. The segment categorized as "Other Applications" is likely to see substantial growth due to ongoing research exploring the use of autologous cells in treating various conditions beyond the major disease categories. The high CAGR of 14.26% suggests a consistently expanding market, particularly in regions with advanced healthcare infrastructure and significant research capabilities. North America and Europe currently dominate the market share, but the Asia-Pacific region, with its rapidly developing healthcare sector and increasing disposable incomes, is poised for significant growth in the coming years. The market is segmented by application (cancer, neurodegenerative disorders, cardiovascular disease, orthopedic diseases, other applications), end-user (hospitals, ambulatory surgical centers, research facilities), and type (autologous stem cells, autologous non-stem cells). The competitive landscape comprises both established pharmaceutical giants and emerging biotechnology companies, driving innovation and expanding treatment options.
Hospitals are currently the largest end-user segment, reflecting the complexity of cell therapy administration and the need for specialized facilities. However, the ambulatory surgical center segment is expected to witness accelerated growth due to increasing demand for cost-effective and less invasive procedures. The autologous stem cell segment holds a larger market share compared to the autologous non-stem cell segment, reflecting the current focus on stem cell therapies' regenerative potential. Nevertheless, autologous non-stem cell therapies show potential for growth as research progresses and specific applications are developed and validated. Regulatory hurdles and the high cost of development and treatment remain challenges that will likely impact market growth in the near term. However, the potential for significant advancements and breakthroughs makes the long-term outlook for this market very positive.
This comprehensive report provides an in-depth analysis of the global Autologous Stem Cell and Non-Stem Cell Based Therapies market, covering the period from 2019 to 2033. It delves into market dynamics, growth trends, regional dominance, product landscapes, and key players, offering invaluable insights for industry professionals, investors, and researchers. The report segments the market by application (Cancer, Neurodegenerative Disorders, Cardiovascular Disease, Orthopedic Diseases, Other Applications), end-user (Hospitals, Ambulatory Surgical Centers, Research Facilities), and type (Autologous Stem Cells, Autologous Non-Stem Cells), providing a granular understanding of market size and growth potential across various segments.
Autologous Stem Cell and Non-Stem Cell Based Therapies Industry Market Dynamics & Structure
This section analyzes the competitive landscape, technological advancements, regulatory environment, and market trends influencing the autologous stem cell and non-stem cell based therapies industry. The market is characterized by a moderate level of concentration, with several key players vying for market share. Technological innovation, particularly in cell processing and delivery methods, is a significant driver of growth. Stringent regulatory frameworks, however, pose challenges to market entry and product approvals. The market is witnessing increased M&A activity, with companies strategically acquiring smaller players to expand their product portfolios and enhance their technological capabilities.
- Market Concentration: Moderately concentrated, with top 5 players holding approximately xx% market share in 2025.
- Technological Innovation: Advancements in cell isolation, expansion, and delivery systems are key drivers.
- Regulatory Frameworks: Stringent regulatory pathways for approvals pose significant barriers. Varying regulatory landscapes across different countries add further complexity.
- Competitive Substitutes: Traditional therapies pose competition, impacting market penetration.
- M&A Trends: Increasing number of mergers and acquisitions, particularly targeting smaller companies with innovative technologies. Approximately xx M&A deals were recorded between 2019 and 2024.
- End-User Demographics: Growing aging population driving demand for therapies addressing age-related diseases.
Autologous Stem Cell and Non-Stem Cell Based Therapies Industry Growth Trends & Insights
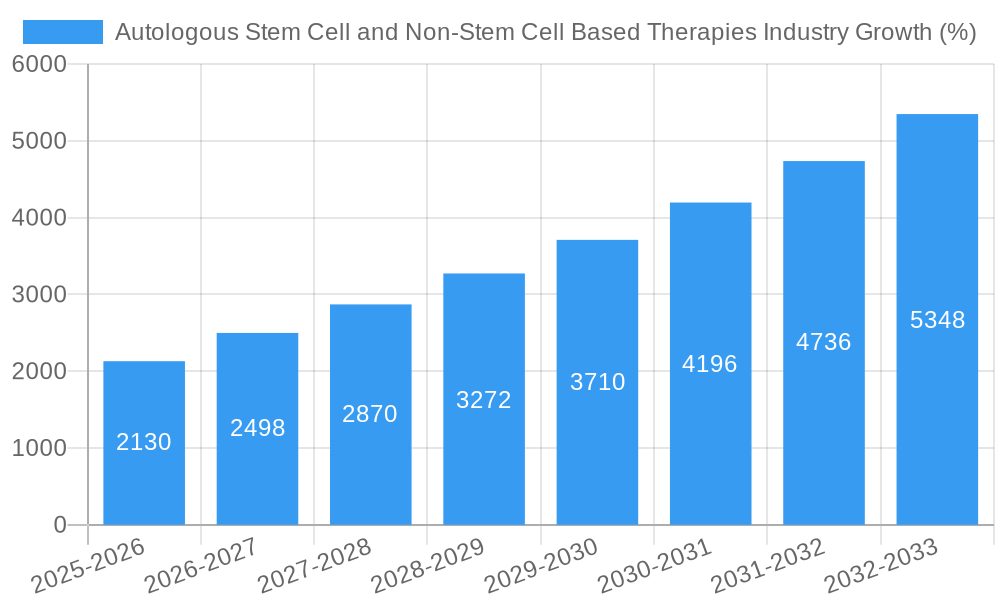
The global autologous stem cell and non-stem cell based therapies market is experiencing robust growth, driven by increasing prevalence of chronic diseases, rising demand for personalized medicine, and continuous technological advancements. Market size has grown from xx million in 2019 to an estimated xx million in 2025, exhibiting a Compound Annual Growth Rate (CAGR) of xx% during the historical period (2019-2024). The forecast period (2025-2033) projects a CAGR of xx%, driven by increased adoption rates and the introduction of novel therapies. Consumer behavior is shifting towards a preference for minimally invasive procedures with shorter recovery times, which is further bolstering market growth. Technological disruptions, such as the development of advanced cell processing techniques and novel delivery systems, are also accelerating market expansion. Market penetration remains relatively low but is projected to increase significantly over the forecast period, reaching xx% by 2033.
Dominant Regions, Countries, or Segments in Autologous Stem Cell and Non-Stem Cell Based Therapies Industry
North America currently holds the largest market share in the autologous stem cell and non-stem cell based therapies market, driven by robust R&D investments, favorable regulatory environment, and high healthcare expenditure. However, the Asia-Pacific region is poised for significant growth, driven by rising healthcare infrastructure, increasing prevalence of chronic diseases, and expanding healthcare expenditure.
- By Application: Cancer therapies dominate the market due to high unmet medical needs and significant funding for research. Neurodegenerative disorders are expected to show substantial growth due to increasing prevalence of conditions such as Alzheimer’s disease and Parkinson’s disease.
- By End-User: Hospitals are the primary end-users due to their advanced facilities and expertise. Ambulatory surgical centers are also gaining popularity due to their cost-effectiveness and convenient accessibility.
- By Type: Autologous stem cells are currently the more dominant type, driven by their potential for personalized medicine. However, autologous non-stem cells are also gaining traction due to their reduced processing complexity and cost-effectiveness.
- Key Drivers: Strong research and development investments, supportive government initiatives, and increasing awareness among patients and healthcare professionals.
Autologous Stem Cell and Non-Stem Cell Based Therapies Industry Product Landscape
The product landscape is characterized by a wide range of therapies at various stages of development, from pre-clinical trials to FDA-approved products. Significant advancements are being made in cell processing, including automation and optimization, to improve efficiency and consistency. New delivery methods are being developed to improve cell engraftment and therapeutic efficacy. Many products are uniquely positioned through the ability to target specific diseases or patient populations, using personalized cell therapies tailored to each individual.
Key Drivers, Barriers & Challenges in Autologous Stem Cell and Non-Stem Cell Based Therapies Industry
Key Drivers:
- Increasing prevalence of chronic diseases requiring innovative treatment options.
- Rising demand for personalized medicine and targeted therapies.
- Significant investments in research and development leading to technological advancements.
- Favorable regulatory policies in some regions, promoting market growth.
Key Challenges & Restraints:
- High cost of therapies impacting accessibility.
- Stringent regulatory pathways and approvals prolonging market entry.
- Complex manufacturing processes and supply chain limitations.
- Limited long-term clinical data impacting market adoption. Approximately xx% of clinical trials have shown inconclusive results.
Emerging Opportunities in Autologous Stem Cell and Non-Stem Cell Based Therapies Industry
- Expansion into emerging markets with unmet medical needs.
- Development of novel therapies targeting rare diseases.
- Leveraging advances in artificial intelligence and machine learning for personalized treatments.
- Exploration of combination therapies integrating stem cell therapies with other treatment modalities.
Growth Accelerators in the Autologous Stem Cell and Non-Stem Cell Based Therapies Industry
Significant technological breakthroughs are expected to significantly accelerate growth, with particular emphasis on advancements in cell processing, targeted delivery systems, and genetic modification of cells. Strategic partnerships and collaborations between industry players are also crucial for expanding market access. Market expansion into developing countries will represent a key growth avenue.
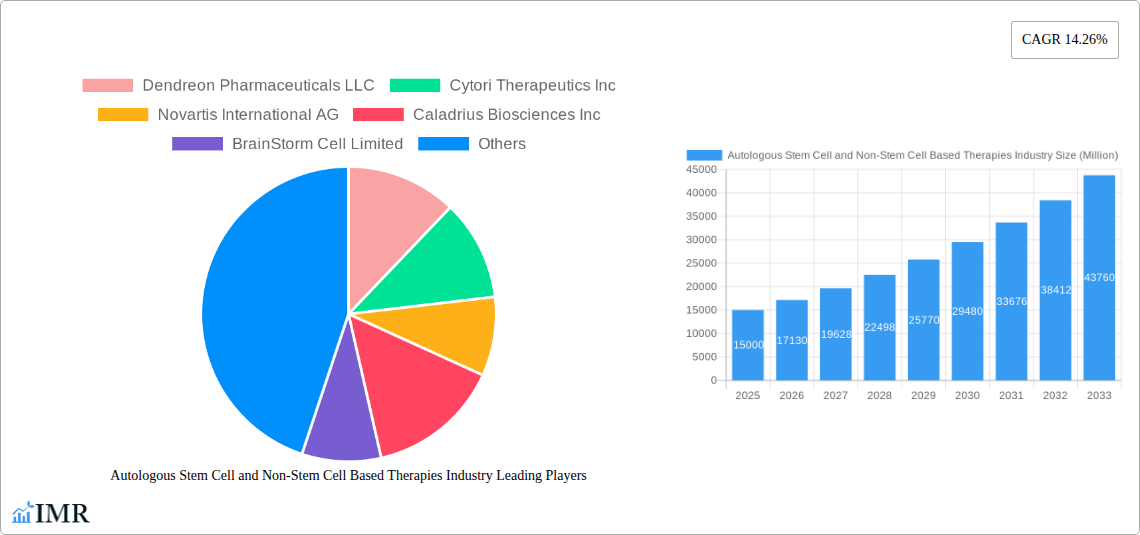
Key Players Shaping the Autologous Stem Cell and Non-Stem Cell Based Therapies Market
- Dendreon Pharmaceuticals LLC
- Cytori Therapeutics Inc
- Novartis International AG
- Caladrius Biosciences Inc
- BrainStorm Cell Limited
- Vericel Corp
- Gilead Sciences Inc
- Castle Creek Biosciences Inc
- US Stem Cell Inc
- Holostem Terapie Avanzate Srl
Notable Milestones in Autologous Stem Cell and Non-Stem Cell Based Therapies Industry Sector
- April 2022: Metcela acquires Japan Regenerative Medicine Co. Ltd, expanding its pipeline and clinical development infrastructure for regenerative medicine products.
- February 2022: US FDA approves CARVYKTI (ciltacabtagene autoleucel; cilta-cel) for relapsed or refractory multiple myeloma treatment.
In-Depth Autologous Stem Cell and Non-Stem Cell Based Therapies Industry Market Outlook
The future of the autologous stem cell and non-stem cell based therapies market is exceptionally promising. Continued technological innovation, strategic partnerships, and expansion into new markets will drive significant growth over the forecast period. The market is poised to witness the introduction of several new therapies, further expanding treatment options and driving market expansion. Strategic investments in R&D and manufacturing capacity will be vital for companies looking to capitalize on the emerging opportunities within this rapidly evolving sector.
Autologous Stem Cell and Non-Stem Cell Based Therapies Industry Segmentation
-
1. Type
- 1.1. Autologous Stem Cells
- 1.2. Autologous Non-Stem cells
-
2. Application
- 2.1. Cancer
- 2.2. Neurodegenerative Disorders
- 2.3. Cardiovascular Disease
- 2.4. Orthopedic Diseases
- 2.5. Other Applications
-
3. End User
- 3.1. Hospitals
- 3.2. Ambulatory Surgical Centers
- 3.3. Research Facilities
Autologous Stem Cell and Non-Stem Cell Based Therapies Industry Segmentation By Geography
-
1. North America
- 1.1. United States
- 1.2. Canada
- 1.3. Mexico
-
2. Europe
- 2.1. Germany
- 2.2. United Kingdom
- 2.3. France
- 2.4. Italy
- 2.5. Spain
- 2.6. Rest of Europe
-
3. Asia Pacific
- 3.1. China
- 3.2. Japan
- 3.3. India
- 3.4. Australia
- 3.5. South Korea
- 3.6. Rest of Asia Pacific
-
4. Middle East and Africa
- 4.1. GCC
- 4.2. South Africa
- 4.3. Rest of Middle East and Africa
-
5. South America
- 5.1. Brazil
- 5.2. Argentina
- 5.3. Rest of South America
Autologous Stem Cell and Non-Stem Cell Based Therapies Industry REPORT HIGHLIGHTS
| Aspects | Details |
|---|---|
| Study Period | 2019-2033 |
| Base Year | 2024 |
| Estimated Year | 2025 |
| Forecast Period | 2025-2033 |
| Historical Period | 2019-2024 |
| Growth Rate | CAGR of 14.26% from 2019-2033 |
| Segmentation |
|
Table of Contents
- 1. Introduction
- 1.1. Research Scope
- 1.2. Market Segmentation
- 1.3. Research Methodology
- 1.4. Definitions and Assumptions
- 2. Executive Summary
- 2.1. Introduction
- 3. Market Dynamics
- 3.1. Introduction
- 3.2. Market Drivers
- 3.2.1. Rising Prevalence of Targeted Diseases; Introduction of Novel Autologous Stem Cell Based Therapies in Regenerative Medicine; Increasing Geriatric Population
- 3.3. Market Restrains
- 3.3.1. High Cost of Autologous Cellular Therapies; Lack of Skilled Professionals
- 3.4. Market Trends
- 3.4.1. Cancer Segment Holds Significant Share in the Autologous Stem Cell and Non-Stem Cell Based Therapies Market
- 4. Market Factor Analysis
- 4.1. Porters Five Forces
- 4.2. Supply/Value Chain
- 4.3. PESTEL analysis
- 4.4. Market Entropy
- 4.5. Patent/Trademark Analysis
- 5. Global Autologous Stem Cell and Non-Stem Cell Based Therapies Industry Analysis, Insights and Forecast, 2019-2031
- 5.1. Market Analysis, Insights and Forecast - by Type
- 5.1.1. Autologous Stem Cells
- 5.1.2. Autologous Non-Stem cells
- 5.2. Market Analysis, Insights and Forecast - by Application
- 5.2.1. Cancer
- 5.2.2. Neurodegenerative Disorders
- 5.2.3. Cardiovascular Disease
- 5.2.4. Orthopedic Diseases
- 5.2.5. Other Applications
- 5.3. Market Analysis, Insights and Forecast - by End User
- 5.3.1. Hospitals
- 5.3.2. Ambulatory Surgical Centers
- 5.3.3. Research Facilities
- 5.4. Market Analysis, Insights and Forecast - by Region
- 5.4.1. North America
- 5.4.2. Europe
- 5.4.3. Asia Pacific
- 5.4.4. Middle East and Africa
- 5.4.5. South America
- 5.1. Market Analysis, Insights and Forecast - by Type
- 6. North America Autologous Stem Cell and Non-Stem Cell Based Therapies Industry Analysis, Insights and Forecast, 2019-2031
- 6.1. Market Analysis, Insights and Forecast - by Type
- 6.1.1. Autologous Stem Cells
- 6.1.2. Autologous Non-Stem cells
- 6.2. Market Analysis, Insights and Forecast - by Application
- 6.2.1. Cancer
- 6.2.2. Neurodegenerative Disorders
- 6.2.3. Cardiovascular Disease
- 6.2.4. Orthopedic Diseases
- 6.2.5. Other Applications
- 6.3. Market Analysis, Insights and Forecast - by End User
- 6.3.1. Hospitals
- 6.3.2. Ambulatory Surgical Centers
- 6.3.3. Research Facilities
- 6.1. Market Analysis, Insights and Forecast - by Type
- 7. Europe Autologous Stem Cell and Non-Stem Cell Based Therapies Industry Analysis, Insights and Forecast, 2019-2031
- 7.1. Market Analysis, Insights and Forecast - by Type
- 7.1.1. Autologous Stem Cells
- 7.1.2. Autologous Non-Stem cells
- 7.2. Market Analysis, Insights and Forecast - by Application
- 7.2.1. Cancer
- 7.2.2. Neurodegenerative Disorders
- 7.2.3. Cardiovascular Disease
- 7.2.4. Orthopedic Diseases
- 7.2.5. Other Applications
- 7.3. Market Analysis, Insights and Forecast - by End User
- 7.3.1. Hospitals
- 7.3.2. Ambulatory Surgical Centers
- 7.3.3. Research Facilities
- 7.1. Market Analysis, Insights and Forecast - by Type
- 8. Asia Pacific Autologous Stem Cell and Non-Stem Cell Based Therapies Industry Analysis, Insights and Forecast, 2019-2031
- 8.1. Market Analysis, Insights and Forecast - by Type
- 8.1.1. Autologous Stem Cells
- 8.1.2. Autologous Non-Stem cells
- 8.2. Market Analysis, Insights and Forecast - by Application
- 8.2.1. Cancer
- 8.2.2. Neurodegenerative Disorders
- 8.2.3. Cardiovascular Disease
- 8.2.4. Orthopedic Diseases
- 8.2.5. Other Applications
- 8.3. Market Analysis, Insights and Forecast - by End User
- 8.3.1. Hospitals
- 8.3.2. Ambulatory Surgical Centers
- 8.3.3. Research Facilities
- 8.1. Market Analysis, Insights and Forecast - by Type
- 9. Middle East and Africa Autologous Stem Cell and Non-Stem Cell Based Therapies Industry Analysis, Insights and Forecast, 2019-2031
- 9.1. Market Analysis, Insights and Forecast - by Type
- 9.1.1. Autologous Stem Cells
- 9.1.2. Autologous Non-Stem cells
- 9.2. Market Analysis, Insights and Forecast - by Application
- 9.2.1. Cancer
- 9.2.2. Neurodegenerative Disorders
- 9.2.3. Cardiovascular Disease
- 9.2.4. Orthopedic Diseases
- 9.2.5. Other Applications
- 9.3. Market Analysis, Insights and Forecast - by End User
- 9.3.1. Hospitals
- 9.3.2. Ambulatory Surgical Centers
- 9.3.3. Research Facilities
- 9.1. Market Analysis, Insights and Forecast - by Type
- 10. South America Autologous Stem Cell and Non-Stem Cell Based Therapies Industry Analysis, Insights and Forecast, 2019-2031
- 10.1. Market Analysis, Insights and Forecast - by Type
- 10.1.1. Autologous Stem Cells
- 10.1.2. Autologous Non-Stem cells
- 10.2. Market Analysis, Insights and Forecast - by Application
- 10.2.1. Cancer
- 10.2.2. Neurodegenerative Disorders
- 10.2.3. Cardiovascular Disease
- 10.2.4. Orthopedic Diseases
- 10.2.5. Other Applications
- 10.3. Market Analysis, Insights and Forecast - by End User
- 10.3.1. Hospitals
- 10.3.2. Ambulatory Surgical Centers
- 10.3.3. Research Facilities
- 10.1. Market Analysis, Insights and Forecast - by Type
- 11. North America Autologous Stem Cell and Non-Stem Cell Based Therapies Industry Analysis, Insights and Forecast, 2019-2031
- 11.1. Market Analysis, Insights and Forecast - By Country/Sub-region
- 11.1.1 United States
- 11.1.2 Canada
- 11.1.3 Mexico
- 12. Europe Autologous Stem Cell and Non-Stem Cell Based Therapies Industry Analysis, Insights and Forecast, 2019-2031
- 12.1. Market Analysis, Insights and Forecast - By Country/Sub-region
- 12.1.1 Germany
- 12.1.2 United Kingdom
- 12.1.3 France
- 12.1.4 Italy
- 12.1.5 Spain
- 12.1.6 Rest of Europe
- 13. Asia Pacific Autologous Stem Cell and Non-Stem Cell Based Therapies Industry Analysis, Insights and Forecast, 2019-2031
- 13.1. Market Analysis, Insights and Forecast - By Country/Sub-region
- 13.1.1 China
- 13.1.2 Japan
- 13.1.3 India
- 13.1.4 Australia
- 13.1.5 South Korea
- 13.1.6 Rest of Asia Pacific
- 14. Middle East and Africa Autologous Stem Cell and Non-Stem Cell Based Therapies Industry Analysis, Insights and Forecast, 2019-2031
- 14.1. Market Analysis, Insights and Forecast - By Country/Sub-region
- 14.1.1 GCC
- 14.1.2 South Africa
- 14.1.3 Rest of Middle East and Africa
- 15. South America Autologous Stem Cell and Non-Stem Cell Based Therapies Industry Analysis, Insights and Forecast, 2019-2031
- 15.1. Market Analysis, Insights and Forecast - By Country/Sub-region
- 15.1.1 Brazil
- 15.1.2 Argentina
- 15.1.3 Rest of South America
- 16. Competitive Analysis
- 16.1. Global Market Share Analysis 2024
- 16.2. Company Profiles
- 16.2.1 Dendreon Pharmaceuticals LLC
- 16.2.1.1. Overview
- 16.2.1.2. Products
- 16.2.1.3. SWOT Analysis
- 16.2.1.4. Recent Developments
- 16.2.1.5. Financials (Based on Availability)
- 16.2.2 Cytori Therapeutics Inc
- 16.2.2.1. Overview
- 16.2.2.2. Products
- 16.2.2.3. SWOT Analysis
- 16.2.2.4. Recent Developments
- 16.2.2.5. Financials (Based on Availability)
- 16.2.3 Novartis International AG
- 16.2.3.1. Overview
- 16.2.3.2. Products
- 16.2.3.3. SWOT Analysis
- 16.2.3.4. Recent Developments
- 16.2.3.5. Financials (Based on Availability)
- 16.2.4 Caladrius Biosciences Inc
- 16.2.4.1. Overview
- 16.2.4.2. Products
- 16.2.4.3. SWOT Analysis
- 16.2.4.4. Recent Developments
- 16.2.4.5. Financials (Based on Availability)
- 16.2.5 BrainStorm Cell Limited
- 16.2.5.1. Overview
- 16.2.5.2. Products
- 16.2.5.3. SWOT Analysis
- 16.2.5.4. Recent Developments
- 16.2.5.5. Financials (Based on Availability)
- 16.2.6 Vericel Corp
- 16.2.6.1. Overview
- 16.2.6.2. Products
- 16.2.6.3. SWOT Analysis
- 16.2.6.4. Recent Developments
- 16.2.6.5. Financials (Based on Availability)
- 16.2.7 Gilead Sciences Inc
- 16.2.7.1. Overview
- 16.2.7.2. Products
- 16.2.7.3. SWOT Analysis
- 16.2.7.4. Recent Developments
- 16.2.7.5. Financials (Based on Availability)
- 16.2.8 Castle Creek Biosciences Inc
- 16.2.8.1. Overview
- 16.2.8.2. Products
- 16.2.8.3. SWOT Analysis
- 16.2.8.4. Recent Developments
- 16.2.8.5. Financials (Based on Availability)
- 16.2.9 US Stem Cell Inc
- 16.2.9.1. Overview
- 16.2.9.2. Products
- 16.2.9.3. SWOT Analysis
- 16.2.9.4. Recent Developments
- 16.2.9.5. Financials (Based on Availability)
- 16.2.10 Holostem Terapie Avanzate Srl
- 16.2.10.1. Overview
- 16.2.10.2. Products
- 16.2.10.3. SWOT Analysis
- 16.2.10.4. Recent Developments
- 16.2.10.5. Financials (Based on Availability)
- 16.2.1 Dendreon Pharmaceuticals LLC
List of Figures
- Figure 1: Global Autologous Stem Cell and Non-Stem Cell Based Therapies Industry Revenue Breakdown (Million, %) by Region 2024 & 2032
- Figure 2: Global Autologous Stem Cell and Non-Stem Cell Based Therapies Industry Volume Breakdown (K Unit, %) by Region 2024 & 2032
- Figure 3: North America Autologous Stem Cell and Non-Stem Cell Based Therapies Industry Revenue (Million), by Country 2024 & 2032
- Figure 4: North America Autologous Stem Cell and Non-Stem Cell Based Therapies Industry Volume (K Unit), by Country 2024 & 2032
- Figure 5: North America Autologous Stem Cell and Non-Stem Cell Based Therapies Industry Revenue Share (%), by Country 2024 & 2032
- Figure 6: North America Autologous Stem Cell and Non-Stem Cell Based Therapies Industry Volume Share (%), by Country 2024 & 2032
- Figure 7: Europe Autologous Stem Cell and Non-Stem Cell Based Therapies Industry Revenue (Million), by Country 2024 & 2032
- Figure 8: Europe Autologous Stem Cell and Non-Stem Cell Based Therapies Industry Volume (K Unit), by Country 2024 & 2032
- Figure 9: Europe Autologous Stem Cell and Non-Stem Cell Based Therapies Industry Revenue Share (%), by Country 2024 & 2032
- Figure 10: Europe Autologous Stem Cell and Non-Stem Cell Based Therapies Industry Volume Share (%), by Country 2024 & 2032
- Figure 11: Asia Pacific Autologous Stem Cell and Non-Stem Cell Based Therapies Industry Revenue (Million), by Country 2024 & 2032
- Figure 12: Asia Pacific Autologous Stem Cell and Non-Stem Cell Based Therapies Industry Volume (K Unit), by Country 2024 & 2032
- Figure 13: Asia Pacific Autologous Stem Cell and Non-Stem Cell Based Therapies Industry Revenue Share (%), by Country 2024 & 2032
- Figure 14: Asia Pacific Autologous Stem Cell and Non-Stem Cell Based Therapies Industry Volume Share (%), by Country 2024 & 2032
- Figure 15: Middle East and Africa Autologous Stem Cell and Non-Stem Cell Based Therapies Industry Revenue (Million), by Country 2024 & 2032
- Figure 16: Middle East and Africa Autologous Stem Cell and Non-Stem Cell Based Therapies Industry Volume (K Unit), by Country 2024 & 2032
- Figure 17: Middle East and Africa Autologous Stem Cell and Non-Stem Cell Based Therapies Industry Revenue Share (%), by Country 2024 & 2032
- Figure 18: Middle East and Africa Autologous Stem Cell and Non-Stem Cell Based Therapies Industry Volume Share (%), by Country 2024 & 2032
- Figure 19: South America Autologous Stem Cell and Non-Stem Cell Based Therapies Industry Revenue (Million), by Country 2024 & 2032
- Figure 20: South America Autologous Stem Cell and Non-Stem Cell Based Therapies Industry Volume (K Unit), by Country 2024 & 2032
- Figure 21: South America Autologous Stem Cell and Non-Stem Cell Based Therapies Industry Revenue Share (%), by Country 2024 & 2032
- Figure 22: South America Autologous Stem Cell and Non-Stem Cell Based Therapies Industry Volume Share (%), by Country 2024 & 2032
- Figure 23: North America Autologous Stem Cell and Non-Stem Cell Based Therapies Industry Revenue (Million), by Type 2024 & 2032
- Figure 24: North America Autologous Stem Cell and Non-Stem Cell Based Therapies Industry Volume (K Unit), by Type 2024 & 2032
- Figure 25: North America Autologous Stem Cell and Non-Stem Cell Based Therapies Industry Revenue Share (%), by Type 2024 & 2032
- Figure 26: North America Autologous Stem Cell and Non-Stem Cell Based Therapies Industry Volume Share (%), by Type 2024 & 2032
- Figure 27: North America Autologous Stem Cell and Non-Stem Cell Based Therapies Industry Revenue (Million), by Application 2024 & 2032
- Figure 28: North America Autologous Stem Cell and Non-Stem Cell Based Therapies Industry Volume (K Unit), by Application 2024 & 2032
- Figure 29: North America Autologous Stem Cell and Non-Stem Cell Based Therapies Industry Revenue Share (%), by Application 2024 & 2032
- Figure 30: North America Autologous Stem Cell and Non-Stem Cell Based Therapies Industry Volume Share (%), by Application 2024 & 2032
- Figure 31: North America Autologous Stem Cell and Non-Stem Cell Based Therapies Industry Revenue (Million), by End User 2024 & 2032
- Figure 32: North America Autologous Stem Cell and Non-Stem Cell Based Therapies Industry Volume (K Unit), by End User 2024 & 2032
- Figure 33: North America Autologous Stem Cell and Non-Stem Cell Based Therapies Industry Revenue Share (%), by End User 2024 & 2032
- Figure 34: North America Autologous Stem Cell and Non-Stem Cell Based Therapies Industry Volume Share (%), by End User 2024 & 2032
- Figure 35: North America Autologous Stem Cell and Non-Stem Cell Based Therapies Industry Revenue (Million), by Country 2024 & 2032
- Figure 36: North America Autologous Stem Cell and Non-Stem Cell Based Therapies Industry Volume (K Unit), by Country 2024 & 2032
- Figure 37: North America Autologous Stem Cell and Non-Stem Cell Based Therapies Industry Revenue Share (%), by Country 2024 & 2032
- Figure 38: North America Autologous Stem Cell and Non-Stem Cell Based Therapies Industry Volume Share (%), by Country 2024 & 2032
- Figure 39: Europe Autologous Stem Cell and Non-Stem Cell Based Therapies Industry Revenue (Million), by Type 2024 & 2032
- Figure 40: Europe Autologous Stem Cell and Non-Stem Cell Based Therapies Industry Volume (K Unit), by Type 2024 & 2032
- Figure 41: Europe Autologous Stem Cell and Non-Stem Cell Based Therapies Industry Revenue Share (%), by Type 2024 & 2032
- Figure 42: Europe Autologous Stem Cell and Non-Stem Cell Based Therapies Industry Volume Share (%), by Type 2024 & 2032
- Figure 43: Europe Autologous Stem Cell and Non-Stem Cell Based Therapies Industry Revenue (Million), by Application 2024 & 2032
- Figure 44: Europe Autologous Stem Cell and Non-Stem Cell Based Therapies Industry Volume (K Unit), by Application 2024 & 2032
- Figure 45: Europe Autologous Stem Cell and Non-Stem Cell Based Therapies Industry Revenue Share (%), by Application 2024 & 2032
- Figure 46: Europe Autologous Stem Cell and Non-Stem Cell Based Therapies Industry Volume Share (%), by Application 2024 & 2032
- Figure 47: Europe Autologous Stem Cell and Non-Stem Cell Based Therapies Industry Revenue (Million), by End User 2024 & 2032
- Figure 48: Europe Autologous Stem Cell and Non-Stem Cell Based Therapies Industry Volume (K Unit), by End User 2024 & 2032
- Figure 49: Europe Autologous Stem Cell and Non-Stem Cell Based Therapies Industry Revenue Share (%), by End User 2024 & 2032
- Figure 50: Europe Autologous Stem Cell and Non-Stem Cell Based Therapies Industry Volume Share (%), by End User 2024 & 2032
- Figure 51: Europe Autologous Stem Cell and Non-Stem Cell Based Therapies Industry Revenue (Million), by Country 2024 & 2032
- Figure 52: Europe Autologous Stem Cell and Non-Stem Cell Based Therapies Industry Volume (K Unit), by Country 2024 & 2032
- Figure 53: Europe Autologous Stem Cell and Non-Stem Cell Based Therapies Industry Revenue Share (%), by Country 2024 & 2032
- Figure 54: Europe Autologous Stem Cell and Non-Stem Cell Based Therapies Industry Volume Share (%), by Country 2024 & 2032
- Figure 55: Asia Pacific Autologous Stem Cell and Non-Stem Cell Based Therapies Industry Revenue (Million), by Type 2024 & 2032
- Figure 56: Asia Pacific Autologous Stem Cell and Non-Stem Cell Based Therapies Industry Volume (K Unit), by Type 2024 & 2032
- Figure 57: Asia Pacific Autologous Stem Cell and Non-Stem Cell Based Therapies Industry Revenue Share (%), by Type 2024 & 2032
- Figure 58: Asia Pacific Autologous Stem Cell and Non-Stem Cell Based Therapies Industry Volume Share (%), by Type 2024 & 2032
- Figure 59: Asia Pacific Autologous Stem Cell and Non-Stem Cell Based Therapies Industry Revenue (Million), by Application 2024 & 2032
- Figure 60: Asia Pacific Autologous Stem Cell and Non-Stem Cell Based Therapies Industry Volume (K Unit), by Application 2024 & 2032
- Figure 61: Asia Pacific Autologous Stem Cell and Non-Stem Cell Based Therapies Industry Revenue Share (%), by Application 2024 & 2032
- Figure 62: Asia Pacific Autologous Stem Cell and Non-Stem Cell Based Therapies Industry Volume Share (%), by Application 2024 & 2032
- Figure 63: Asia Pacific Autologous Stem Cell and Non-Stem Cell Based Therapies Industry Revenue (Million), by End User 2024 & 2032
- Figure 64: Asia Pacific Autologous Stem Cell and Non-Stem Cell Based Therapies Industry Volume (K Unit), by End User 2024 & 2032
- Figure 65: Asia Pacific Autologous Stem Cell and Non-Stem Cell Based Therapies Industry Revenue Share (%), by End User 2024 & 2032
- Figure 66: Asia Pacific Autologous Stem Cell and Non-Stem Cell Based Therapies Industry Volume Share (%), by End User 2024 & 2032
- Figure 67: Asia Pacific Autologous Stem Cell and Non-Stem Cell Based Therapies Industry Revenue (Million), by Country 2024 & 2032
- Figure 68: Asia Pacific Autologous Stem Cell and Non-Stem Cell Based Therapies Industry Volume (K Unit), by Country 2024 & 2032
- Figure 69: Asia Pacific Autologous Stem Cell and Non-Stem Cell Based Therapies Industry Revenue Share (%), by Country 2024 & 2032
- Figure 70: Asia Pacific Autologous Stem Cell and Non-Stem Cell Based Therapies Industry Volume Share (%), by Country 2024 & 2032
- Figure 71: Middle East and Africa Autologous Stem Cell and Non-Stem Cell Based Therapies Industry Revenue (Million), by Type 2024 & 2032
- Figure 72: Middle East and Africa Autologous Stem Cell and Non-Stem Cell Based Therapies Industry Volume (K Unit), by Type 2024 & 2032
- Figure 73: Middle East and Africa Autologous Stem Cell and Non-Stem Cell Based Therapies Industry Revenue Share (%), by Type 2024 & 2032
- Figure 74: Middle East and Africa Autologous Stem Cell and Non-Stem Cell Based Therapies Industry Volume Share (%), by Type 2024 & 2032
- Figure 75: Middle East and Africa Autologous Stem Cell and Non-Stem Cell Based Therapies Industry Revenue (Million), by Application 2024 & 2032
- Figure 76: Middle East and Africa Autologous Stem Cell and Non-Stem Cell Based Therapies Industry Volume (K Unit), by Application 2024 & 2032
- Figure 77: Middle East and Africa Autologous Stem Cell and Non-Stem Cell Based Therapies Industry Revenue Share (%), by Application 2024 & 2032
- Figure 78: Middle East and Africa Autologous Stem Cell and Non-Stem Cell Based Therapies Industry Volume Share (%), by Application 2024 & 2032
- Figure 79: Middle East and Africa Autologous Stem Cell and Non-Stem Cell Based Therapies Industry Revenue (Million), by End User 2024 & 2032
- Figure 80: Middle East and Africa Autologous Stem Cell and Non-Stem Cell Based Therapies Industry Volume (K Unit), by End User 2024 & 2032
- Figure 81: Middle East and Africa Autologous Stem Cell and Non-Stem Cell Based Therapies Industry Revenue Share (%), by End User 2024 & 2032
- Figure 82: Middle East and Africa Autologous Stem Cell and Non-Stem Cell Based Therapies Industry Volume Share (%), by End User 2024 & 2032
- Figure 83: Middle East and Africa Autologous Stem Cell and Non-Stem Cell Based Therapies Industry Revenue (Million), by Country 2024 & 2032
- Figure 84: Middle East and Africa Autologous Stem Cell and Non-Stem Cell Based Therapies Industry Volume (K Unit), by Country 2024 & 2032
- Figure 85: Middle East and Africa Autologous Stem Cell and Non-Stem Cell Based Therapies Industry Revenue Share (%), by Country 2024 & 2032
- Figure 86: Middle East and Africa Autologous Stem Cell and Non-Stem Cell Based Therapies Industry Volume Share (%), by Country 2024 & 2032
- Figure 87: South America Autologous Stem Cell and Non-Stem Cell Based Therapies Industry Revenue (Million), by Type 2024 & 2032
- Figure 88: South America Autologous Stem Cell and Non-Stem Cell Based Therapies Industry Volume (K Unit), by Type 2024 & 2032
- Figure 89: South America Autologous Stem Cell and Non-Stem Cell Based Therapies Industry Revenue Share (%), by Type 2024 & 2032
- Figure 90: South America Autologous Stem Cell and Non-Stem Cell Based Therapies Industry Volume Share (%), by Type 2024 & 2032
- Figure 91: South America Autologous Stem Cell and Non-Stem Cell Based Therapies Industry Revenue (Million), by Application 2024 & 2032
- Figure 92: South America Autologous Stem Cell and Non-Stem Cell Based Therapies Industry Volume (K Unit), by Application 2024 & 2032
- Figure 93: South America Autologous Stem Cell and Non-Stem Cell Based Therapies Industry Revenue Share (%), by Application 2024 & 2032
- Figure 94: South America Autologous Stem Cell and Non-Stem Cell Based Therapies Industry Volume Share (%), by Application 2024 & 2032
- Figure 95: South America Autologous Stem Cell and Non-Stem Cell Based Therapies Industry Revenue (Million), by End User 2024 & 2032
- Figure 96: South America Autologous Stem Cell and Non-Stem Cell Based Therapies Industry Volume (K Unit), by End User 2024 & 2032
- Figure 97: South America Autologous Stem Cell and Non-Stem Cell Based Therapies Industry Revenue Share (%), by End User 2024 & 2032
- Figure 98: South America Autologous Stem Cell and Non-Stem Cell Based Therapies Industry Volume Share (%), by End User 2024 & 2032
- Figure 99: South America Autologous Stem Cell and Non-Stem Cell Based Therapies Industry Revenue (Million), by Country 2024 & 2032
- Figure 100: South America Autologous Stem Cell and Non-Stem Cell Based Therapies Industry Volume (K Unit), by Country 2024 & 2032
- Figure 101: South America Autologous Stem Cell and Non-Stem Cell Based Therapies Industry Revenue Share (%), by Country 2024 & 2032
- Figure 102: South America Autologous Stem Cell and Non-Stem Cell Based Therapies Industry Volume Share (%), by Country 2024 & 2032
List of Tables
- Table 1: Global Autologous Stem Cell and Non-Stem Cell Based Therapies Industry Revenue Million Forecast, by Region 2019 & 2032
- Table 2: Global Autologous Stem Cell and Non-Stem Cell Based Therapies Industry Volume K Unit Forecast, by Region 2019 & 2032
- Table 3: Global Autologous Stem Cell and Non-Stem Cell Based Therapies Industry Revenue Million Forecast, by Type 2019 & 2032
- Table 4: Global Autologous Stem Cell and Non-Stem Cell Based Therapies Industry Volume K Unit Forecast, by Type 2019 & 2032
- Table 5: Global Autologous Stem Cell and Non-Stem Cell Based Therapies Industry Revenue Million Forecast, by Application 2019 & 2032
- Table 6: Global Autologous Stem Cell and Non-Stem Cell Based Therapies Industry Volume K Unit Forecast, by Application 2019 & 2032
- Table 7: Global Autologous Stem Cell and Non-Stem Cell Based Therapies Industry Revenue Million Forecast, by End User 2019 & 2032
- Table 8: Global Autologous Stem Cell and Non-Stem Cell Based Therapies Industry Volume K Unit Forecast, by End User 2019 & 2032
- Table 9: Global Autologous Stem Cell and Non-Stem Cell Based Therapies Industry Revenue Million Forecast, by Region 2019 & 2032
- Table 10: Global Autologous Stem Cell and Non-Stem Cell Based Therapies Industry Volume K Unit Forecast, by Region 2019 & 2032
- Table 11: Global Autologous Stem Cell and Non-Stem Cell Based Therapies Industry Revenue Million Forecast, by Country 2019 & 2032
- Table 12: Global Autologous Stem Cell and Non-Stem Cell Based Therapies Industry Volume K Unit Forecast, by Country 2019 & 2032
- Table 13: United States Autologous Stem Cell and Non-Stem Cell Based Therapies Industry Revenue (Million) Forecast, by Application 2019 & 2032
- Table 14: United States Autologous Stem Cell and Non-Stem Cell Based Therapies Industry Volume (K Unit) Forecast, by Application 2019 & 2032
- Table 15: Canada Autologous Stem Cell and Non-Stem Cell Based Therapies Industry Revenue (Million) Forecast, by Application 2019 & 2032
- Table 16: Canada Autologous Stem Cell and Non-Stem Cell Based Therapies Industry Volume (K Unit) Forecast, by Application 2019 & 2032
- Table 17: Mexico Autologous Stem Cell and Non-Stem Cell Based Therapies Industry Revenue (Million) Forecast, by Application 2019 & 2032
- Table 18: Mexico Autologous Stem Cell and Non-Stem Cell Based Therapies Industry Volume (K Unit) Forecast, by Application 2019 & 2032
- Table 19: Global Autologous Stem Cell and Non-Stem Cell Based Therapies Industry Revenue Million Forecast, by Country 2019 & 2032
- Table 20: Global Autologous Stem Cell and Non-Stem Cell Based Therapies Industry Volume K Unit Forecast, by Country 2019 & 2032
- Table 21: Germany Autologous Stem Cell and Non-Stem Cell Based Therapies Industry Revenue (Million) Forecast, by Application 2019 & 2032
- Table 22: Germany Autologous Stem Cell and Non-Stem Cell Based Therapies Industry Volume (K Unit) Forecast, by Application 2019 & 2032
- Table 23: United Kingdom Autologous Stem Cell and Non-Stem Cell Based Therapies Industry Revenue (Million) Forecast, by Application 2019 & 2032
- Table 24: United Kingdom Autologous Stem Cell and Non-Stem Cell Based Therapies Industry Volume (K Unit) Forecast, by Application 2019 & 2032
- Table 25: France Autologous Stem Cell and Non-Stem Cell Based Therapies Industry Revenue (Million) Forecast, by Application 2019 & 2032
- Table 26: France Autologous Stem Cell and Non-Stem Cell Based Therapies Industry Volume (K Unit) Forecast, by Application 2019 & 2032
- Table 27: Italy Autologous Stem Cell and Non-Stem Cell Based Therapies Industry Revenue (Million) Forecast, by Application 2019 & 2032
- Table 28: Italy Autologous Stem Cell and Non-Stem Cell Based Therapies Industry Volume (K Unit) Forecast, by Application 2019 & 2032
- Table 29: Spain Autologous Stem Cell and Non-Stem Cell Based Therapies Industry Revenue (Million) Forecast, by Application 2019 & 2032
- Table 30: Spain Autologous Stem Cell and Non-Stem Cell Based Therapies Industry Volume (K Unit) Forecast, by Application 2019 & 2032
- Table 31: Rest of Europe Autologous Stem Cell and Non-Stem Cell Based Therapies Industry Revenue (Million) Forecast, by Application 2019 & 2032
- Table 32: Rest of Europe Autologous Stem Cell and Non-Stem Cell Based Therapies Industry Volume (K Unit) Forecast, by Application 2019 & 2032
- Table 33: Global Autologous Stem Cell and Non-Stem Cell Based Therapies Industry Revenue Million Forecast, by Country 2019 & 2032
- Table 34: Global Autologous Stem Cell and Non-Stem Cell Based Therapies Industry Volume K Unit Forecast, by Country 2019 & 2032
- Table 35: China Autologous Stem Cell and Non-Stem Cell Based Therapies Industry Revenue (Million) Forecast, by Application 2019 & 2032
- Table 36: China Autologous Stem Cell and Non-Stem Cell Based Therapies Industry Volume (K Unit) Forecast, by Application 2019 & 2032
- Table 37: Japan Autologous Stem Cell and Non-Stem Cell Based Therapies Industry Revenue (Million) Forecast, by Application 2019 & 2032
- Table 38: Japan Autologous Stem Cell and Non-Stem Cell Based Therapies Industry Volume (K Unit) Forecast, by Application 2019 & 2032
- Table 39: India Autologous Stem Cell and Non-Stem Cell Based Therapies Industry Revenue (Million) Forecast, by Application 2019 & 2032
- Table 40: India Autologous Stem Cell and Non-Stem Cell Based Therapies Industry Volume (K Unit) Forecast, by Application 2019 & 2032
- Table 41: Australia Autologous Stem Cell and Non-Stem Cell Based Therapies Industry Revenue (Million) Forecast, by Application 2019 & 2032
- Table 42: Australia Autologous Stem Cell and Non-Stem Cell Based Therapies Industry Volume (K Unit) Forecast, by Application 2019 & 2032
- Table 43: South Korea Autologous Stem Cell and Non-Stem Cell Based Therapies Industry Revenue (Million) Forecast, by Application 2019 & 2032
- Table 44: South Korea Autologous Stem Cell and Non-Stem Cell Based Therapies Industry Volume (K Unit) Forecast, by Application 2019 & 2032
- Table 45: Rest of Asia Pacific Autologous Stem Cell and Non-Stem Cell Based Therapies Industry Revenue (Million) Forecast, by Application 2019 & 2032
- Table 46: Rest of Asia Pacific Autologous Stem Cell and Non-Stem Cell Based Therapies Industry Volume (K Unit) Forecast, by Application 2019 & 2032
- Table 47: Global Autologous Stem Cell and Non-Stem Cell Based Therapies Industry Revenue Million Forecast, by Country 2019 & 2032
- Table 48: Global Autologous Stem Cell and Non-Stem Cell Based Therapies Industry Volume K Unit Forecast, by Country 2019 & 2032
- Table 49: GCC Autologous Stem Cell and Non-Stem Cell Based Therapies Industry Revenue (Million) Forecast, by Application 2019 & 2032
- Table 50: GCC Autologous Stem Cell and Non-Stem Cell Based Therapies Industry Volume (K Unit) Forecast, by Application 2019 & 2032
- Table 51: South Africa Autologous Stem Cell and Non-Stem Cell Based Therapies Industry Revenue (Million) Forecast, by Application 2019 & 2032
- Table 52: South Africa Autologous Stem Cell and Non-Stem Cell Based Therapies Industry Volume (K Unit) Forecast, by Application 2019 & 2032
- Table 53: Rest of Middle East and Africa Autologous Stem Cell and Non-Stem Cell Based Therapies Industry Revenue (Million) Forecast, by Application 2019 & 2032
- Table 54: Rest of Middle East and Africa Autologous Stem Cell and Non-Stem Cell Based Therapies Industry Volume (K Unit) Forecast, by Application 2019 & 2032
- Table 55: Global Autologous Stem Cell and Non-Stem Cell Based Therapies Industry Revenue Million Forecast, by Country 2019 & 2032
- Table 56: Global Autologous Stem Cell and Non-Stem Cell Based Therapies Industry Volume K Unit Forecast, by Country 2019 & 2032
- Table 57: Brazil Autologous Stem Cell and Non-Stem Cell Based Therapies Industry Revenue (Million) Forecast, by Application 2019 & 2032
- Table 58: Brazil Autologous Stem Cell and Non-Stem Cell Based Therapies Industry Volume (K Unit) Forecast, by Application 2019 & 2032
- Table 59: Argentina Autologous Stem Cell and Non-Stem Cell Based Therapies Industry Revenue (Million) Forecast, by Application 2019 & 2032
- Table 60: Argentina Autologous Stem Cell and Non-Stem Cell Based Therapies Industry Volume (K Unit) Forecast, by Application 2019 & 2032
- Table 61: Rest of South America Autologous Stem Cell and Non-Stem Cell Based Therapies Industry Revenue (Million) Forecast, by Application 2019 & 2032
- Table 62: Rest of South America Autologous Stem Cell and Non-Stem Cell Based Therapies Industry Volume (K Unit) Forecast, by Application 2019 & 2032
- Table 63: Global Autologous Stem Cell and Non-Stem Cell Based Therapies Industry Revenue Million Forecast, by Type 2019 & 2032
- Table 64: Global Autologous Stem Cell and Non-Stem Cell Based Therapies Industry Volume K Unit Forecast, by Type 2019 & 2032
- Table 65: Global Autologous Stem Cell and Non-Stem Cell Based Therapies Industry Revenue Million Forecast, by Application 2019 & 2032
- Table 66: Global Autologous Stem Cell and Non-Stem Cell Based Therapies Industry Volume K Unit Forecast, by Application 2019 & 2032
- Table 67: Global Autologous Stem Cell and Non-Stem Cell Based Therapies Industry Revenue Million Forecast, by End User 2019 & 2032
- Table 68: Global Autologous Stem Cell and Non-Stem Cell Based Therapies Industry Volume K Unit Forecast, by End User 2019 & 2032
- Table 69: Global Autologous Stem Cell and Non-Stem Cell Based Therapies Industry Revenue Million Forecast, by Country 2019 & 2032
- Table 70: Global Autologous Stem Cell and Non-Stem Cell Based Therapies Industry Volume K Unit Forecast, by Country 2019 & 2032
- Table 71: United States Autologous Stem Cell and Non-Stem Cell Based Therapies Industry Revenue (Million) Forecast, by Application 2019 & 2032
- Table 72: United States Autologous Stem Cell and Non-Stem Cell Based Therapies Industry Volume (K Unit) Forecast, by Application 2019 & 2032
- Table 73: Canada Autologous Stem Cell and Non-Stem Cell Based Therapies Industry Revenue (Million) Forecast, by Application 2019 & 2032
- Table 74: Canada Autologous Stem Cell and Non-Stem Cell Based Therapies Industry Volume (K Unit) Forecast, by Application 2019 & 2032
- Table 75: Mexico Autologous Stem Cell and Non-Stem Cell Based Therapies Industry Revenue (Million) Forecast, by Application 2019 & 2032
- Table 76: Mexico Autologous Stem Cell and Non-Stem Cell Based Therapies Industry Volume (K Unit) Forecast, by Application 2019 & 2032
- Table 77: Global Autologous Stem Cell and Non-Stem Cell Based Therapies Industry Revenue Million Forecast, by Type 2019 & 2032
- Table 78: Global Autologous Stem Cell and Non-Stem Cell Based Therapies Industry Volume K Unit Forecast, by Type 2019 & 2032
- Table 79: Global Autologous Stem Cell and Non-Stem Cell Based Therapies Industry Revenue Million Forecast, by Application 2019 & 2032
- Table 80: Global Autologous Stem Cell and Non-Stem Cell Based Therapies Industry Volume K Unit Forecast, by Application 2019 & 2032
- Table 81: Global Autologous Stem Cell and Non-Stem Cell Based Therapies Industry Revenue Million Forecast, by End User 2019 & 2032
- Table 82: Global Autologous Stem Cell and Non-Stem Cell Based Therapies Industry Volume K Unit Forecast, by End User 2019 & 2032
- Table 83: Global Autologous Stem Cell and Non-Stem Cell Based Therapies Industry Revenue Million Forecast, by Country 2019 & 2032
- Table 84: Global Autologous Stem Cell and Non-Stem Cell Based Therapies Industry Volume K Unit Forecast, by Country 2019 & 2032
- Table 85: Germany Autologous Stem Cell and Non-Stem Cell Based Therapies Industry Revenue (Million) Forecast, by Application 2019 & 2032
- Table 86: Germany Autologous Stem Cell and Non-Stem Cell Based Therapies Industry Volume (K Unit) Forecast, by Application 2019 & 2032
- Table 87: United Kingdom Autologous Stem Cell and Non-Stem Cell Based Therapies Industry Revenue (Million) Forecast, by Application 2019 & 2032
- Table 88: United Kingdom Autologous Stem Cell and Non-Stem Cell Based Therapies Industry Volume (K Unit) Forecast, by Application 2019 & 2032
- Table 89: France Autologous Stem Cell and Non-Stem Cell Based Therapies Industry Revenue (Million) Forecast, by Application 2019 & 2032
- Table 90: France Autologous Stem Cell and Non-Stem Cell Based Therapies Industry Volume (K Unit) Forecast, by Application 2019 & 2032
- Table 91: Italy Autologous Stem Cell and Non-Stem Cell Based Therapies Industry Revenue (Million) Forecast, by Application 2019 & 2032
- Table 92: Italy Autologous Stem Cell and Non-Stem Cell Based Therapies Industry Volume (K Unit) Forecast, by Application 2019 & 2032
- Table 93: Spain Autologous Stem Cell and Non-Stem Cell Based Therapies Industry Revenue (Million) Forecast, by Application 2019 & 2032
- Table 94: Spain Autologous Stem Cell and Non-Stem Cell Based Therapies Industry Volume (K Unit) Forecast, by Application 2019 & 2032
- Table 95: Rest of Europe Autologous Stem Cell and Non-Stem Cell Based Therapies Industry Revenue (Million) Forecast, by Application 2019 & 2032
- Table 96: Rest of Europe Autologous Stem Cell and Non-Stem Cell Based Therapies Industry Volume (K Unit) Forecast, by Application 2019 & 2032
- Table 97: Global Autologous Stem Cell and Non-Stem Cell Based Therapies Industry Revenue Million Forecast, by Type 2019 & 2032
- Table 98: Global Autologous Stem Cell and Non-Stem Cell Based Therapies Industry Volume K Unit Forecast, by Type 2019 & 2032
- Table 99: Global Autologous Stem Cell and Non-Stem Cell Based Therapies Industry Revenue Million Forecast, by Application 2019 & 2032
- Table 100: Global Autologous Stem Cell and Non-Stem Cell Based Therapies Industry Volume K Unit Forecast, by Application 2019 & 2032
- Table 101: Global Autologous Stem Cell and Non-Stem Cell Based Therapies Industry Revenue Million Forecast, by End User 2019 & 2032
- Table 102: Global Autologous Stem Cell and Non-Stem Cell Based Therapies Industry Volume K Unit Forecast, by End User 2019 & 2032
- Table 103: Global Autologous Stem Cell and Non-Stem Cell Based Therapies Industry Revenue Million Forecast, by Country 2019 & 2032
- Table 104: Global Autologous Stem Cell and Non-Stem Cell Based Therapies Industry Volume K Unit Forecast, by Country 2019 & 2032
- Table 105: China Autologous Stem Cell and Non-Stem Cell Based Therapies Industry Revenue (Million) Forecast, by Application 2019 & 2032
- Table 106: China Autologous Stem Cell and Non-Stem Cell Based Therapies Industry Volume (K Unit) Forecast, by Application 2019 & 2032
- Table 107: Japan Autologous Stem Cell and Non-Stem Cell Based Therapies Industry Revenue (Million) Forecast, by Application 2019 & 2032
- Table 108: Japan Autologous Stem Cell and Non-Stem Cell Based Therapies Industry Volume (K Unit) Forecast, by Application 2019 & 2032
- Table 109: India Autologous Stem Cell and Non-Stem Cell Based Therapies Industry Revenue (Million) Forecast, by Application 2019 & 2032
- Table 110: India Autologous Stem Cell and Non-Stem Cell Based Therapies Industry Volume (K Unit) Forecast, by Application 2019 & 2032
- Table 111: Australia Autologous Stem Cell and Non-Stem Cell Based Therapies Industry Revenue (Million) Forecast, by Application 2019 & 2032
- Table 112: Australia Autologous Stem Cell and Non-Stem Cell Based Therapies Industry Volume (K Unit) Forecast, by Application 2019 & 2032
- Table 113: South Korea Autologous Stem Cell and Non-Stem Cell Based Therapies Industry Revenue (Million) Forecast, by Application 2019 & 2032
- Table 114: South Korea Autologous Stem Cell and Non-Stem Cell Based Therapies Industry Volume (K Unit) Forecast, by Application 2019 & 2032
- Table 115: Rest of Asia Pacific Autologous Stem Cell and Non-Stem Cell Based Therapies Industry Revenue (Million) Forecast, by Application 2019 & 2032
- Table 116: Rest of Asia Pacific Autologous Stem Cell and Non-Stem Cell Based Therapies Industry Volume (K Unit) Forecast, by Application 2019 & 2032
- Table 117: Global Autologous Stem Cell and Non-Stem Cell Based Therapies Industry Revenue Million Forecast, by Type 2019 & 2032
- Table 118: Global Autologous Stem Cell and Non-Stem Cell Based Therapies Industry Volume K Unit Forecast, by Type 2019 & 2032
- Table 119: Global Autologous Stem Cell and Non-Stem Cell Based Therapies Industry Revenue Million Forecast, by Application 2019 & 2032
- Table 120: Global Autologous Stem Cell and Non-Stem Cell Based Therapies Industry Volume K Unit Forecast, by Application 2019 & 2032
- Table 121: Global Autologous Stem Cell and Non-Stem Cell Based Therapies Industry Revenue Million Forecast, by End User 2019 & 2032
- Table 122: Global Autologous Stem Cell and Non-Stem Cell Based Therapies Industry Volume K Unit Forecast, by End User 2019 & 2032
- Table 123: Global Autologous Stem Cell and Non-Stem Cell Based Therapies Industry Revenue Million Forecast, by Country 2019 & 2032
- Table 124: Global Autologous Stem Cell and Non-Stem Cell Based Therapies Industry Volume K Unit Forecast, by Country 2019 & 2032
- Table 125: GCC Autologous Stem Cell and Non-Stem Cell Based Therapies Industry Revenue (Million) Forecast, by Application 2019 & 2032
- Table 126: GCC Autologous Stem Cell and Non-Stem Cell Based Therapies Industry Volume (K Unit) Forecast, by Application 2019 & 2032
- Table 127: South Africa Autologous Stem Cell and Non-Stem Cell Based Therapies Industry Revenue (Million) Forecast, by Application 2019 & 2032
- Table 128: South Africa Autologous Stem Cell and Non-Stem Cell Based Therapies Industry Volume (K Unit) Forecast, by Application 2019 & 2032
- Table 129: Rest of Middle East and Africa Autologous Stem Cell and Non-Stem Cell Based Therapies Industry Revenue (Million) Forecast, by Application 2019 & 2032
- Table 130: Rest of Middle East and Africa Autologous Stem Cell and Non-Stem Cell Based Therapies Industry Volume (K Unit) Forecast, by Application 2019 & 2032
- Table 131: Global Autologous Stem Cell and Non-Stem Cell Based Therapies Industry Revenue Million Forecast, by Type 2019 & 2032
- Table 132: Global Autologous Stem Cell and Non-Stem Cell Based Therapies Industry Volume K Unit Forecast, by Type 2019 & 2032
- Table 133: Global Autologous Stem Cell and Non-Stem Cell Based Therapies Industry Revenue Million Forecast, by Application 2019 & 2032
- Table 134: Global Autologous Stem Cell and Non-Stem Cell Based Therapies Industry Volume K Unit Forecast, by Application 2019 & 2032
- Table 135: Global Autologous Stem Cell and Non-Stem Cell Based Therapies Industry Revenue Million Forecast, by End User 2019 & 2032
- Table 136: Global Autologous Stem Cell and Non-Stem Cell Based Therapies Industry Volume K Unit Forecast, by End User 2019 & 2032
- Table 137: Global Autologous Stem Cell and Non-Stem Cell Based Therapies Industry Revenue Million Forecast, by Country 2019 & 2032
- Table 138: Global Autologous Stem Cell and Non-Stem Cell Based Therapies Industry Volume K Unit Forecast, by Country 2019 & 2032
- Table 139: Brazil Autologous Stem Cell and Non-Stem Cell Based Therapies Industry Revenue (Million) Forecast, by Application 2019 & 2032
- Table 140: Brazil Autologous Stem Cell and Non-Stem Cell Based Therapies Industry Volume (K Unit) Forecast, by Application 2019 & 2032
- Table 141: Argentina Autologous Stem Cell and Non-Stem Cell Based Therapies Industry Revenue (Million) Forecast, by Application 2019 & 2032
- Table 142: Argentina Autologous Stem Cell and Non-Stem Cell Based Therapies Industry Volume (K Unit) Forecast, by Application 2019 & 2032
- Table 143: Rest of South America Autologous Stem Cell and Non-Stem Cell Based Therapies Industry Revenue (Million) Forecast, by Application 2019 & 2032
- Table 144: Rest of South America Autologous Stem Cell and Non-Stem Cell Based Therapies Industry Volume (K Unit) Forecast, by Application 2019 & 2032
Frequently Asked Questions
1. What is the projected Compound Annual Growth Rate (CAGR) of the Autologous Stem Cell and Non-Stem Cell Based Therapies Industry?
The projected CAGR is approximately 14.26%.
2. Which companies are prominent players in the Autologous Stem Cell and Non-Stem Cell Based Therapies Industry?
Key companies in the market include Dendreon Pharmaceuticals LLC, Cytori Therapeutics Inc, Novartis International AG, Caladrius Biosciences Inc, BrainStorm Cell Limited, Vericel Corp, Gilead Sciences Inc , Castle Creek Biosciences Inc, US Stem Cell Inc, Holostem Terapie Avanzate Srl.
3. What are the main segments of the Autologous Stem Cell and Non-Stem Cell Based Therapies Industry?
The market segments include Type, Application, End User.
4. Can you provide details about the market size?
The market size is estimated to be USD XX Million as of 2022.
5. What are some drivers contributing to market growth?
Rising Prevalence of Targeted Diseases; Introduction of Novel Autologous Stem Cell Based Therapies in Regenerative Medicine; Increasing Geriatric Population.
6. What are the notable trends driving market growth?
Cancer Segment Holds Significant Share in the Autologous Stem Cell and Non-Stem Cell Based Therapies Market.
7. Are there any restraints impacting market growth?
High Cost of Autologous Cellular Therapies; Lack of Skilled Professionals.
8. Can you provide examples of recent developments in the market?
In April 2022, Metcela acquired Japan Regenerative Medicine Co. Ltd to develop cardiac stem cell-based therapy. Through the acquisition, Metcela will add an autologous cell product for pediatric congenital heart disease to its pipeline and significantly strengthen its clinical development infrastructure for regenerative medicine products.
9. What pricing options are available for accessing the report?
Pricing options include single-user, multi-user, and enterprise licenses priced at USD 4750, USD 5250, and USD 8750 respectively.
10. Is the market size provided in terms of value or volume?
The market size is provided in terms of value, measured in Million and volume, measured in K Unit.
11. Are there any specific market keywords associated with the report?
Yes, the market keyword associated with the report is "Autologous Stem Cell and Non-Stem Cell Based Therapies Industry," which aids in identifying and referencing the specific market segment covered.
12. How do I determine which pricing option suits my needs best?
The pricing options vary based on user requirements and access needs. Individual users may opt for single-user licenses, while businesses requiring broader access may choose multi-user or enterprise licenses for cost-effective access to the report.
13. Are there any additional resources or data provided in the Autologous Stem Cell and Non-Stem Cell Based Therapies Industry report?
While the report offers comprehensive insights, it's advisable to review the specific contents or supplementary materials provided to ascertain if additional resources or data are available.
14. How can I stay updated on further developments or reports in the Autologous Stem Cell and Non-Stem Cell Based Therapies Industry?
To stay informed about further developments, trends, and reports in the Autologous Stem Cell and Non-Stem Cell Based Therapies Industry, consider subscribing to industry newsletters, following relevant companies and organizations, or regularly checking reputable industry news sources and publications.
Methodology
Step 1 - Identification of Relevant Samples Size from Population Database


Step 2 - Approaches for Defining Global Market Size (Value, Volume* & Price*)

Note*: In applicable scenarios
Step 3 - Data Sources
Primary Research
- Web Analytics
- Survey Reports
- Research Institute
- Latest Research Reports
- Opinion Leaders
Secondary Research
- Annual Reports
- White Paper
- Latest Press Release
- Industry Association
- Paid Database
- Investor Presentations

Step 4 - Data Triangulation
Involves using different sources of information in order to increase the validity of a study
These sources are likely to be stakeholders in a program - participants, other researchers, program staff, other community members, and so on.
Then we put all data in single framework & apply various statistical tools to find out the dynamic on the market.
During the analysis stage, feedback from the stakeholder groups would be compared to determine areas of agreement as well as areas of divergence
