

Key Insights
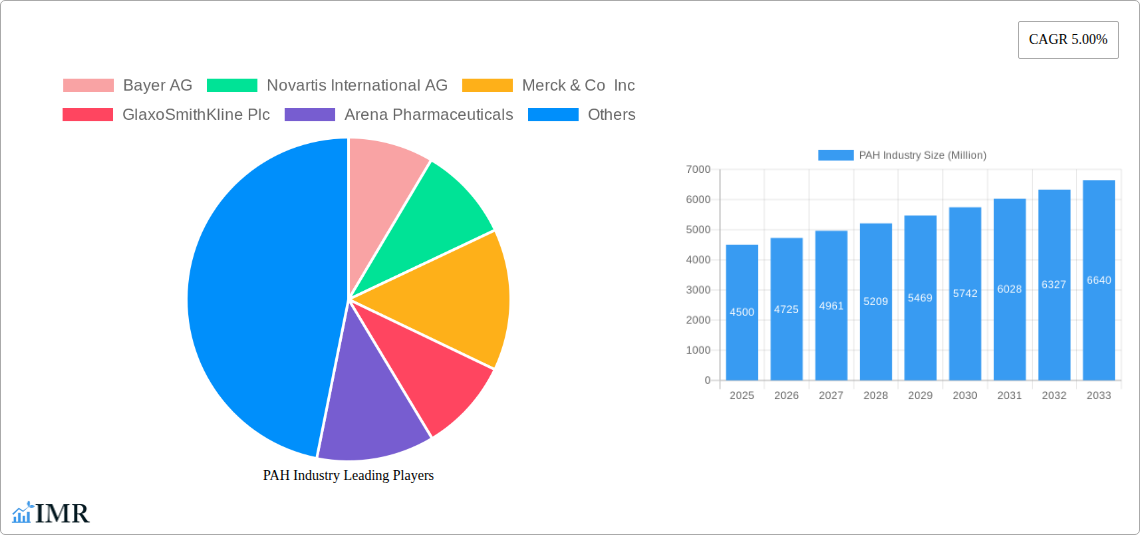
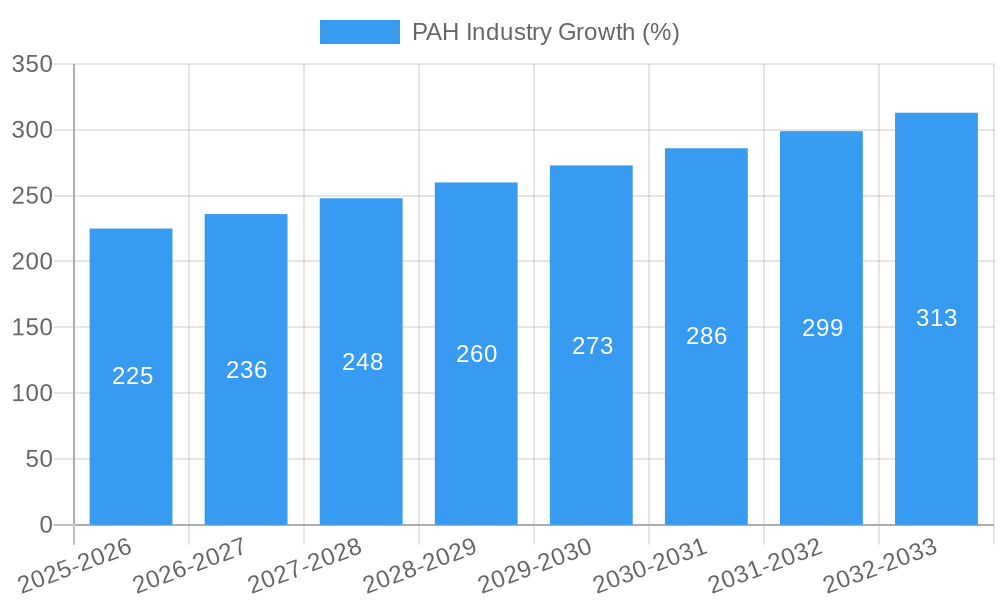
The Pulmonary Arterial Hypertension (PAH) market, valued at approximately $4.5 billion in 2025, is projected to experience robust growth, exhibiting a Compound Annual Growth Rate (CAGR) of 5.00% from 2025 to 2033. This expansion is driven by several key factors. Increasing prevalence of PAH, particularly among women and older adults, fuels demand for effective treatments. Advancements in therapeutic approaches, including the development of novel targeted therapies and combination regimens, offer improved efficacy and reduced side effects, further stimulating market growth. Moreover, rising healthcare expenditure and increased awareness of PAH among healthcare professionals and patients contribute significantly to the market's positive trajectory. The market’s segmentation reveals the dominance of Prostacyclin and Prostacyclin Analogs, reflecting their established efficacy and widespread use. However, other drug classes like Calcium Channel Blockers, Phosphodiesterase 5 (PDE-5) inhibitors, and Endothelin Receptor Antagonists (ERAs) also represent substantial market segments and are expected to witness growth due to ongoing research and development efforts.
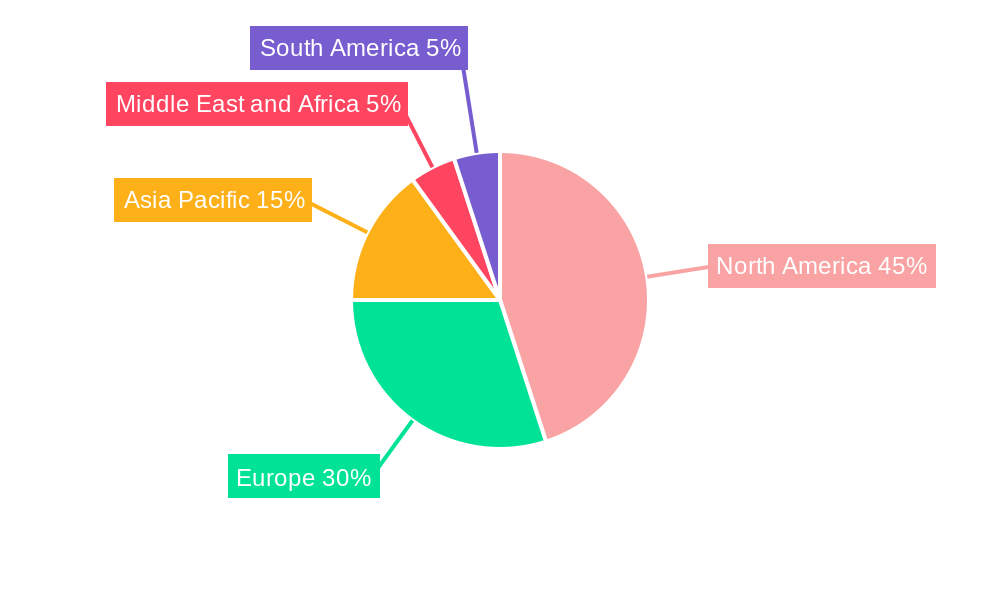
Significant regional variations exist within the PAH market. North America and Europe currently hold the largest market shares, driven by established healthcare infrastructure, high disease prevalence, and robust reimbursement policies. However, the Asia-Pacific region is expected to experience the fastest growth rate due to increasing healthcare expenditure, rising awareness, and a growing geriatric population. Key players like Bayer AG, Novartis, Merck, and Gilead Sciences, among others, are actively engaged in research and development, contributing to innovative treatment options and shaping the competitive landscape. While challenges such as high treatment costs and potential side effects remain, the overall market outlook for PAH remains positive, driven by consistent advancements in therapeutic strategies and increased focus on early diagnosis and patient management.
Pulmonary Arterial Hypertension (PAH) Industry Market Report: 2019-2033
This comprehensive report provides a detailed analysis of the Pulmonary Arterial Hypertension (PAH) industry, encompassing market dynamics, growth trends, competitive landscape, and future outlook. The study period covers 2019-2033, with 2025 as the base and estimated year. This report is invaluable for industry professionals, investors, and researchers seeking in-depth insights into this critical sector of the pharmaceutical market. The report leverages extensive data analysis to offer actionable intelligence and forecasts for the coming years.
Parent Market: Pharmaceutical Industry Child Market: Rare Diseases Therapeutics
PAH Industry Market Dynamics & Structure
This section analyzes the structure and dynamics of the PAH market, focusing on market concentration, technological innovation, regulatory landscape, competitive substitutes, end-user demographics, and mergers & acquisitions (M&A) activity. The global PAH market size in 2024 was estimated to be xx Million units, with a projected value of xx Million units by 2033.
- Market Concentration: The PAH market is characterized by a moderately concentrated landscape, with a few key players holding significant market share. The top five companies account for approximately 60% of the market (xx Million units). This concentration is driven by the high cost of research and development, along with the significant regulatory hurdles associated with bringing new PAH treatments to market.
- Technological Innovation: Technological advancements are crucial to the ongoing evolution of the PAH treatment landscape. Innovation in drug delivery systems, along with targeted therapies and novel drug mechanisms, are key drivers. However, high R&D costs and prolonged clinical trial periods pose significant barriers to innovation.
- Regulatory Framework: Stringent regulatory requirements for drug approvals and safety monitoring significantly impact market entry and growth. The process necessitates robust clinical trial data and rigorous safety evaluations, influencing timelines and market access.
- Competitive Product Substitutes: Limited therapeutic alternatives directly compete with established PAH treatments. However, the emergence of new drug classes and novel therapeutic approaches is potentially disrupting the market.
- End-User Demographics: The aging population and the increasing prevalence of PAH are key drivers of market growth. Expanding patient access and improved healthcare infrastructure further contribute to this market expansion.
- M&A Trends: The PAH market has seen significant M&A activity in recent years. A total of xx M&A deals were recorded between 2019 and 2024. These transactions often aim to expand product portfolios, access innovative technologies, and enhance market reach.
PAH Industry Growth Trends & Insights
The global PAH market has experienced substantial growth over the past five years, driven by factors such as increasing prevalence of the disease, rising healthcare expenditure, and technological advancements in treatment options. The market exhibited a CAGR of xx% during the historical period (2019-2024) and is projected to maintain a CAGR of xx% during the forecast period (2025-2033), reaching an estimated xx Million units by 2033. This growth is supported by increasing awareness about PAH, improved diagnostic capabilities, and the approval of newer, more effective therapies. However, high treatment costs and limited access to advanced therapies, particularly in developing economies, could influence market growth. Market penetration of new therapies is also expected to gradually increase, contributing significantly to market expansion.
Dominant Regions, Countries, or Segments in PAH Industry
North America currently dominates the PAH market, holding the largest market share (xx%) in 2024, followed by Europe (xx%) and Asia Pacific (xx%). This dominance is attributed to factors such as high healthcare spending, well-established healthcare infrastructure, and a relatively higher prevalence of PAH.
By Drug Class:
- Prostacyclin and Prostacyclin Analogs: This segment is currently the largest, representing xx% of the market in 2024 (xx Million units). Continued innovation in this class and increased adoption drive its market growth.
- Endothelin Receptor Antagonists (ERA): This segment is experiencing steady growth, due to increased efficacy and improved patient tolerability.
- Calcium Channel Blockers: This segment represents a stable portion of the market and will continue with moderate growth.
- Phosphodiesterase 5 (PDE-5): This segment holds a moderate market share and is likely to experience growth.
- Others: This segment includes newer therapies and holds a smaller market share but is expected to grow with the introduction of innovative treatments.
Key Drivers for Market Dominance:
- Advanced healthcare infrastructure and high healthcare expenditure in North America and Europe.
- Increased prevalence of PAH and rising awareness among healthcare professionals and patients.
- Early adoption of advanced therapies and strong regulatory support for new drug approvals.
PAH Industry Product Landscape
The PAH treatment landscape comprises various drug classes, each with unique mechanisms of action and therapeutic benefits. Recent advancements focus on improving efficacy, reducing side effects, and streamlining administration. This includes the development of novel drug delivery systems, targeted therapies, and combination treatments aimed at enhancing overall treatment outcomes. Companies are also exploring new drug candidates and therapeutic approaches, aiming to improve patient quality of life and address unmet medical needs. Key selling points often focus on improved efficacy, reduced side effects, and ease of administration.
Key Drivers, Barriers & Challenges in PAH Industry
Key Drivers:
- Increasing prevalence of PAH globally.
- Advancements in diagnostics and therapeutic approaches.
- Growing awareness and improved patient education.
- Increased healthcare spending and insurance coverage.
Key Challenges & Restraints:
- High cost of treatment and limited accessibility in developing countries.
- Stringent regulatory hurdles for new drug approvals.
- Limited treatment options for certain patient populations.
- Potential for drug-related side effects and toxicity. The high cost of R&D and drug pricing have a significant impact, reducing market access.
Emerging Opportunities in PAH Industry
- Development of novel therapeutic approaches and combination therapies.
- Expansion into untapped markets in developing countries.
- Personalized medicine strategies targeting specific patient subpopulations.
- Improvement of diagnostic tools and early detection strategies.
Growth Accelerators in the PAH Industry Industry
Technological breakthroughs in drug development, particularly in targeted therapies and novel drug delivery systems, are significantly accelerating market growth. Strategic partnerships and collaborations among pharmaceutical companies, research institutions, and patient advocacy groups will further facilitate the advancement of PAH treatments. Successful market expansion strategies targeting underserved populations and geographical regions will also play a vital role in driving future growth.
Key Players Shaping the PAH Industry Market
- Bayer AG
- Novartis International AG
- Merck & Co Inc
- GlaxoSmithKline Plc
- Arena Pharmaceuticals
- Johnson & Johnson (Actelion Pharmaceuticals Ltd )
- Gilead Sciences Inc
- Bristol-Myers Squibb Company
- United Therapeutics Corporation
- Pfizer Inc
Notable Milestones in PAH Industry Sector
- July 2022: Cereno Scientific announced the enrollment of the first patient in a Phase II study for PAH using drug candidate CS1.
- June 2022: Gossamer Bio, Inc. published key preclinical data supporting the potential of seralutinib for PAH treatment.
In-Depth PAH Industry Market Outlook
The PAH market is poised for continued growth driven by technological advancements, strategic collaborations, and expansion into emerging markets. Future opportunities lie in personalized medicine, early diagnosis, and the development of innovative therapies to address unmet medical needs. The market's long-term potential is substantial, presenting significant opportunities for companies engaged in research, development, and commercialization of PAH treatments.
PAH Industry Segmentation
-
1. Drug Class
- 1.1. Prostacyclin and Prostacyclin Analogs
- 1.2. Calcium Channel Blockers
- 1.3. Phosphodiesterase 5 (PDE-5)
- 1.4. Endothelin Receptor Antagonists (ERA)
- 1.5. Others
PAH Industry Segmentation By Geography
-
1. North America
- 1.1. United States
- 1.2. Canada
- 1.3. Mexico
-
2. Europe
- 2.1. Germany
- 2.2. United Kingdom
- 2.3. France
- 2.4. Italy
- 2.5. Spain
- 2.6. Rest of Europe
-
3. Asia Pacific
- 3.1. China
- 3.2. Japan
- 3.3. India
- 3.4. Australia
- 3.5. South Korea
- 3.6. Rest of Asia Pacific
-
4. Middle East and Africa
- 4.1. GCC
- 4.2. South Africa
- 4.3. Rest of Middle East and Africa
-
5. South America
- 5.1. Brazil
- 5.2. Argentina
- 5.3. Rest of South America
PAH Industry REPORT HIGHLIGHTS
| Aspects | Details |
|---|---|
| Study Period | 2019-2033 |
| Base Year | 2024 |
| Estimated Year | 2025 |
| Forecast Period | 2025-2033 |
| Historical Period | 2019-2024 |
| Growth Rate | CAGR of 5.00% from 2019-2033 |
| Segmentation |
|
Table of Contents
- 1. Introduction
- 1.1. Research Scope
- 1.2. Market Segmentation
- 1.3. Research Methodology
- 1.4. Definitions and Assumptions
- 2. Executive Summary
- 2.1. Introduction
- 3. Market Dynamics
- 3.1. Introduction
- 3.2. Market Drivers
- 3.2.1. Growing Burden of Pulmonary Arterial Hypertension; Government and Private Support for the Development of Orphan Drugs
- 3.3. Market Restrains
- 3.3.1. Patent Expiration of Drug Molecule; Side Effects Associated with the Drugs
- 3.4. Market Trends
- 3.4.1. Prostacyclin and Prostacyclin Analogs Segment is Expected to Observe Better Growth Over the Forecast Period
- 4. Market Factor Analysis
- 4.1. Porters Five Forces
- 4.2. Supply/Value Chain
- 4.3. PESTEL analysis
- 4.4. Market Entropy
- 4.5. Patent/Trademark Analysis
- 5. Global PAH Industry Analysis, Insights and Forecast, 2019-2031
- 5.1. Market Analysis, Insights and Forecast - by Drug Class
- 5.1.1. Prostacyclin and Prostacyclin Analogs
- 5.1.2. Calcium Channel Blockers
- 5.1.3. Phosphodiesterase 5 (PDE-5)
- 5.1.4. Endothelin Receptor Antagonists (ERA)
- 5.1.5. Others
- 5.2. Market Analysis, Insights and Forecast - by Region
- 5.2.1. North America
- 5.2.2. Europe
- 5.2.3. Asia Pacific
- 5.2.4. Middle East and Africa
- 5.2.5. South America
- 5.1. Market Analysis, Insights and Forecast - by Drug Class
- 6. North America PAH Industry Analysis, Insights and Forecast, 2019-2031
- 6.1. Market Analysis, Insights and Forecast - by Drug Class
- 6.1.1. Prostacyclin and Prostacyclin Analogs
- 6.1.2. Calcium Channel Blockers
- 6.1.3. Phosphodiesterase 5 (PDE-5)
- 6.1.4. Endothelin Receptor Antagonists (ERA)
- 6.1.5. Others
- 6.1. Market Analysis, Insights and Forecast - by Drug Class
- 7. Europe PAH Industry Analysis, Insights and Forecast, 2019-2031
- 7.1. Market Analysis, Insights and Forecast - by Drug Class
- 7.1.1. Prostacyclin and Prostacyclin Analogs
- 7.1.2. Calcium Channel Blockers
- 7.1.3. Phosphodiesterase 5 (PDE-5)
- 7.1.4. Endothelin Receptor Antagonists (ERA)
- 7.1.5. Others
- 7.1. Market Analysis, Insights and Forecast - by Drug Class
- 8. Asia Pacific PAH Industry Analysis, Insights and Forecast, 2019-2031
- 8.1. Market Analysis, Insights and Forecast - by Drug Class
- 8.1.1. Prostacyclin and Prostacyclin Analogs
- 8.1.2. Calcium Channel Blockers
- 8.1.3. Phosphodiesterase 5 (PDE-5)
- 8.1.4. Endothelin Receptor Antagonists (ERA)
- 8.1.5. Others
- 8.1. Market Analysis, Insights and Forecast - by Drug Class
- 9. Middle East and Africa PAH Industry Analysis, Insights and Forecast, 2019-2031
- 9.1. Market Analysis, Insights and Forecast - by Drug Class
- 9.1.1. Prostacyclin and Prostacyclin Analogs
- 9.1.2. Calcium Channel Blockers
- 9.1.3. Phosphodiesterase 5 (PDE-5)
- 9.1.4. Endothelin Receptor Antagonists (ERA)
- 9.1.5. Others
- 9.1. Market Analysis, Insights and Forecast - by Drug Class
- 10. South America PAH Industry Analysis, Insights and Forecast, 2019-2031
- 10.1. Market Analysis, Insights and Forecast - by Drug Class
- 10.1.1. Prostacyclin and Prostacyclin Analogs
- 10.1.2. Calcium Channel Blockers
- 10.1.3. Phosphodiesterase 5 (PDE-5)
- 10.1.4. Endothelin Receptor Antagonists (ERA)
- 10.1.5. Others
- 10.1. Market Analysis, Insights and Forecast - by Drug Class
- 11. North America PAH Industry Analysis, Insights and Forecast, 2019-2031
- 11.1. Market Analysis, Insights and Forecast - By Country/Sub-region
- 11.1.1. undefined
- 12. Europe PAH Industry Analysis, Insights and Forecast, 2019-2031
- 12.1. Market Analysis, Insights and Forecast - By Country/Sub-region
- 12.1.1. undefined
- 13. Asia Pacific PAH Industry Analysis, Insights and Forecast, 2019-2031
- 13.1. Market Analysis, Insights and Forecast - By Country/Sub-region
- 13.1.1. undefined
- 14. Middle East and Africa PAH Industry Analysis, Insights and Forecast, 2019-2031
- 14.1. Market Analysis, Insights and Forecast - By Country/Sub-region
- 14.1.1. undefined
- 15. South America PAH Industry Analysis, Insights and Forecast, 2019-2031
- 15.1. Market Analysis, Insights and Forecast - By Country/Sub-region
- 15.1.1. undefined
- 16. Competitive Analysis
- 16.1. Global Market Share Analysis 2024
- 16.2. Company Profiles
- 16.2.1 Bayer AG
- 16.2.1.1. Overview
- 16.2.1.2. Products
- 16.2.1.3. SWOT Analysis
- 16.2.1.4. Recent Developments
- 16.2.1.5. Financials (Based on Availability)
- 16.2.2 Novartis International AG
- 16.2.2.1. Overview
- 16.2.2.2. Products
- 16.2.2.3. SWOT Analysis
- 16.2.2.4. Recent Developments
- 16.2.2.5. Financials (Based on Availability)
- 16.2.3 Merck & Co Inc
- 16.2.3.1. Overview
- 16.2.3.2. Products
- 16.2.3.3. SWOT Analysis
- 16.2.3.4. Recent Developments
- 16.2.3.5. Financials (Based on Availability)
- 16.2.4 GlaxoSmithKline Plc
- 16.2.4.1. Overview
- 16.2.4.2. Products
- 16.2.4.3. SWOT Analysis
- 16.2.4.4. Recent Developments
- 16.2.4.5. Financials (Based on Availability)
- 16.2.5 Arena Pharmaceuticals
- 16.2.5.1. Overview
- 16.2.5.2. Products
- 16.2.5.3. SWOT Analysis
- 16.2.5.4. Recent Developments
- 16.2.5.5. Financials (Based on Availability)
- 16.2.6 Johnson & Johnson (Actelion Pharmaceuticals Ltd )
- 16.2.6.1. Overview
- 16.2.6.2. Products
- 16.2.6.3. SWOT Analysis
- 16.2.6.4. Recent Developments
- 16.2.6.5. Financials (Based on Availability)
- 16.2.7 Gilead Sciences Inc
- 16.2.7.1. Overview
- 16.2.7.2. Products
- 16.2.7.3. SWOT Analysis
- 16.2.7.4. Recent Developments
- 16.2.7.5. Financials (Based on Availability)
- 16.2.8 Bristol-Myers Squibb Company
- 16.2.8.1. Overview
- 16.2.8.2. Products
- 16.2.8.3. SWOT Analysis
- 16.2.8.4. Recent Developments
- 16.2.8.5. Financials (Based on Availability)
- 16.2.9 United Therapeutics Corporation
- 16.2.9.1. Overview
- 16.2.9.2. Products
- 16.2.9.3. SWOT Analysis
- 16.2.9.4. Recent Developments
- 16.2.9.5. Financials (Based on Availability)
- 16.2.10 Pfizer Inc
- 16.2.10.1. Overview
- 16.2.10.2. Products
- 16.2.10.3. SWOT Analysis
- 16.2.10.4. Recent Developments
- 16.2.10.5. Financials (Based on Availability)
- 16.2.1 Bayer AG
List of Figures
- Figure 1: Global PAH Industry Revenue Breakdown (Million, %) by Region 2024 & 2032
- Figure 2: Global PAH Industry Volume Breakdown (K Unit, %) by Region 2024 & 2032
- Figure 3: North America PAH Industry Revenue (Million), by Country 2024 & 2032
- Figure 4: North America PAH Industry Volume (K Unit), by Country 2024 & 2032
- Figure 5: North America PAH Industry Revenue Share (%), by Country 2024 & 2032
- Figure 6: North America PAH Industry Volume Share (%), by Country 2024 & 2032
- Figure 7: Europe PAH Industry Revenue (Million), by Country 2024 & 2032
- Figure 8: Europe PAH Industry Volume (K Unit), by Country 2024 & 2032
- Figure 9: Europe PAH Industry Revenue Share (%), by Country 2024 & 2032
- Figure 10: Europe PAH Industry Volume Share (%), by Country 2024 & 2032
- Figure 11: Asia Pacific PAH Industry Revenue (Million), by Country 2024 & 2032
- Figure 12: Asia Pacific PAH Industry Volume (K Unit), by Country 2024 & 2032
- Figure 13: Asia Pacific PAH Industry Revenue Share (%), by Country 2024 & 2032
- Figure 14: Asia Pacific PAH Industry Volume Share (%), by Country 2024 & 2032
- Figure 15: Middle East and Africa PAH Industry Revenue (Million), by Country 2024 & 2032
- Figure 16: Middle East and Africa PAH Industry Volume (K Unit), by Country 2024 & 2032
- Figure 17: Middle East and Africa PAH Industry Revenue Share (%), by Country 2024 & 2032
- Figure 18: Middle East and Africa PAH Industry Volume Share (%), by Country 2024 & 2032
- Figure 19: South America PAH Industry Revenue (Million), by Country 2024 & 2032
- Figure 20: South America PAH Industry Volume (K Unit), by Country 2024 & 2032
- Figure 21: South America PAH Industry Revenue Share (%), by Country 2024 & 2032
- Figure 22: South America PAH Industry Volume Share (%), by Country 2024 & 2032
- Figure 23: North America PAH Industry Revenue (Million), by Drug Class 2024 & 2032
- Figure 24: North America PAH Industry Volume (K Unit), by Drug Class 2024 & 2032
- Figure 25: North America PAH Industry Revenue Share (%), by Drug Class 2024 & 2032
- Figure 26: North America PAH Industry Volume Share (%), by Drug Class 2024 & 2032
- Figure 27: North America PAH Industry Revenue (Million), by Country 2024 & 2032
- Figure 28: North America PAH Industry Volume (K Unit), by Country 2024 & 2032
- Figure 29: North America PAH Industry Revenue Share (%), by Country 2024 & 2032
- Figure 30: North America PAH Industry Volume Share (%), by Country 2024 & 2032
- Figure 31: Europe PAH Industry Revenue (Million), by Drug Class 2024 & 2032
- Figure 32: Europe PAH Industry Volume (K Unit), by Drug Class 2024 & 2032
- Figure 33: Europe PAH Industry Revenue Share (%), by Drug Class 2024 & 2032
- Figure 34: Europe PAH Industry Volume Share (%), by Drug Class 2024 & 2032
- Figure 35: Europe PAH Industry Revenue (Million), by Country 2024 & 2032
- Figure 36: Europe PAH Industry Volume (K Unit), by Country 2024 & 2032
- Figure 37: Europe PAH Industry Revenue Share (%), by Country 2024 & 2032
- Figure 38: Europe PAH Industry Volume Share (%), by Country 2024 & 2032
- Figure 39: Asia Pacific PAH Industry Revenue (Million), by Drug Class 2024 & 2032
- Figure 40: Asia Pacific PAH Industry Volume (K Unit), by Drug Class 2024 & 2032
- Figure 41: Asia Pacific PAH Industry Revenue Share (%), by Drug Class 2024 & 2032
- Figure 42: Asia Pacific PAH Industry Volume Share (%), by Drug Class 2024 & 2032
- Figure 43: Asia Pacific PAH Industry Revenue (Million), by Country 2024 & 2032
- Figure 44: Asia Pacific PAH Industry Volume (K Unit), by Country 2024 & 2032
- Figure 45: Asia Pacific PAH Industry Revenue Share (%), by Country 2024 & 2032
- Figure 46: Asia Pacific PAH Industry Volume Share (%), by Country 2024 & 2032
- Figure 47: Middle East and Africa PAH Industry Revenue (Million), by Drug Class 2024 & 2032
- Figure 48: Middle East and Africa PAH Industry Volume (K Unit), by Drug Class 2024 & 2032
- Figure 49: Middle East and Africa PAH Industry Revenue Share (%), by Drug Class 2024 & 2032
- Figure 50: Middle East and Africa PAH Industry Volume Share (%), by Drug Class 2024 & 2032
- Figure 51: Middle East and Africa PAH Industry Revenue (Million), by Country 2024 & 2032
- Figure 52: Middle East and Africa PAH Industry Volume (K Unit), by Country 2024 & 2032
- Figure 53: Middle East and Africa PAH Industry Revenue Share (%), by Country 2024 & 2032
- Figure 54: Middle East and Africa PAH Industry Volume Share (%), by Country 2024 & 2032
- Figure 55: South America PAH Industry Revenue (Million), by Drug Class 2024 & 2032
- Figure 56: South America PAH Industry Volume (K Unit), by Drug Class 2024 & 2032
- Figure 57: South America PAH Industry Revenue Share (%), by Drug Class 2024 & 2032
- Figure 58: South America PAH Industry Volume Share (%), by Drug Class 2024 & 2032
- Figure 59: South America PAH Industry Revenue (Million), by Country 2024 & 2032
- Figure 60: South America PAH Industry Volume (K Unit), by Country 2024 & 2032
- Figure 61: South America PAH Industry Revenue Share (%), by Country 2024 & 2032
- Figure 62: South America PAH Industry Volume Share (%), by Country 2024 & 2032
List of Tables
- Table 1: Global PAH Industry Revenue Million Forecast, by Region 2019 & 2032
- Table 2: Global PAH Industry Volume K Unit Forecast, by Region 2019 & 2032
- Table 3: Global PAH Industry Revenue Million Forecast, by Drug Class 2019 & 2032
- Table 4: Global PAH Industry Volume K Unit Forecast, by Drug Class 2019 & 2032
- Table 5: Global PAH Industry Revenue Million Forecast, by Region 2019 & 2032
- Table 6: Global PAH Industry Volume K Unit Forecast, by Region 2019 & 2032
- Table 7: Global PAH Industry Revenue Million Forecast, by Country 2019 & 2032
- Table 8: Global PAH Industry Volume K Unit Forecast, by Country 2019 & 2032
- Table 9: Global PAH Industry Revenue Million Forecast, by Country 2019 & 2032
- Table 10: Global PAH Industry Volume K Unit Forecast, by Country 2019 & 2032
- Table 11: Global PAH Industry Revenue Million Forecast, by Country 2019 & 2032
- Table 12: Global PAH Industry Volume K Unit Forecast, by Country 2019 & 2032
- Table 13: Global PAH Industry Revenue Million Forecast, by Country 2019 & 2032
- Table 14: Global PAH Industry Volume K Unit Forecast, by Country 2019 & 2032
- Table 15: Global PAH Industry Revenue Million Forecast, by Country 2019 & 2032
- Table 16: Global PAH Industry Volume K Unit Forecast, by Country 2019 & 2032
- Table 17: Global PAH Industry Revenue Million Forecast, by Drug Class 2019 & 2032
- Table 18: Global PAH Industry Volume K Unit Forecast, by Drug Class 2019 & 2032
- Table 19: Global PAH Industry Revenue Million Forecast, by Country 2019 & 2032
- Table 20: Global PAH Industry Volume K Unit Forecast, by Country 2019 & 2032
- Table 21: United States PAH Industry Revenue (Million) Forecast, by Application 2019 & 2032
- Table 22: United States PAH Industry Volume (K Unit) Forecast, by Application 2019 & 2032
- Table 23: Canada PAH Industry Revenue (Million) Forecast, by Application 2019 & 2032
- Table 24: Canada PAH Industry Volume (K Unit) Forecast, by Application 2019 & 2032
- Table 25: Mexico PAH Industry Revenue (Million) Forecast, by Application 2019 & 2032
- Table 26: Mexico PAH Industry Volume (K Unit) Forecast, by Application 2019 & 2032
- Table 27: Global PAH Industry Revenue Million Forecast, by Drug Class 2019 & 2032
- Table 28: Global PAH Industry Volume K Unit Forecast, by Drug Class 2019 & 2032
- Table 29: Global PAH Industry Revenue Million Forecast, by Country 2019 & 2032
- Table 30: Global PAH Industry Volume K Unit Forecast, by Country 2019 & 2032
- Table 31: Germany PAH Industry Revenue (Million) Forecast, by Application 2019 & 2032
- Table 32: Germany PAH Industry Volume (K Unit) Forecast, by Application 2019 & 2032
- Table 33: United Kingdom PAH Industry Revenue (Million) Forecast, by Application 2019 & 2032
- Table 34: United Kingdom PAH Industry Volume (K Unit) Forecast, by Application 2019 & 2032
- Table 35: France PAH Industry Revenue (Million) Forecast, by Application 2019 & 2032
- Table 36: France PAH Industry Volume (K Unit) Forecast, by Application 2019 & 2032
- Table 37: Italy PAH Industry Revenue (Million) Forecast, by Application 2019 & 2032
- Table 38: Italy PAH Industry Volume (K Unit) Forecast, by Application 2019 & 2032
- Table 39: Spain PAH Industry Revenue (Million) Forecast, by Application 2019 & 2032
- Table 40: Spain PAH Industry Volume (K Unit) Forecast, by Application 2019 & 2032
- Table 41: Rest of Europe PAH Industry Revenue (Million) Forecast, by Application 2019 & 2032
- Table 42: Rest of Europe PAH Industry Volume (K Unit) Forecast, by Application 2019 & 2032
- Table 43: Global PAH Industry Revenue Million Forecast, by Drug Class 2019 & 2032
- Table 44: Global PAH Industry Volume K Unit Forecast, by Drug Class 2019 & 2032
- Table 45: Global PAH Industry Revenue Million Forecast, by Country 2019 & 2032
- Table 46: Global PAH Industry Volume K Unit Forecast, by Country 2019 & 2032
- Table 47: China PAH Industry Revenue (Million) Forecast, by Application 2019 & 2032
- Table 48: China PAH Industry Volume (K Unit) Forecast, by Application 2019 & 2032
- Table 49: Japan PAH Industry Revenue (Million) Forecast, by Application 2019 & 2032
- Table 50: Japan PAH Industry Volume (K Unit) Forecast, by Application 2019 & 2032
- Table 51: India PAH Industry Revenue (Million) Forecast, by Application 2019 & 2032
- Table 52: India PAH Industry Volume (K Unit) Forecast, by Application 2019 & 2032
- Table 53: Australia PAH Industry Revenue (Million) Forecast, by Application 2019 & 2032
- Table 54: Australia PAH Industry Volume (K Unit) Forecast, by Application 2019 & 2032
- Table 55: South Korea PAH Industry Revenue (Million) Forecast, by Application 2019 & 2032
- Table 56: South Korea PAH Industry Volume (K Unit) Forecast, by Application 2019 & 2032
- Table 57: Rest of Asia Pacific PAH Industry Revenue (Million) Forecast, by Application 2019 & 2032
- Table 58: Rest of Asia Pacific PAH Industry Volume (K Unit) Forecast, by Application 2019 & 2032
- Table 59: Global PAH Industry Revenue Million Forecast, by Drug Class 2019 & 2032
- Table 60: Global PAH Industry Volume K Unit Forecast, by Drug Class 2019 & 2032
- Table 61: Global PAH Industry Revenue Million Forecast, by Country 2019 & 2032
- Table 62: Global PAH Industry Volume K Unit Forecast, by Country 2019 & 2032
- Table 63: GCC PAH Industry Revenue (Million) Forecast, by Application 2019 & 2032
- Table 64: GCC PAH Industry Volume (K Unit) Forecast, by Application 2019 & 2032
- Table 65: South Africa PAH Industry Revenue (Million) Forecast, by Application 2019 & 2032
- Table 66: South Africa PAH Industry Volume (K Unit) Forecast, by Application 2019 & 2032
- Table 67: Rest of Middle East and Africa PAH Industry Revenue (Million) Forecast, by Application 2019 & 2032
- Table 68: Rest of Middle East and Africa PAH Industry Volume (K Unit) Forecast, by Application 2019 & 2032
- Table 69: Global PAH Industry Revenue Million Forecast, by Drug Class 2019 & 2032
- Table 70: Global PAH Industry Volume K Unit Forecast, by Drug Class 2019 & 2032
- Table 71: Global PAH Industry Revenue Million Forecast, by Country 2019 & 2032
- Table 72: Global PAH Industry Volume K Unit Forecast, by Country 2019 & 2032
- Table 73: Brazil PAH Industry Revenue (Million) Forecast, by Application 2019 & 2032
- Table 74: Brazil PAH Industry Volume (K Unit) Forecast, by Application 2019 & 2032
- Table 75: Argentina PAH Industry Revenue (Million) Forecast, by Application 2019 & 2032
- Table 76: Argentina PAH Industry Volume (K Unit) Forecast, by Application 2019 & 2032
- Table 77: Rest of South America PAH Industry Revenue (Million) Forecast, by Application 2019 & 2032
- Table 78: Rest of South America PAH Industry Volume (K Unit) Forecast, by Application 2019 & 2032
Frequently Asked Questions
1. What is the projected Compound Annual Growth Rate (CAGR) of the PAH Industry?
The projected CAGR is approximately 5.00%.
2. Which companies are prominent players in the PAH Industry?
Key companies in the market include Bayer AG, Novartis International AG, Merck & Co Inc, GlaxoSmithKline Plc, Arena Pharmaceuticals, Johnson & Johnson (Actelion Pharmaceuticals Ltd ), Gilead Sciences Inc, Bristol-Myers Squibb Company, United Therapeutics Corporation, Pfizer Inc.
3. What are the main segments of the PAH Industry?
The market segments include Drug Class.
4. Can you provide details about the market size?
The market size is estimated to be USD XX Million as of 2022.
5. What are some drivers contributing to market growth?
Growing Burden of Pulmonary Arterial Hypertension; Government and Private Support for the Development of Orphan Drugs.
6. What are the notable trends driving market growth?
Prostacyclin and Prostacyclin Analogs Segment is Expected to Observe Better Growth Over the Forecast Period.
7. Are there any restraints impacting market growth?
Patent Expiration of Drug Molecule; Side Effects Associated with the Drugs.
8. Can you provide examples of recent developments in the market?
In July 2022, Cereno Scientific announced that the first patient had been enrolled in the Phase II study in pulmonary arterial hypertension (PAH) with drug candidate CS1.
9. What pricing options are available for accessing the report?
Pricing options include single-user, multi-user, and enterprise licenses priced at USD 4750, USD 5250, and USD 8750 respectively.
10. Is the market size provided in terms of value or volume?
The market size is provided in terms of value, measured in Million and volume, measured in K Unit.
11. Are there any specific market keywords associated with the report?
Yes, the market keyword associated with the report is "PAH Industry," which aids in identifying and referencing the specific market segment covered.
12. How do I determine which pricing option suits my needs best?
The pricing options vary based on user requirements and access needs. Individual users may opt for single-user licenses, while businesses requiring broader access may choose multi-user or enterprise licenses for cost-effective access to the report.
13. Are there any additional resources or data provided in the PAH Industry report?
While the report offers comprehensive insights, it's advisable to review the specific contents or supplementary materials provided to ascertain if additional resources or data are available.
14. How can I stay updated on further developments or reports in the PAH Industry?
To stay informed about further developments, trends, and reports in the PAH Industry, consider subscribing to industry newsletters, following relevant companies and organizations, or regularly checking reputable industry news sources and publications.
Methodology
Step 1 - Identification of Relevant Samples Size from Population Database


Step 2 - Approaches for Defining Global Market Size (Value, Volume* & Price*)

Note*: In applicable scenarios
Step 3 - Data Sources
Primary Research
- Web Analytics
- Survey Reports
- Research Institute
- Latest Research Reports
- Opinion Leaders
Secondary Research
- Annual Reports
- White Paper
- Latest Press Release
- Industry Association
- Paid Database
- Investor Presentations

Step 4 - Data Triangulation
Involves using different sources of information in order to increase the validity of a study
These sources are likely to be stakeholders in a program - participants, other researchers, program staff, other community members, and so on.
Then we put all data in single framework & apply various statistical tools to find out the dynamic on the market.
During the analysis stage, feedback from the stakeholder groups would be compared to determine areas of agreement as well as areas of divergence
