

Key Insights
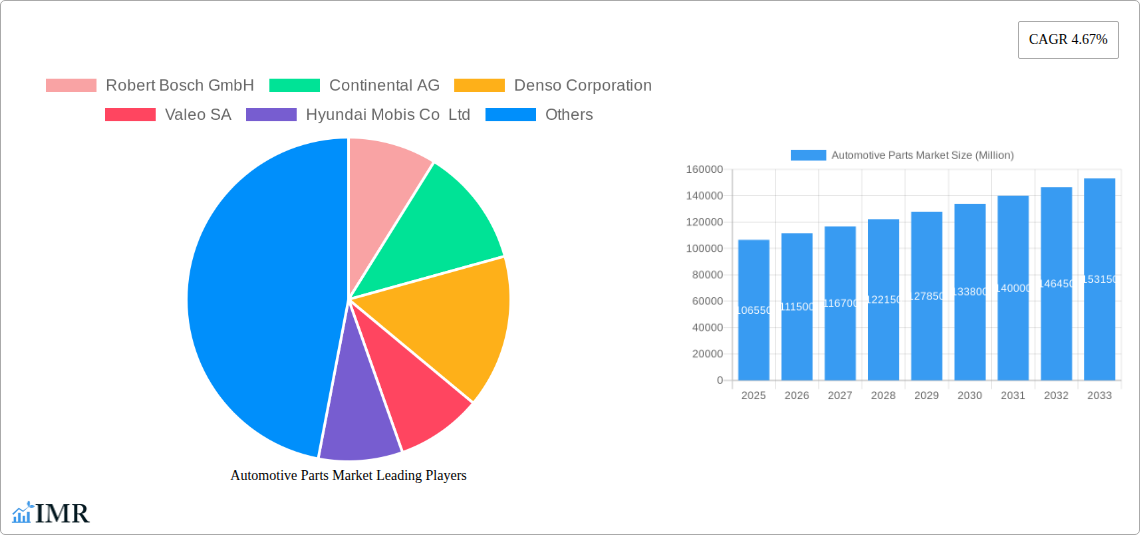
The global automotive parts market, valued at $106.55 billion in 2025, is projected to experience robust growth, driven by several key factors. The increasing demand for vehicles globally, particularly in developing economies, fuels significant market expansion. Furthermore, the rising adoption of advanced driver-assistance systems (ADAS) and electric vehicles (EVs) is creating a substantial demand for specialized components and technologies. Technological advancements in areas such as lightweight materials, improved fuel efficiency, and enhanced safety features are also contributing to market growth. The competitive landscape is characterized by established players like Robert Bosch GmbH, Continental AG, and Denso Corporation, alongside emerging companies specializing in EV components and technology. These companies are engaged in intense competition, driving innovation and price optimization within the sector.
However, the market also faces certain challenges. Fluctuations in raw material prices, particularly metals and plastics, can impact production costs and profitability. Stringent government regulations concerning emissions and safety standards necessitate continuous investment in research and development to meet evolving compliance requirements. Supply chain disruptions and geopolitical uncertainties also pose risks to the stable growth of the automotive parts market. Despite these challenges, the long-term outlook remains positive, driven by sustained vehicle production and ongoing technological advancements. The market is expected to maintain a Compound Annual Growth Rate (CAGR) of 4.67% from 2025 to 2033, indicating a substantial expansion of the market in the coming years. This growth will be further fueled by the integration of connected car technologies and the increasing focus on sustainable mobility solutions.
Automotive Parts Market: A Comprehensive Market Report (2019-2033)
This in-depth report provides a comprehensive analysis of the global Automotive Parts Market, encompassing market dynamics, growth trends, regional segmentation, product landscape, key players, and future outlook. The study period covers 2019-2033, with 2025 serving as the base and estimated year. The report offers invaluable insights for industry professionals, investors, and strategic decision-makers seeking to navigate this dynamic market. The report's parent market is the automotive industry, and the child market encompasses various automotive parts segments (detailed below). Market values are presented in million units.
Automotive Parts Market Market Dynamics & Structure
The automotive parts market is characterized by a moderately consolidated structure with several key players holding significant market share. However, the emergence of new technologies and players is increasing competition. Technological innovation, particularly in areas like electric vehicles (EVs), autonomous driving, and advanced driver-assistance systems (ADAS), is a major driver of market growth. Stringent government regulations regarding emissions and safety standards further shape market dynamics. The market also experiences competitive pressure from substitute products, such as alternative materials and manufacturing processes. End-user demographics, especially the growing demand for fuel-efficient and technologically advanced vehicles, significantly influence market trends.
- Market Concentration: The top 10 players account for approximately xx% of the global market share in 2025.
- Technological Innovation: Advancements in lightweight materials, electronics, and software are driving product innovation.
- Regulatory Framework: Emission regulations (e.g., Euro 7, CAFE standards) and safety standards are crucial factors.
- Competitive Substitutes: The rise of 3D printing and alternative material usage poses a challenge to traditional manufacturers.
- M&A Trends: The number of M&A deals in the automotive parts sector averaged xx per year during 2019-2024. This is expected to increase to xx per year during the forecast period, driven by companies seeking to expand their product portfolios and geographic reach.
Automotive Parts Market Growth Trends & Insights
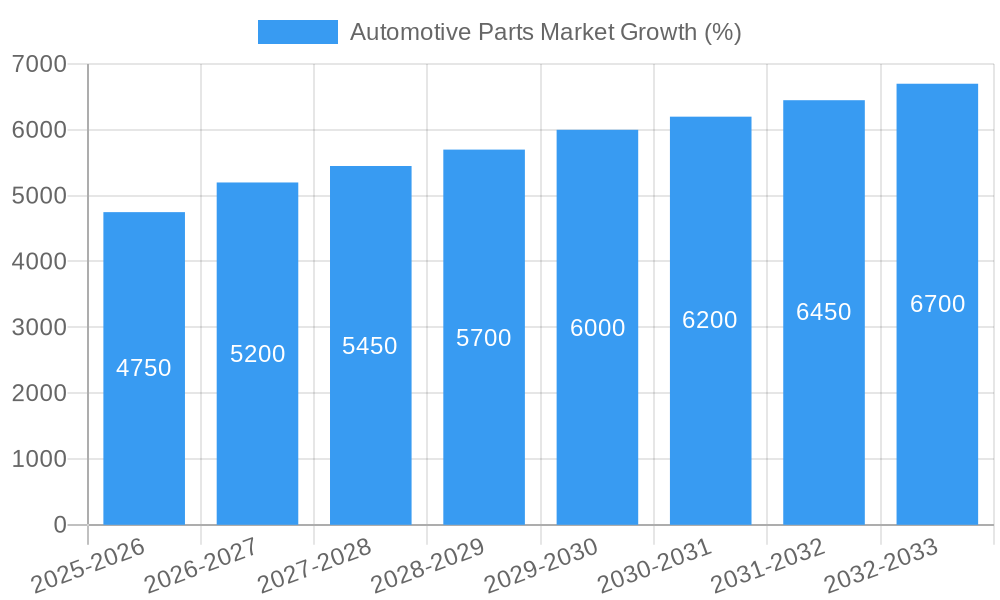
The global automotive parts market exhibited strong growth during the historical period (2019-2024), with a CAGR of xx%. This growth is attributed to factors such as increasing vehicle production, rising disposable incomes in developing economies, and technological advancements in the automotive industry. The market is expected to continue its growth trajectory during the forecast period (2025-2033), driven by the rising adoption of EVs, autonomous vehicles, and connected car technologies. The increasing demand for advanced safety features, improved fuel efficiency, and enhanced vehicle performance are also contributing factors. Consumer behavior shifts towards environmentally friendly vehicles and personalized driving experiences are significantly impacting product development and market trends. Market penetration of advanced driver-assistance systems (ADAS) is expected to reach xx% by 2033.
Dominant Regions, Countries, or Segments in Automotive Parts Market
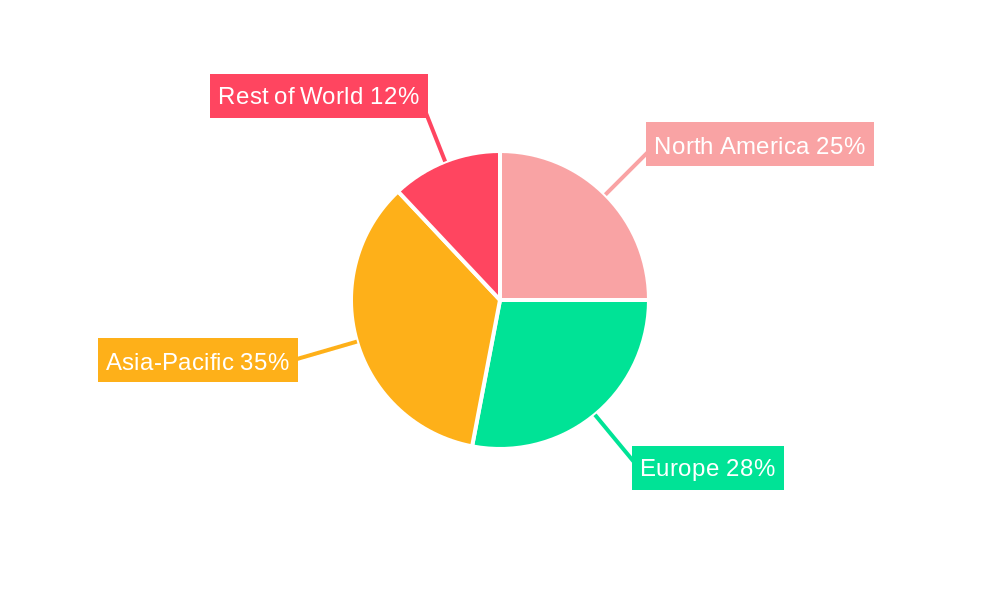
The Asia-Pacific region is projected to dominate the automotive parts market throughout the forecast period, driven primarily by robust automotive production in countries like China, Japan, India, and South Korea. Strong economic growth, expanding infrastructure, and supportive government policies in these regions are key contributing factors. The North American and European markets also hold significant shares, but the growth rate is anticipated to be lower compared to the Asia-Pacific region. Within segments, the growth of EVs is significantly driving demand for batteries, electric motors, and power electronics.
- Asia-Pacific: Strong automotive production, government initiatives, and economic growth contribute to dominance.
- North America: Large automotive market, high adoption of advanced technologies, and consumer demand for luxury vehicles.
- Europe: Stringent emission regulations and focus on sustainable transportation drive market growth.
- EV Components: Rapidly expanding segment with high growth potential due to the increasing adoption of electric vehicles.
Automotive Parts Market Product Landscape
The automotive parts market offers a wide range of products, encompassing engine components, chassis systems, body parts, electrical and electronic systems, safety systems, and aftermarket parts. Recent innovations focus on lightweighting, improved fuel efficiency, and enhanced safety features. The integration of advanced technologies such as AI, IoT, and 5G is driving the development of sophisticated and interconnected automotive parts. Unique selling propositions (USPs) include features such as improved durability, reduced emissions, enhanced safety, and cost-effectiveness.
Key Drivers, Barriers & Challenges in Automotive Parts Market
Key Drivers:
- Increasing global vehicle production
- Rising demand for technologically advanced vehicles
- Stringent government regulations pushing for safety and emission improvements
- Growing adoption of electric and autonomous vehicles
Challenges & Restraints:
- Fluctuations in raw material prices
- Supply chain disruptions
- Intense competition among established and emerging players
- High research and development costs for advanced technologies
Emerging Opportunities in Automotive Parts Market
- Growth in the aftermarket parts segment due to an aging vehicle fleet.
- Increasing demand for personalized and customized automotive parts.
- Expansion into emerging markets with growing automotive industries.
- Development of sustainable and environmentally friendly automotive parts.
Growth Accelerators in the Automotive Parts Market Industry
Technological advancements, such as the development of lightweight materials, advanced sensors, and artificial intelligence (AI)-powered systems, are significant growth catalysts. Strategic partnerships and collaborations between automotive parts manufacturers and technology companies are further accelerating innovation and market expansion.
Key Players Shaping the Automotive Parts Market Market
- Robert Bosch GmbH
- Continental AG
- Denso Corporation
- Valeo SA
- Hyundai Mobis Co Ltd
- ZF Friedrichshafen AG
- Magna International Inc
- Faurecia SE
- Lear Corporation
- CATL (Contemporary Amperex Technology Co Ltd)
- Aisin Corporation
- Aptiv Plc
- BorgWarner Inc
- Schaeffler AG
- Cummins Inc
Notable Milestones in Automotive Parts Market Sector
- November 2023: ZF Friedrichshafen AG unveils a groundbreaking electro-mechanical brake system.
- January 2024: ZF Friedrichshafen AG introduces a highly advanced Parking Electronic Control Unit (ECU).
- April 2024: BorgWarner Inc. invests USD 20.6 million in expanding its EV product manufacturing facility.
In-Depth Automotive Parts Market Market Outlook
The future of the automotive parts market is promising, with significant growth potential driven by technological advancements, increasing vehicle production, and the rise of electric and autonomous vehicles. Strategic partnerships, investments in research and development, and expansion into emerging markets will be crucial for companies seeking to capitalize on future opportunities. The market is poised for continued expansion, presenting attractive prospects for both established and emerging players.
Automotive Parts Market Segmentation
-
1. Type
- 1.1. Driveline and Powertrain
- 1.2. Interior and Exterior
- 1.3. Electrical and Electronics
- 1.4. Body and Chassis
- 1.5. Wheel and Tires
- 1.6. Other types
-
2. Propulsion
- 2.1. Internal Combustion Engine
- 2.2. Battery Electric Vehicles
- 2.3. Hybrid Electric Vehicles
- 2.4. Plug-in Hybrid Electric Vehicles
- 2.5. Fuel Cell Electric Vehicles
-
3. Vehicle Type
- 3.1. Passenger Car
- 3.2. Commercial Vehicles
-
4. Sales Channel
- 4.1. Original Equipment Manufacturers (OEM)
- 4.2. Aftermarket
Automotive Parts Market Segmentation By Geography
-
1. North America
- 1.1. United States
- 1.2. Canada
- 1.3. Rest of North America
-
2. Europe
- 2.1. Germany
- 2.2. United Kingdom
- 2.3. France
- 2.4. Italy
- 2.5. Spain
- 2.6. Rest of Europe
-
3. Asia Pacific
- 3.1. China
- 3.2. India
- 3.3. Japan
- 3.4. South Korea
- 3.5. Rest of Asia Pacific
-
4. Rest of the World
- 4.1. South America
- 4.2. Middle East and Africa
Automotive Parts Market REPORT HIGHLIGHTS
| Aspects | Details |
|---|---|
| Study Period | 2019-2033 |
| Base Year | 2024 |
| Estimated Year | 2025 |
| Forecast Period | 2025-2033 |
| Historical Period | 2019-2024 |
| Growth Rate | CAGR of 4.67% from 2019-2033 |
| Segmentation |
|
Table of Contents
- 1. Introduction
- 1.1. Research Scope
- 1.2. Market Segmentation
- 1.3. Research Methodology
- 1.4. Definitions and Assumptions
- 2. Executive Summary
- 2.1. Introduction
- 3. Market Dynamics
- 3.1. Introduction
- 3.2. Market Drivers
- 3.2.1. Rise in Vehicle Production Across the Globe
- 3.3. Market Restrains
- 3.3.1. Rise in Vehicle Production Across the Globe
- 3.4. Market Trends
- 3.4.1. Battery Electric Vehicles are Witnessing Major Growth
- 4. Market Factor Analysis
- 4.1. Porters Five Forces
- 4.2. Supply/Value Chain
- 4.3. PESTEL analysis
- 4.4. Market Entropy
- 4.5. Patent/Trademark Analysis
- 5. Global Automotive Parts Market Analysis, Insights and Forecast, 2019-2031
- 5.1. Market Analysis, Insights and Forecast - by Type
- 5.1.1. Driveline and Powertrain
- 5.1.2. Interior and Exterior
- 5.1.3. Electrical and Electronics
- 5.1.4. Body and Chassis
- 5.1.5. Wheel and Tires
- 5.1.6. Other types
- 5.2. Market Analysis, Insights and Forecast - by Propulsion
- 5.2.1. Internal Combustion Engine
- 5.2.2. Battery Electric Vehicles
- 5.2.3. Hybrid Electric Vehicles
- 5.2.4. Plug-in Hybrid Electric Vehicles
- 5.2.5. Fuel Cell Electric Vehicles
- 5.3. Market Analysis, Insights and Forecast - by Vehicle Type
- 5.3.1. Passenger Car
- 5.3.2. Commercial Vehicles
- 5.4. Market Analysis, Insights and Forecast - by Sales Channel
- 5.4.1. Original Equipment Manufacturers (OEM)
- 5.4.2. Aftermarket
- 5.5. Market Analysis, Insights and Forecast - by Region
- 5.5.1. North America
- 5.5.2. Europe
- 5.5.3. Asia Pacific
- 5.5.4. Rest of the World
- 5.1. Market Analysis, Insights and Forecast - by Type
- 6. North America Automotive Parts Market Analysis, Insights and Forecast, 2019-2031
- 6.1. Market Analysis, Insights and Forecast - by Type
- 6.1.1. Driveline and Powertrain
- 6.1.2. Interior and Exterior
- 6.1.3. Electrical and Electronics
- 6.1.4. Body and Chassis
- 6.1.5. Wheel and Tires
- 6.1.6. Other types
- 6.2. Market Analysis, Insights and Forecast - by Propulsion
- 6.2.1. Internal Combustion Engine
- 6.2.2. Battery Electric Vehicles
- 6.2.3. Hybrid Electric Vehicles
- 6.2.4. Plug-in Hybrid Electric Vehicles
- 6.2.5. Fuel Cell Electric Vehicles
- 6.3. Market Analysis, Insights and Forecast - by Vehicle Type
- 6.3.1. Passenger Car
- 6.3.2. Commercial Vehicles
- 6.4. Market Analysis, Insights and Forecast - by Sales Channel
- 6.4.1. Original Equipment Manufacturers (OEM)
- 6.4.2. Aftermarket
- 6.1. Market Analysis, Insights and Forecast - by Type
- 7. Europe Automotive Parts Market Analysis, Insights and Forecast, 2019-2031
- 7.1. Market Analysis, Insights and Forecast - by Type
- 7.1.1. Driveline and Powertrain
- 7.1.2. Interior and Exterior
- 7.1.3. Electrical and Electronics
- 7.1.4. Body and Chassis
- 7.1.5. Wheel and Tires
- 7.1.6. Other types
- 7.2. Market Analysis, Insights and Forecast - by Propulsion
- 7.2.1. Internal Combustion Engine
- 7.2.2. Battery Electric Vehicles
- 7.2.3. Hybrid Electric Vehicles
- 7.2.4. Plug-in Hybrid Electric Vehicles
- 7.2.5. Fuel Cell Electric Vehicles
- 7.3. Market Analysis, Insights and Forecast - by Vehicle Type
- 7.3.1. Passenger Car
- 7.3.2. Commercial Vehicles
- 7.4. Market Analysis, Insights and Forecast - by Sales Channel
- 7.4.1. Original Equipment Manufacturers (OEM)
- 7.4.2. Aftermarket
- 7.1. Market Analysis, Insights and Forecast - by Type
- 8. Asia Pacific Automotive Parts Market Analysis, Insights and Forecast, 2019-2031
- 8.1. Market Analysis, Insights and Forecast - by Type
- 8.1.1. Driveline and Powertrain
- 8.1.2. Interior and Exterior
- 8.1.3. Electrical and Electronics
- 8.1.4. Body and Chassis
- 8.1.5. Wheel and Tires
- 8.1.6. Other types
- 8.2. Market Analysis, Insights and Forecast - by Propulsion
- 8.2.1. Internal Combustion Engine
- 8.2.2. Battery Electric Vehicles
- 8.2.3. Hybrid Electric Vehicles
- 8.2.4. Plug-in Hybrid Electric Vehicles
- 8.2.5. Fuel Cell Electric Vehicles
- 8.3. Market Analysis, Insights and Forecast - by Vehicle Type
- 8.3.1. Passenger Car
- 8.3.2. Commercial Vehicles
- 8.4. Market Analysis, Insights and Forecast - by Sales Channel
- 8.4.1. Original Equipment Manufacturers (OEM)
- 8.4.2. Aftermarket
- 8.1. Market Analysis, Insights and Forecast - by Type
- 9. Rest of the World Automotive Parts Market Analysis, Insights and Forecast, 2019-2031
- 9.1. Market Analysis, Insights and Forecast - by Type
- 9.1.1. Driveline and Powertrain
- 9.1.2. Interior and Exterior
- 9.1.3. Electrical and Electronics
- 9.1.4. Body and Chassis
- 9.1.5. Wheel and Tires
- 9.1.6. Other types
- 9.2. Market Analysis, Insights and Forecast - by Propulsion
- 9.2.1. Internal Combustion Engine
- 9.2.2. Battery Electric Vehicles
- 9.2.3. Hybrid Electric Vehicles
- 9.2.4. Plug-in Hybrid Electric Vehicles
- 9.2.5. Fuel Cell Electric Vehicles
- 9.3. Market Analysis, Insights and Forecast - by Vehicle Type
- 9.3.1. Passenger Car
- 9.3.2. Commercial Vehicles
- 9.4. Market Analysis, Insights and Forecast - by Sales Channel
- 9.4.1. Original Equipment Manufacturers (OEM)
- 9.4.2. Aftermarket
- 9.1. Market Analysis, Insights and Forecast - by Type
- 10. Competitive Analysis
- 10.1. Global Market Share Analysis 2024
- 10.2. Company Profiles
- 10.2.1 Robert Bosch GmbH
- 10.2.1.1. Overview
- 10.2.1.2. Products
- 10.2.1.3. SWOT Analysis
- 10.2.1.4. Recent Developments
- 10.2.1.5. Financials (Based on Availability)
- 10.2.2 Continental AG
- 10.2.2.1. Overview
- 10.2.2.2. Products
- 10.2.2.3. SWOT Analysis
- 10.2.2.4. Recent Developments
- 10.2.2.5. Financials (Based on Availability)
- 10.2.3 Denso Corporation
- 10.2.3.1. Overview
- 10.2.3.2. Products
- 10.2.3.3. SWOT Analysis
- 10.2.3.4. Recent Developments
- 10.2.3.5. Financials (Based on Availability)
- 10.2.4 Valeo SA
- 10.2.4.1. Overview
- 10.2.4.2. Products
- 10.2.4.3. SWOT Analysis
- 10.2.4.4. Recent Developments
- 10.2.4.5. Financials (Based on Availability)
- 10.2.5 Hyundai Mobis Co Ltd
- 10.2.5.1. Overview
- 10.2.5.2. Products
- 10.2.5.3. SWOT Analysis
- 10.2.5.4. Recent Developments
- 10.2.5.5. Financials (Based on Availability)
- 10.2.6 ZF Friedrichshafen AG
- 10.2.6.1. Overview
- 10.2.6.2. Products
- 10.2.6.3. SWOT Analysis
- 10.2.6.4. Recent Developments
- 10.2.6.5. Financials (Based on Availability)
- 10.2.7 Magna International Inc
- 10.2.7.1. Overview
- 10.2.7.2. Products
- 10.2.7.3. SWOT Analysis
- 10.2.7.4. Recent Developments
- 10.2.7.5. Financials (Based on Availability)
- 10.2.8 Faurecia SE
- 10.2.8.1. Overview
- 10.2.8.2. Products
- 10.2.8.3. SWOT Analysis
- 10.2.8.4. Recent Developments
- 10.2.8.5. Financials (Based on Availability)
- 10.2.9 Lear Corporation
- 10.2.9.1. Overview
- 10.2.9.2. Products
- 10.2.9.3. SWOT Analysis
- 10.2.9.4. Recent Developments
- 10.2.9.5. Financials (Based on Availability)
- 10.2.10 CATL (Contemporary Amperex Technology Co Ltd)
- 10.2.10.1. Overview
- 10.2.10.2. Products
- 10.2.10.3. SWOT Analysis
- 10.2.10.4. Recent Developments
- 10.2.10.5. Financials (Based on Availability)
- 10.2.11 Aisin Corporation
- 10.2.11.1. Overview
- 10.2.11.2. Products
- 10.2.11.3. SWOT Analysis
- 10.2.11.4. Recent Developments
- 10.2.11.5. Financials (Based on Availability)
- 10.2.12 Aptiv Plc
- 10.2.12.1. Overview
- 10.2.12.2. Products
- 10.2.12.3. SWOT Analysis
- 10.2.12.4. Recent Developments
- 10.2.12.5. Financials (Based on Availability)
- 10.2.13 BorgWarner Inc
- 10.2.13.1. Overview
- 10.2.13.2. Products
- 10.2.13.3. SWOT Analysis
- 10.2.13.4. Recent Developments
- 10.2.13.5. Financials (Based on Availability)
- 10.2.14 Schaeffler AG
- 10.2.14.1. Overview
- 10.2.14.2. Products
- 10.2.14.3. SWOT Analysis
- 10.2.14.4. Recent Developments
- 10.2.14.5. Financials (Based on Availability)
- 10.2.15 Cummins Inc
- 10.2.15.1. Overview
- 10.2.15.2. Products
- 10.2.15.3. SWOT Analysis
- 10.2.15.4. Recent Developments
- 10.2.15.5. Financials (Based on Availability)
- 10.2.1 Robert Bosch GmbH
List of Figures
- Figure 1: Global Automotive Parts Market Revenue Breakdown (Million, %) by Region 2024 & 2032
- Figure 2: Global Automotive Parts Market Volume Breakdown (Billion, %) by Region 2024 & 2032
- Figure 3: North America Automotive Parts Market Revenue (Million), by Type 2024 & 2032
- Figure 4: North America Automotive Parts Market Volume (Billion), by Type 2024 & 2032
- Figure 5: North America Automotive Parts Market Revenue Share (%), by Type 2024 & 2032
- Figure 6: North America Automotive Parts Market Volume Share (%), by Type 2024 & 2032
- Figure 7: North America Automotive Parts Market Revenue (Million), by Propulsion 2024 & 2032
- Figure 8: North America Automotive Parts Market Volume (Billion), by Propulsion 2024 & 2032
- Figure 9: North America Automotive Parts Market Revenue Share (%), by Propulsion 2024 & 2032
- Figure 10: North America Automotive Parts Market Volume Share (%), by Propulsion 2024 & 2032
- Figure 11: North America Automotive Parts Market Revenue (Million), by Vehicle Type 2024 & 2032
- Figure 12: North America Automotive Parts Market Volume (Billion), by Vehicle Type 2024 & 2032
- Figure 13: North America Automotive Parts Market Revenue Share (%), by Vehicle Type 2024 & 2032
- Figure 14: North America Automotive Parts Market Volume Share (%), by Vehicle Type 2024 & 2032
- Figure 15: North America Automotive Parts Market Revenue (Million), by Sales Channel 2024 & 2032
- Figure 16: North America Automotive Parts Market Volume (Billion), by Sales Channel 2024 & 2032
- Figure 17: North America Automotive Parts Market Revenue Share (%), by Sales Channel 2024 & 2032
- Figure 18: North America Automotive Parts Market Volume Share (%), by Sales Channel 2024 & 2032
- Figure 19: North America Automotive Parts Market Revenue (Million), by Country 2024 & 2032
- Figure 20: North America Automotive Parts Market Volume (Billion), by Country 2024 & 2032
- Figure 21: North America Automotive Parts Market Revenue Share (%), by Country 2024 & 2032
- Figure 22: North America Automotive Parts Market Volume Share (%), by Country 2024 & 2032
- Figure 23: Europe Automotive Parts Market Revenue (Million), by Type 2024 & 2032
- Figure 24: Europe Automotive Parts Market Volume (Billion), by Type 2024 & 2032
- Figure 25: Europe Automotive Parts Market Revenue Share (%), by Type 2024 & 2032
- Figure 26: Europe Automotive Parts Market Volume Share (%), by Type 2024 & 2032
- Figure 27: Europe Automotive Parts Market Revenue (Million), by Propulsion 2024 & 2032
- Figure 28: Europe Automotive Parts Market Volume (Billion), by Propulsion 2024 & 2032
- Figure 29: Europe Automotive Parts Market Revenue Share (%), by Propulsion 2024 & 2032
- Figure 30: Europe Automotive Parts Market Volume Share (%), by Propulsion 2024 & 2032
- Figure 31: Europe Automotive Parts Market Revenue (Million), by Vehicle Type 2024 & 2032
- Figure 32: Europe Automotive Parts Market Volume (Billion), by Vehicle Type 2024 & 2032
- Figure 33: Europe Automotive Parts Market Revenue Share (%), by Vehicle Type 2024 & 2032
- Figure 34: Europe Automotive Parts Market Volume Share (%), by Vehicle Type 2024 & 2032
- Figure 35: Europe Automotive Parts Market Revenue (Million), by Sales Channel 2024 & 2032
- Figure 36: Europe Automotive Parts Market Volume (Billion), by Sales Channel 2024 & 2032
- Figure 37: Europe Automotive Parts Market Revenue Share (%), by Sales Channel 2024 & 2032
- Figure 38: Europe Automotive Parts Market Volume Share (%), by Sales Channel 2024 & 2032
- Figure 39: Europe Automotive Parts Market Revenue (Million), by Country 2024 & 2032
- Figure 40: Europe Automotive Parts Market Volume (Billion), by Country 2024 & 2032
- Figure 41: Europe Automotive Parts Market Revenue Share (%), by Country 2024 & 2032
- Figure 42: Europe Automotive Parts Market Volume Share (%), by Country 2024 & 2032
- Figure 43: Asia Pacific Automotive Parts Market Revenue (Million), by Type 2024 & 2032
- Figure 44: Asia Pacific Automotive Parts Market Volume (Billion), by Type 2024 & 2032
- Figure 45: Asia Pacific Automotive Parts Market Revenue Share (%), by Type 2024 & 2032
- Figure 46: Asia Pacific Automotive Parts Market Volume Share (%), by Type 2024 & 2032
- Figure 47: Asia Pacific Automotive Parts Market Revenue (Million), by Propulsion 2024 & 2032
- Figure 48: Asia Pacific Automotive Parts Market Volume (Billion), by Propulsion 2024 & 2032
- Figure 49: Asia Pacific Automotive Parts Market Revenue Share (%), by Propulsion 2024 & 2032
- Figure 50: Asia Pacific Automotive Parts Market Volume Share (%), by Propulsion 2024 & 2032
- Figure 51: Asia Pacific Automotive Parts Market Revenue (Million), by Vehicle Type 2024 & 2032
- Figure 52: Asia Pacific Automotive Parts Market Volume (Billion), by Vehicle Type 2024 & 2032
- Figure 53: Asia Pacific Automotive Parts Market Revenue Share (%), by Vehicle Type 2024 & 2032
- Figure 54: Asia Pacific Automotive Parts Market Volume Share (%), by Vehicle Type 2024 & 2032
- Figure 55: Asia Pacific Automotive Parts Market Revenue (Million), by Sales Channel 2024 & 2032
- Figure 56: Asia Pacific Automotive Parts Market Volume (Billion), by Sales Channel 2024 & 2032
- Figure 57: Asia Pacific Automotive Parts Market Revenue Share (%), by Sales Channel 2024 & 2032
- Figure 58: Asia Pacific Automotive Parts Market Volume Share (%), by Sales Channel 2024 & 2032
- Figure 59: Asia Pacific Automotive Parts Market Revenue (Million), by Country 2024 & 2032
- Figure 60: Asia Pacific Automotive Parts Market Volume (Billion), by Country 2024 & 2032
- Figure 61: Asia Pacific Automotive Parts Market Revenue Share (%), by Country 2024 & 2032
- Figure 62: Asia Pacific Automotive Parts Market Volume Share (%), by Country 2024 & 2032
- Figure 63: Rest of the World Automotive Parts Market Revenue (Million), by Type 2024 & 2032
- Figure 64: Rest of the World Automotive Parts Market Volume (Billion), by Type 2024 & 2032
- Figure 65: Rest of the World Automotive Parts Market Revenue Share (%), by Type 2024 & 2032
- Figure 66: Rest of the World Automotive Parts Market Volume Share (%), by Type 2024 & 2032
- Figure 67: Rest of the World Automotive Parts Market Revenue (Million), by Propulsion 2024 & 2032
- Figure 68: Rest of the World Automotive Parts Market Volume (Billion), by Propulsion 2024 & 2032
- Figure 69: Rest of the World Automotive Parts Market Revenue Share (%), by Propulsion 2024 & 2032
- Figure 70: Rest of the World Automotive Parts Market Volume Share (%), by Propulsion 2024 & 2032
- Figure 71: Rest of the World Automotive Parts Market Revenue (Million), by Vehicle Type 2024 & 2032
- Figure 72: Rest of the World Automotive Parts Market Volume (Billion), by Vehicle Type 2024 & 2032
- Figure 73: Rest of the World Automotive Parts Market Revenue Share (%), by Vehicle Type 2024 & 2032
- Figure 74: Rest of the World Automotive Parts Market Volume Share (%), by Vehicle Type 2024 & 2032
- Figure 75: Rest of the World Automotive Parts Market Revenue (Million), by Sales Channel 2024 & 2032
- Figure 76: Rest of the World Automotive Parts Market Volume (Billion), by Sales Channel 2024 & 2032
- Figure 77: Rest of the World Automotive Parts Market Revenue Share (%), by Sales Channel 2024 & 2032
- Figure 78: Rest of the World Automotive Parts Market Volume Share (%), by Sales Channel 2024 & 2032
- Figure 79: Rest of the World Automotive Parts Market Revenue (Million), by Country 2024 & 2032
- Figure 80: Rest of the World Automotive Parts Market Volume (Billion), by Country 2024 & 2032
- Figure 81: Rest of the World Automotive Parts Market Revenue Share (%), by Country 2024 & 2032
- Figure 82: Rest of the World Automotive Parts Market Volume Share (%), by Country 2024 & 2032
List of Tables
- Table 1: Global Automotive Parts Market Revenue Million Forecast, by Region 2019 & 2032
- Table 2: Global Automotive Parts Market Volume Billion Forecast, by Region 2019 & 2032
- Table 3: Global Automotive Parts Market Revenue Million Forecast, by Type 2019 & 2032
- Table 4: Global Automotive Parts Market Volume Billion Forecast, by Type 2019 & 2032
- Table 5: Global Automotive Parts Market Revenue Million Forecast, by Propulsion 2019 & 2032
- Table 6: Global Automotive Parts Market Volume Billion Forecast, by Propulsion 2019 & 2032
- Table 7: Global Automotive Parts Market Revenue Million Forecast, by Vehicle Type 2019 & 2032
- Table 8: Global Automotive Parts Market Volume Billion Forecast, by Vehicle Type 2019 & 2032
- Table 9: Global Automotive Parts Market Revenue Million Forecast, by Sales Channel 2019 & 2032
- Table 10: Global Automotive Parts Market Volume Billion Forecast, by Sales Channel 2019 & 2032
- Table 11: Global Automotive Parts Market Revenue Million Forecast, by Region 2019 & 2032
- Table 12: Global Automotive Parts Market Volume Billion Forecast, by Region 2019 & 2032
- Table 13: Global Automotive Parts Market Revenue Million Forecast, by Type 2019 & 2032
- Table 14: Global Automotive Parts Market Volume Billion Forecast, by Type 2019 & 2032
- Table 15: Global Automotive Parts Market Revenue Million Forecast, by Propulsion 2019 & 2032
- Table 16: Global Automotive Parts Market Volume Billion Forecast, by Propulsion 2019 & 2032
- Table 17: Global Automotive Parts Market Revenue Million Forecast, by Vehicle Type 2019 & 2032
- Table 18: Global Automotive Parts Market Volume Billion Forecast, by Vehicle Type 2019 & 2032
- Table 19: Global Automotive Parts Market Revenue Million Forecast, by Sales Channel 2019 & 2032
- Table 20: Global Automotive Parts Market Volume Billion Forecast, by Sales Channel 2019 & 2032
- Table 21: Global Automotive Parts Market Revenue Million Forecast, by Country 2019 & 2032
- Table 22: Global Automotive Parts Market Volume Billion Forecast, by Country 2019 & 2032
- Table 23: United States Automotive Parts Market Revenue (Million) Forecast, by Application 2019 & 2032
- Table 24: United States Automotive Parts Market Volume (Billion) Forecast, by Application 2019 & 2032
- Table 25: Canada Automotive Parts Market Revenue (Million) Forecast, by Application 2019 & 2032
- Table 26: Canada Automotive Parts Market Volume (Billion) Forecast, by Application 2019 & 2032
- Table 27: Rest of North America Automotive Parts Market Revenue (Million) Forecast, by Application 2019 & 2032
- Table 28: Rest of North America Automotive Parts Market Volume (Billion) Forecast, by Application 2019 & 2032
- Table 29: Global Automotive Parts Market Revenue Million Forecast, by Type 2019 & 2032
- Table 30: Global Automotive Parts Market Volume Billion Forecast, by Type 2019 & 2032
- Table 31: Global Automotive Parts Market Revenue Million Forecast, by Propulsion 2019 & 2032
- Table 32: Global Automotive Parts Market Volume Billion Forecast, by Propulsion 2019 & 2032
- Table 33: Global Automotive Parts Market Revenue Million Forecast, by Vehicle Type 2019 & 2032
- Table 34: Global Automotive Parts Market Volume Billion Forecast, by Vehicle Type 2019 & 2032
- Table 35: Global Automotive Parts Market Revenue Million Forecast, by Sales Channel 2019 & 2032
- Table 36: Global Automotive Parts Market Volume Billion Forecast, by Sales Channel 2019 & 2032
- Table 37: Global Automotive Parts Market Revenue Million Forecast, by Country 2019 & 2032
- Table 38: Global Automotive Parts Market Volume Billion Forecast, by Country 2019 & 2032
- Table 39: Germany Automotive Parts Market Revenue (Million) Forecast, by Application 2019 & 2032
- Table 40: Germany Automotive Parts Market Volume (Billion) Forecast, by Application 2019 & 2032
- Table 41: United Kingdom Automotive Parts Market Revenue (Million) Forecast, by Application 2019 & 2032
- Table 42: United Kingdom Automotive Parts Market Volume (Billion) Forecast, by Application 2019 & 2032
- Table 43: France Automotive Parts Market Revenue (Million) Forecast, by Application 2019 & 2032
- Table 44: France Automotive Parts Market Volume (Billion) Forecast, by Application 2019 & 2032
- Table 45: Italy Automotive Parts Market Revenue (Million) Forecast, by Application 2019 & 2032
- Table 46: Italy Automotive Parts Market Volume (Billion) Forecast, by Application 2019 & 2032
- Table 47: Spain Automotive Parts Market Revenue (Million) Forecast, by Application 2019 & 2032
- Table 48: Spain Automotive Parts Market Volume (Billion) Forecast, by Application 2019 & 2032
- Table 49: Rest of Europe Automotive Parts Market Revenue (Million) Forecast, by Application 2019 & 2032
- Table 50: Rest of Europe Automotive Parts Market Volume (Billion) Forecast, by Application 2019 & 2032
- Table 51: Global Automotive Parts Market Revenue Million Forecast, by Type 2019 & 2032
- Table 52: Global Automotive Parts Market Volume Billion Forecast, by Type 2019 & 2032
- Table 53: Global Automotive Parts Market Revenue Million Forecast, by Propulsion 2019 & 2032
- Table 54: Global Automotive Parts Market Volume Billion Forecast, by Propulsion 2019 & 2032
- Table 55: Global Automotive Parts Market Revenue Million Forecast, by Vehicle Type 2019 & 2032
- Table 56: Global Automotive Parts Market Volume Billion Forecast, by Vehicle Type 2019 & 2032
- Table 57: Global Automotive Parts Market Revenue Million Forecast, by Sales Channel 2019 & 2032
- Table 58: Global Automotive Parts Market Volume Billion Forecast, by Sales Channel 2019 & 2032
- Table 59: Global Automotive Parts Market Revenue Million Forecast, by Country 2019 & 2032
- Table 60: Global Automotive Parts Market Volume Billion Forecast, by Country 2019 & 2032
- Table 61: China Automotive Parts Market Revenue (Million) Forecast, by Application 2019 & 2032
- Table 62: China Automotive Parts Market Volume (Billion) Forecast, by Application 2019 & 2032
- Table 63: India Automotive Parts Market Revenue (Million) Forecast, by Application 2019 & 2032
- Table 64: India Automotive Parts Market Volume (Billion) Forecast, by Application 2019 & 2032
- Table 65: Japan Automotive Parts Market Revenue (Million) Forecast, by Application 2019 & 2032
- Table 66: Japan Automotive Parts Market Volume (Billion) Forecast, by Application 2019 & 2032
- Table 67: South Korea Automotive Parts Market Revenue (Million) Forecast, by Application 2019 & 2032
- Table 68: South Korea Automotive Parts Market Volume (Billion) Forecast, by Application 2019 & 2032
- Table 69: Rest of Asia Pacific Automotive Parts Market Revenue (Million) Forecast, by Application 2019 & 2032
- Table 70: Rest of Asia Pacific Automotive Parts Market Volume (Billion) Forecast, by Application 2019 & 2032
- Table 71: Global Automotive Parts Market Revenue Million Forecast, by Type 2019 & 2032
- Table 72: Global Automotive Parts Market Volume Billion Forecast, by Type 2019 & 2032
- Table 73: Global Automotive Parts Market Revenue Million Forecast, by Propulsion 2019 & 2032
- Table 74: Global Automotive Parts Market Volume Billion Forecast, by Propulsion 2019 & 2032
- Table 75: Global Automotive Parts Market Revenue Million Forecast, by Vehicle Type 2019 & 2032
- Table 76: Global Automotive Parts Market Volume Billion Forecast, by Vehicle Type 2019 & 2032
- Table 77: Global Automotive Parts Market Revenue Million Forecast, by Sales Channel 2019 & 2032
- Table 78: Global Automotive Parts Market Volume Billion Forecast, by Sales Channel 2019 & 2032
- Table 79: Global Automotive Parts Market Revenue Million Forecast, by Country 2019 & 2032
- Table 80: Global Automotive Parts Market Volume Billion Forecast, by Country 2019 & 2032
- Table 81: South America Automotive Parts Market Revenue (Million) Forecast, by Application 2019 & 2032
- Table 82: South America Automotive Parts Market Volume (Billion) Forecast, by Application 2019 & 2032
- Table 83: Middle East and Africa Automotive Parts Market Revenue (Million) Forecast, by Application 2019 & 2032
- Table 84: Middle East and Africa Automotive Parts Market Volume (Billion) Forecast, by Application 2019 & 2032
Frequently Asked Questions
1. What is the projected Compound Annual Growth Rate (CAGR) of the Automotive Parts Market?
The projected CAGR is approximately 4.67%.
2. Which companies are prominent players in the Automotive Parts Market?
Key companies in the market include Robert Bosch GmbH, Continental AG, Denso Corporation, Valeo SA, Hyundai Mobis Co Ltd, ZF Friedrichshafen AG, Magna International Inc, Faurecia SE, Lear Corporation, CATL (Contemporary Amperex Technology Co Ltd), Aisin Corporation, Aptiv Plc, BorgWarner Inc, Schaeffler AG, Cummins Inc.
3. What are the main segments of the Automotive Parts Market?
The market segments include Type, Propulsion, Vehicle Type, Sales Channel.
4. Can you provide details about the market size?
The market size is estimated to be USD 106.55 Million as of 2022.
5. What are some drivers contributing to market growth?
Rise in Vehicle Production Across the Globe.
6. What are the notable trends driving market growth?
Battery Electric Vehicles are Witnessing Major Growth.
7. Are there any restraints impacting market growth?
Rise in Vehicle Production Across the Globe.
8. Can you provide examples of recent developments in the market?
April 2024: BorgWarner Inc. invested USD 20.6 million for the expansion of an electric vehicle product manufacturing facility in the United States. With this investment, the company has expanded its development and testing of EV products, including battery modules, battery packs, and DC fast chargers. It has also scaled up its manufacturing operations for DC fast chargers.
9. What pricing options are available for accessing the report?
Pricing options include single-user, multi-user, and enterprise licenses priced at USD 4750, USD 5250, and USD 8750 respectively.
10. Is the market size provided in terms of value or volume?
The market size is provided in terms of value, measured in Million and volume, measured in Billion.
11. Are there any specific market keywords associated with the report?
Yes, the market keyword associated with the report is "Automotive Parts Market," which aids in identifying and referencing the specific market segment covered.
12. How do I determine which pricing option suits my needs best?
The pricing options vary based on user requirements and access needs. Individual users may opt for single-user licenses, while businesses requiring broader access may choose multi-user or enterprise licenses for cost-effective access to the report.
13. Are there any additional resources or data provided in the Automotive Parts Market report?
While the report offers comprehensive insights, it's advisable to review the specific contents or supplementary materials provided to ascertain if additional resources or data are available.
14. How can I stay updated on further developments or reports in the Automotive Parts Market?
To stay informed about further developments, trends, and reports in the Automotive Parts Market, consider subscribing to industry newsletters, following relevant companies and organizations, or regularly checking reputable industry news sources and publications.
Methodology
Step 1 - Identification of Relevant Samples Size from Population Database


Step 2 - Approaches for Defining Global Market Size (Value, Volume* & Price*)

Note*: In applicable scenarios
Step 3 - Data Sources
Primary Research
- Web Analytics
- Survey Reports
- Research Institute
- Latest Research Reports
- Opinion Leaders
Secondary Research
- Annual Reports
- White Paper
- Latest Press Release
- Industry Association
- Paid Database
- Investor Presentations

Step 4 - Data Triangulation
Involves using different sources of information in order to increase the validity of a study
These sources are likely to be stakeholders in a program - participants, other researchers, program staff, other community members, and so on.
Then we put all data in single framework & apply various statistical tools to find out the dynamic on the market.
During the analysis stage, feedback from the stakeholder groups would be compared to determine areas of agreement as well as areas of divergence
