

Key Insights
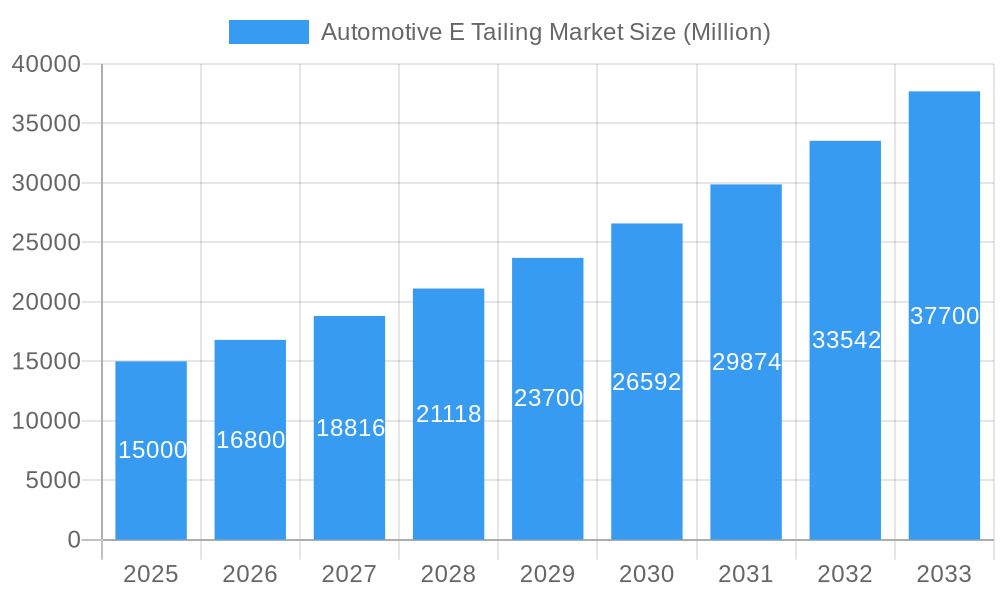
The Automotive E-tailing market is poised for substantial expansion, projected to reach $17.1 billion by 2025, demonstrating a compelling Compound Annual Growth Rate (CAGR) of 14.2%. This robust growth is primarily attributed to the escalating adoption of online purchasing, particularly among younger demographics. Key growth drivers include the unparalleled convenience and accessibility of digital platforms, competitive pricing, an extensive product selection surpassing traditional retail, and the pervasive global expansion of smartphone and internet accessibility. The market is segmented by component type (electrical, infotainment, engine, tires & wheels, others), vehicle type (passenger cars, commercial vehicles, two-wheelers), and vendor type (OEM, third-party). Regional market share is expected to be led by North America and Europe, owing to established e-commerce infrastructures and prevalent consumer behaviors. However, the Asia-Pacific region presents significant future growth potential, fueled by increasing internet penetration and rising disposable incomes, notably in India and China. Despite challenges such as concerns regarding product authenticity and the imperative for efficient logistics, the market outlook remains highly optimistic, driven by ongoing technological advancements and evolving consumer demands.
Automotive E Tailing Market Market Size (In Billion)
The competitive arena features a diverse range of players, from e-commerce behemoths like Amazon and Alibaba to specialized automotive parts retailers such as Advance Auto Parts and AutoZone, alongside OEMs actively developing their online sales channels. This intense competition fosters continuous innovation in user experience, personalized recommendations, and customer service enhancements. Furthermore, the integration of advanced technologies like Artificial Intelligence (AI) and Big Data analytics is revolutionizing the market through tailored product suggestions, optimized inventory management, and streamlined supply chains. Sustained investment in these technological frontiers, coupled with the expansion of e-commerce infrastructure in emerging markets, will ensure the continued upward trajectory of the automotive e-tailing market, creating significant opportunities for both established enterprises and new entrants.
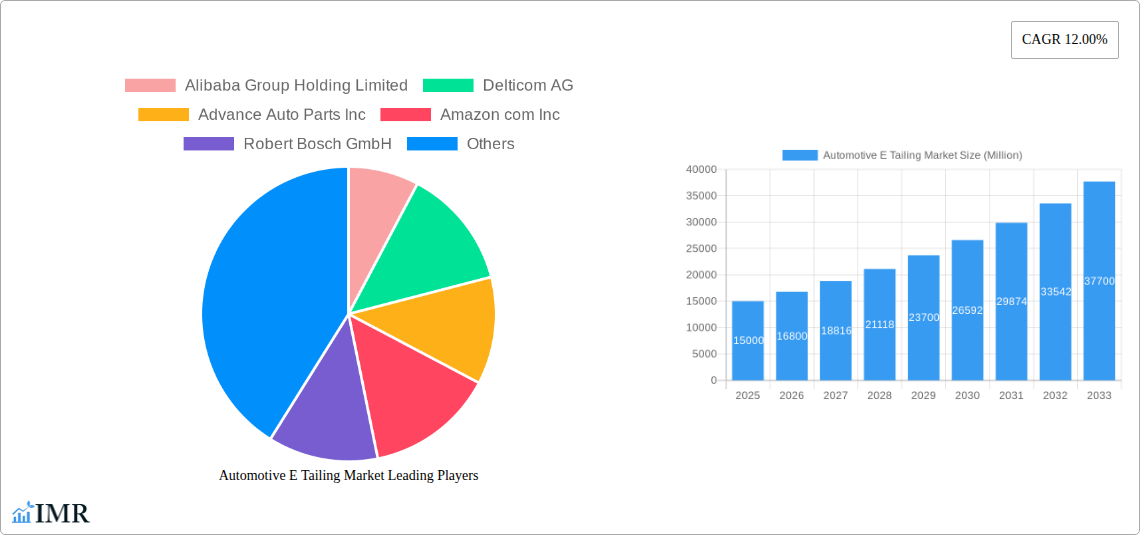
Automotive E Tailing Market Company Market Share
Automotive E-Tailing Market: A Comprehensive Report (2019-2033)
This comprehensive report provides an in-depth analysis of the Automotive E-Tailing market, encompassing market dynamics, growth trends, regional dominance, product landscape, key players, and future outlook. The study period covers 2019-2033, with 2025 as the base and estimated year. The report segments the market by component type (electrical components, infotainment & multimedia, engine components, tires & wheels, other component types), vehicle type (passenger cars, commercial vehicles, two-wheelers), and vendor type (OEM, third-party). The market size is presented in million units.
Automotive E-Tailing Market Market Dynamics & Structure
The automotive e-tailing market exhibits a moderately concentrated structure, with major players like Alibaba Group Holding Limited, Amazon.com Inc, and Walmart Inc commanding significant market share. However, the market is also characterized by the presence of numerous smaller, specialized e-tailers catering to niche segments. Technological innovation, particularly in areas like online inventory management, augmented reality for parts identification, and personalized recommendations, significantly influences market growth. Stringent regulatory frameworks concerning data privacy and product safety impact market operations. The rise of direct-to-consumer (DTC) sales models and alternative online marketplaces presents competitive pressures to established players.
- Market Concentration: Moderate, with a few dominant players and many niche players.
- Technological Drivers: Online inventory management, AR for parts identification, personalized recommendations.
- Regulatory Landscape: Data privacy, product safety regulations impacting operations.
- Competitive Substitutes: DTC models, alternative online marketplaces.
- End-User Demographics: Shift towards online purchasing among younger demographics.
- M&A Activity: xx M&A deals in the last 5 years (estimated).
Automotive E-Tailing Market Growth Trends & Insights
The automotive e-tailing market experienced substantial growth during the historical period (2019-2024), driven by increasing internet penetration, rising smartphone adoption, and the convenience offered by online shopping. The market size is estimated at xx million units in 2025, projected to reach xx million units by 2033, exhibiting a CAGR of xx% during the forecast period (2025-2033). The adoption rate of online automotive parts purchasing is increasing steadily, particularly among younger consumers. Technological disruptions, such as the integration of AI-powered chatbots for customer service and the use of blockchain technology for supply chain transparency, are shaping market dynamics. Consumers are increasingly favoring online platforms for ease of comparison, competitive pricing, and 24/7 availability.
Dominant Regions, Countries, or Segments in Automotive E-Tailing Market
The North American market holds a significant share, driven by high vehicle ownership rates, strong e-commerce infrastructure, and the presence of established players like Advance Auto Parts and AutoZone. Within component types, the electrical components segment dominates due to increasing electronic content in vehicles. Passenger cars represent the largest vehicle type segment, benefiting from higher demand and a broader range of available parts. Third-party vendors are gaining market share owing to their competitive pricing and wider selection.
- Key Drivers (North America): High vehicle ownership, robust e-commerce infrastructure, established players.
- Key Drivers (Electrical Components): Increasing vehicle electronic content.
- Key Drivers (Passenger Cars): High demand, wider part selection.
- Key Drivers (Third-Party Vendors): Competitive pricing, wider selection.
- Growth Potential: Significant growth potential in emerging markets with rising vehicle ownership and expanding internet access.
Automotive E-Tailing Market Product Landscape
The automotive e-tailing market offers a diverse range of products, from individual components to complete kits. Products are increasingly categorized and searchable by vehicle make, model, and year, enhancing customer convenience. Advancements include real-time inventory tracking, enhanced product visualization tools (e.g., 3D models), and integrated diagnostic tools for improved customer service. Many e-tailers offer value-added services like DIY installation guides and virtual consultations.
Key Drivers, Barriers & Challenges in Automotive E-Tailing Market
Key Drivers: Increasing online shopping preference, rising vehicle ownership in emerging markets, technological advancements (AI, AR, VR), and strategic partnerships between e-tailers and automotive manufacturers.
Key Barriers & Challenges: Maintaining inventory accuracy, managing complex supply chains, ensuring product authenticity, overcoming concerns about data security, and navigating stringent regulatory requirements. Logistics challenges, particularly for larger or heavier parts, and the need for effective customer service to address complex technical issues also present significant hurdles. Competitive pricing pressure is impacting profit margins.
Emerging Opportunities in Automotive E-Tailing Market
The market presents opportunities in expanding into underserved regions, offering specialized parts for electric vehicles (EVs), developing personalized maintenance scheduling apps, and creating virtual reality (VR) experiences for DIY repairs. Targeting specific vehicle makes or models with niche part offerings, and implementing advanced analytics to enhance customer experience, are additional areas ripe for growth.
Growth Accelerators in the Automotive E-Tailing Market Industry
Technological innovations like AI-powered recommendation engines, personalized customer service, and the use of blockchain for secure transactions are key catalysts for long-term growth. Strategic partnerships between e-tailers and automakers can provide access to broader customer bases and enhance brand recognition. Expanding into new geographic markets, particularly developing economies with rising vehicle ownership rates, presents significant opportunities for market expansion.
Key Players Shaping the Automotive E-Tailing Market Market
- Alibaba Group Holding Limited
- Delticom AG
- Advance Auto Parts Inc
- Amazon.com Inc
- Robert Bosch GmbH
- AutoZone Inc
- Flipkart
- eBay Inc
- O'Reilly Automotive Inc
- Walmart Inc
Notable Milestones in Automotive E-Tailing Market Sector
- February 2021: CarParts.com partnered with McDowell and Front Row Motorsports (FRM) for marketing initiatives.
- February 2021: Advance Auto Parts partnered with NASCAR and Team Penske for brand promotion.
- November 2021: Advance Auto Parts launched Carquest by Advance, targeting DIY automotive repair.
- December 2021: Alibaba Group Holding Ltd reorganized its e-commerce businesses for enhanced agility and growth.
In-Depth Automotive E-Tailing Market Market Outlook
The automotive e-tailing market is poised for significant growth in the coming years, driven by sustained technological advancements, strategic partnerships, and expanding global reach. The increasing adoption of EVs and the need for specialized parts presents a major opportunity. Further market penetration in emerging economies and the ongoing development of innovative business models will further fuel market expansion. Companies that effectively leverage data analytics and personalize customer experiences are well-positioned to capture significant market share.
Automotive E Tailing Market Segmentation
-
1. Component Type
- 1.1. Electrical Components
- 1.2. Infotainment and Multimedia
- 1.3. Engine Components
- 1.4. Tires and Wheel
- 1.5. Other Component Types
-
2. Vehicle Type
- 2.1. Passenger Cars
- 2.2. Commercial Vehicles
- 2.3. Two-wheelers
-
3. Vendor Type
- 3.1. OEM
- 3.2. Third-party Vendor
Automotive E Tailing Market Segmentation By Geography
-
1. North America
- 1.1. United States
- 1.2. Canada
- 1.3. Rest of North America
-
2. Europe
- 2.1. Germany
- 2.2. United Kingdom
- 2.3. France
- 2.4. Italy
- 2.5. Rest of Europe
-
3. Asia Pacific
- 3.1. India
- 3.2. China
- 3.3. Japan
- 3.4. South Korea
- 3.5. Rest of Asia Pacific
-
4. Rest of the World
- 4.1. South America
- 4.2. Middle East and Africa
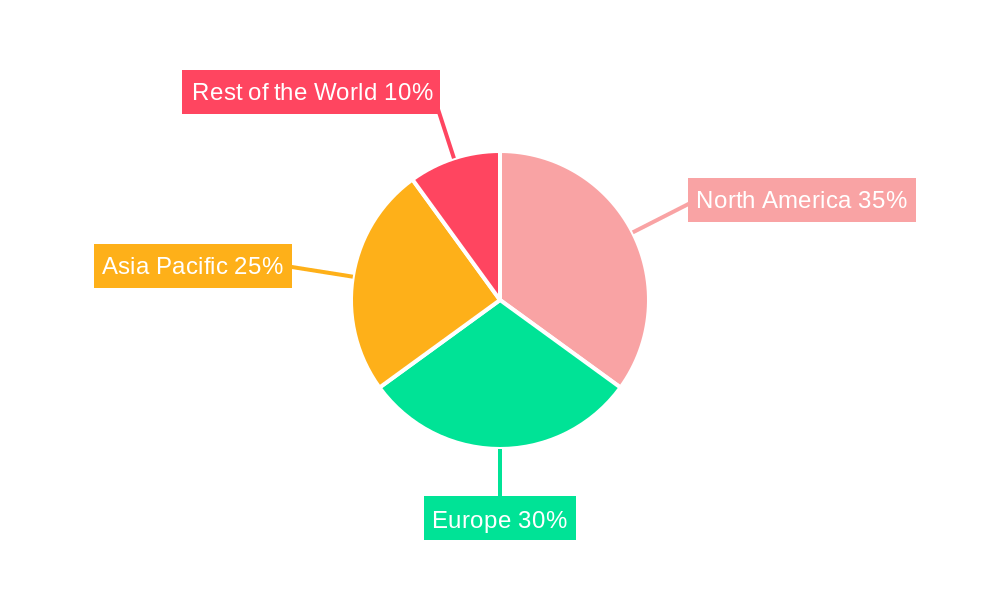
Automotive E Tailing Market Regional Market Share
Geographic Coverage of Automotive E Tailing Market
Automotive E Tailing Market REPORT HIGHLIGHTS
| Aspects | Details |
|---|---|
| Study Period | 2020-2034 |
| Base Year | 2025 |
| Estimated Year | 2026 |
| Forecast Period | 2026-2034 |
| Historical Period | 2020-2025 |
| Growth Rate | CAGR of 14.2% from 2020-2034 |
| Segmentation |
|
Table of Contents
- 1. Introduction
- 1.1. Research Scope
- 1.2. Market Segmentation
- 1.3. Research Objective
- 1.4. Definitions and Assumptions
- 2. Executive Summary
- 2.1. Market Snapshot
- 3. Market Dynamics
- 3.1. Market Drivers
- 3.2. Market Restrains
- 3.3. Market Trends
- 3.4. Market Opportunities
- 4. Market Factor Analysis
- 4.1. Porters Five Forces
- 4.1.1. Bargaining Power of Suppliers
- 4.1.2. Bargaining Power of Buyers
- 4.1.3. Threat of New Entrants
- 4.1.4. Threat of Substitutes
- 4.1.5. Competitive Rivalry
- 4.2. PESTEL analysis
- 4.3. BCG Analysis
- 4.3.1. Stars (High Growth, High Market Share)
- 4.3.2. Cash Cows (Low Growth, High Market Share)
- 4.3.3. Question Mark (High Growth, Low Market Share)
- 4.3.4. Dogs (Low Growth, Low Market Share)
- 4.4. Ansoff Matrix Analysis
- 4.5. Supply Chain Analysis
- 4.6. Regulatory Landscape
- 4.7. Current Market Potential and Opportunity Assessment (TAM–SAM–SOM Framework)
- 4.8. IMR Analyst Note
- 4.1. Porters Five Forces
- 5. Market Analysis, Insights and Forecast 2021-2033
- 5.1. Market Analysis, Insights and Forecast - by Component Type
- 5.1.1. Electrical Components
- 5.1.2. Infotainment and Multimedia
- 5.1.3. Engine Components
- 5.1.4. Tires and Wheel
- 5.1.5. Other Component Types
- 5.2. Market Analysis, Insights and Forecast - by Vehicle Type
- 5.2.1. Passenger Cars
- 5.2.2. Commercial Vehicles
- 5.2.3. Two-wheelers
- 5.3. Market Analysis, Insights and Forecast - by Vendor Type
- 5.3.1. OEM
- 5.3.2. Third-party Vendor
- 5.4. Market Analysis, Insights and Forecast - by Region
- 5.4.1. North America
- 5.4.2. Europe
- 5.4.3. Asia Pacific
- 5.4.4. Rest of the World
- 5.1. Market Analysis, Insights and Forecast - by Component Type
- 6. Global Automotive E Tailing Market Analysis, Insights and Forecast, 2021-2033
- 6.1. Market Analysis, Insights and Forecast - by Component Type
- 6.1.1. Electrical Components
- 6.1.2. Infotainment and Multimedia
- 6.1.3. Engine Components
- 6.1.4. Tires and Wheel
- 6.1.5. Other Component Types
- 6.2. Market Analysis, Insights and Forecast - by Vehicle Type
- 6.2.1. Passenger Cars
- 6.2.2. Commercial Vehicles
- 6.2.3. Two-wheelers
- 6.3. Market Analysis, Insights and Forecast - by Vendor Type
- 6.3.1. OEM
- 6.3.2. Third-party Vendor
- 6.1. Market Analysis, Insights and Forecast - by Component Type
- 7. North America Automotive E Tailing Market Analysis, Insights and Forecast, 2020-2032
- 7.1. Market Analysis, Insights and Forecast - by Component Type
- 7.1.1. Electrical Components
- 7.1.2. Infotainment and Multimedia
- 7.1.3. Engine Components
- 7.1.4. Tires and Wheel
- 7.1.5. Other Component Types
- 7.2. Market Analysis, Insights and Forecast - by Vehicle Type
- 7.2.1. Passenger Cars
- 7.2.2. Commercial Vehicles
- 7.2.3. Two-wheelers
- 7.3. Market Analysis, Insights and Forecast - by Vendor Type
- 7.3.1. OEM
- 7.3.2. Third-party Vendor
- 7.1. Market Analysis, Insights and Forecast - by Component Type
- 8. Europe Automotive E Tailing Market Analysis, Insights and Forecast, 2020-2032
- 8.1. Market Analysis, Insights and Forecast - by Component Type
- 8.1.1. Electrical Components
- 8.1.2. Infotainment and Multimedia
- 8.1.3. Engine Components
- 8.1.4. Tires and Wheel
- 8.1.5. Other Component Types
- 8.2. Market Analysis, Insights and Forecast - by Vehicle Type
- 8.2.1. Passenger Cars
- 8.2.2. Commercial Vehicles
- 8.2.3. Two-wheelers
- 8.3. Market Analysis, Insights and Forecast - by Vendor Type
- 8.3.1. OEM
- 8.3.2. Third-party Vendor
- 8.1. Market Analysis, Insights and Forecast - by Component Type
- 9. Asia Pacific Automotive E Tailing Market Analysis, Insights and Forecast, 2020-2032
- 9.1. Market Analysis, Insights and Forecast - by Component Type
- 9.1.1. Electrical Components
- 9.1.2. Infotainment and Multimedia
- 9.1.3. Engine Components
- 9.1.4. Tires and Wheel
- 9.1.5. Other Component Types
- 9.2. Market Analysis, Insights and Forecast - by Vehicle Type
- 9.2.1. Passenger Cars
- 9.2.2. Commercial Vehicles
- 9.2.3. Two-wheelers
- 9.3. Market Analysis, Insights and Forecast - by Vendor Type
- 9.3.1. OEM
- 9.3.2. Third-party Vendor
- 9.1. Market Analysis, Insights and Forecast - by Component Type
- 10. Rest of the World Automotive E Tailing Market Analysis, Insights and Forecast, 2020-2032
- 10.1. Market Analysis, Insights and Forecast - by Component Type
- 10.1.1. Electrical Components
- 10.1.2. Infotainment and Multimedia
- 10.1.3. Engine Components
- 10.1.4. Tires and Wheel
- 10.1.5. Other Component Types
- 10.2. Market Analysis, Insights and Forecast - by Vehicle Type
- 10.2.1. Passenger Cars
- 10.2.2. Commercial Vehicles
- 10.2.3. Two-wheelers
- 10.3. Market Analysis, Insights and Forecast - by Vendor Type
- 10.3.1. OEM
- 10.3.2. Third-party Vendor
- 10.1. Market Analysis, Insights and Forecast - by Component Type
- 11. Competitive Analysis
- 11.1. Company Profiles
- 11.1.1 Alibaba Group Holding Limited
- 11.1.1.1. Company Overview
- 11.1.1.2. Products
- 11.1.1.3. Company Financials
- 11.1.1.4. SWOT Analysis
- 11.1.2 Delticom AG
- 11.1.2.1. Company Overview
- 11.1.2.2. Products
- 11.1.2.3. Company Financials
- 11.1.2.4. SWOT Analysis
- 11.1.3 Advance Auto Parts Inc
- 11.1.3.1. Company Overview
- 11.1.3.2. Products
- 11.1.3.3. Company Financials
- 11.1.3.4. SWOT Analysis
- 11.1.4 Amazon com Inc
- 11.1.4.1. Company Overview
- 11.1.4.2. Products
- 11.1.4.3. Company Financials
- 11.1.4.4. SWOT Analysis
- 11.1.5 Robert Bosch GmbH
- 11.1.5.1. Company Overview
- 11.1.5.2. Products
- 11.1.5.3. Company Financials
- 11.1.5.4. SWOT Analysis
- 11.1.6 AutoZone Inc
- 11.1.6.1. Company Overview
- 11.1.6.2. Products
- 11.1.6.3. Company Financials
- 11.1.6.4. SWOT Analysis
- 11.1.7 Flipkart*List Not Exhaustive
- 11.1.7.1. Company Overview
- 11.1.7.2. Products
- 11.1.7.3. Company Financials
- 11.1.7.4. SWOT Analysis
- 11.1.8 eBay Inc
- 11.1.8.1. Company Overview
- 11.1.8.2. Products
- 11.1.8.3. Company Financials
- 11.1.8.4. SWOT Analysis
- 11.1.9 O'reilly Automotive Inc
- 11.1.9.1. Company Overview
- 11.1.9.2. Products
- 11.1.9.3. Company Financials
- 11.1.9.4. SWOT Analysis
- 11.1.10 Walmart Inc
- 11.1.10.1. Company Overview
- 11.1.10.2. Products
- 11.1.10.3. Company Financials
- 11.1.10.4. SWOT Analysis
- 11.1.1 Alibaba Group Holding Limited
- 11.2. Market Entropy
- 11.2.1 Company's Key Areas Served
- 11.2.2 Recent Developments
- 11.3. Company Market Share Analysis 2025
- 11.3.1 Top 5 Companies Market Share Analysis
- 11.3.2 Top 3 Companies Market Share Analysis
- 11.4. List of Potential Customers
- 12. Research Methodology
List of Figures
- Figure 1: Global Automotive E Tailing Market Revenue Breakdown (billion, %) by Region 2025 & 2033
- Figure 2: North America Automotive E Tailing Market Revenue (billion), by Component Type 2025 & 2033
- Figure 3: North America Automotive E Tailing Market Revenue Share (%), by Component Type 2025 & 2033
- Figure 4: North America Automotive E Tailing Market Revenue (billion), by Vehicle Type 2025 & 2033
- Figure 5: North America Automotive E Tailing Market Revenue Share (%), by Vehicle Type 2025 & 2033
- Figure 6: North America Automotive E Tailing Market Revenue (billion), by Vendor Type 2025 & 2033
- Figure 7: North America Automotive E Tailing Market Revenue Share (%), by Vendor Type 2025 & 2033
- Figure 8: North America Automotive E Tailing Market Revenue (billion), by Country 2025 & 2033
- Figure 9: North America Automotive E Tailing Market Revenue Share (%), by Country 2025 & 2033
- Figure 10: Europe Automotive E Tailing Market Revenue (billion), by Component Type 2025 & 2033
- Figure 11: Europe Automotive E Tailing Market Revenue Share (%), by Component Type 2025 & 2033
- Figure 12: Europe Automotive E Tailing Market Revenue (billion), by Vehicle Type 2025 & 2033
- Figure 13: Europe Automotive E Tailing Market Revenue Share (%), by Vehicle Type 2025 & 2033
- Figure 14: Europe Automotive E Tailing Market Revenue (billion), by Vendor Type 2025 & 2033
- Figure 15: Europe Automotive E Tailing Market Revenue Share (%), by Vendor Type 2025 & 2033
- Figure 16: Europe Automotive E Tailing Market Revenue (billion), by Country 2025 & 2033
- Figure 17: Europe Automotive E Tailing Market Revenue Share (%), by Country 2025 & 2033
- Figure 18: Asia Pacific Automotive E Tailing Market Revenue (billion), by Component Type 2025 & 2033
- Figure 19: Asia Pacific Automotive E Tailing Market Revenue Share (%), by Component Type 2025 & 2033
- Figure 20: Asia Pacific Automotive E Tailing Market Revenue (billion), by Vehicle Type 2025 & 2033
- Figure 21: Asia Pacific Automotive E Tailing Market Revenue Share (%), by Vehicle Type 2025 & 2033
- Figure 22: Asia Pacific Automotive E Tailing Market Revenue (billion), by Vendor Type 2025 & 2033
- Figure 23: Asia Pacific Automotive E Tailing Market Revenue Share (%), by Vendor Type 2025 & 2033
- Figure 24: Asia Pacific Automotive E Tailing Market Revenue (billion), by Country 2025 & 2033
- Figure 25: Asia Pacific Automotive E Tailing Market Revenue Share (%), by Country 2025 & 2033
- Figure 26: Rest of the World Automotive E Tailing Market Revenue (billion), by Component Type 2025 & 2033
- Figure 27: Rest of the World Automotive E Tailing Market Revenue Share (%), by Component Type 2025 & 2033
- Figure 28: Rest of the World Automotive E Tailing Market Revenue (billion), by Vehicle Type 2025 & 2033
- Figure 29: Rest of the World Automotive E Tailing Market Revenue Share (%), by Vehicle Type 2025 & 2033
- Figure 30: Rest of the World Automotive E Tailing Market Revenue (billion), by Vendor Type 2025 & 2033
- Figure 31: Rest of the World Automotive E Tailing Market Revenue Share (%), by Vendor Type 2025 & 2033
- Figure 32: Rest of the World Automotive E Tailing Market Revenue (billion), by Country 2025 & 2033
- Figure 33: Rest of the World Automotive E Tailing Market Revenue Share (%), by Country 2025 & 2033
List of Tables
- Table 1: Global Automotive E Tailing Market Revenue billion Forecast, by Component Type 2020 & 2033
- Table 2: Global Automotive E Tailing Market Revenue billion Forecast, by Vehicle Type 2020 & 2033
- Table 3: Global Automotive E Tailing Market Revenue billion Forecast, by Vendor Type 2020 & 2033
- Table 4: Global Automotive E Tailing Market Revenue billion Forecast, by Region 2020 & 2033
- Table 5: Global Automotive E Tailing Market Revenue billion Forecast, by Component Type 2020 & 2033
- Table 6: Global Automotive E Tailing Market Revenue billion Forecast, by Vehicle Type 2020 & 2033
- Table 7: Global Automotive E Tailing Market Revenue billion Forecast, by Vendor Type 2020 & 2033
- Table 8: Global Automotive E Tailing Market Revenue billion Forecast, by Country 2020 & 2033
- Table 9: United States Automotive E Tailing Market Revenue (billion) Forecast, by Application 2020 & 2033
- Table 10: Canada Automotive E Tailing Market Revenue (billion) Forecast, by Application 2020 & 2033
- Table 11: Rest of North America Automotive E Tailing Market Revenue (billion) Forecast, by Application 2020 & 2033
- Table 12: Global Automotive E Tailing Market Revenue billion Forecast, by Component Type 2020 & 2033
- Table 13: Global Automotive E Tailing Market Revenue billion Forecast, by Vehicle Type 2020 & 2033
- Table 14: Global Automotive E Tailing Market Revenue billion Forecast, by Vendor Type 2020 & 2033
- Table 15: Global Automotive E Tailing Market Revenue billion Forecast, by Country 2020 & 2033
- Table 16: Germany Automotive E Tailing Market Revenue (billion) Forecast, by Application 2020 & 2033
- Table 17: United Kingdom Automotive E Tailing Market Revenue (billion) Forecast, by Application 2020 & 2033
- Table 18: France Automotive E Tailing Market Revenue (billion) Forecast, by Application 2020 & 2033
- Table 19: Italy Automotive E Tailing Market Revenue (billion) Forecast, by Application 2020 & 2033
- Table 20: Rest of Europe Automotive E Tailing Market Revenue (billion) Forecast, by Application 2020 & 2033
- Table 21: Global Automotive E Tailing Market Revenue billion Forecast, by Component Type 2020 & 2033
- Table 22: Global Automotive E Tailing Market Revenue billion Forecast, by Vehicle Type 2020 & 2033
- Table 23: Global Automotive E Tailing Market Revenue billion Forecast, by Vendor Type 2020 & 2033
- Table 24: Global Automotive E Tailing Market Revenue billion Forecast, by Country 2020 & 2033
- Table 25: India Automotive E Tailing Market Revenue (billion) Forecast, by Application 2020 & 2033
- Table 26: China Automotive E Tailing Market Revenue (billion) Forecast, by Application 2020 & 2033
- Table 27: Japan Automotive E Tailing Market Revenue (billion) Forecast, by Application 2020 & 2033
- Table 28: South Korea Automotive E Tailing Market Revenue (billion) Forecast, by Application 2020 & 2033
- Table 29: Rest of Asia Pacific Automotive E Tailing Market Revenue (billion) Forecast, by Application 2020 & 2033
- Table 30: Global Automotive E Tailing Market Revenue billion Forecast, by Component Type 2020 & 2033
- Table 31: Global Automotive E Tailing Market Revenue billion Forecast, by Vehicle Type 2020 & 2033
- Table 32: Global Automotive E Tailing Market Revenue billion Forecast, by Vendor Type 2020 & 2033
- Table 33: Global Automotive E Tailing Market Revenue billion Forecast, by Country 2020 & 2033
- Table 34: South America Automotive E Tailing Market Revenue (billion) Forecast, by Application 2020 & 2033
- Table 35: Middle East and Africa Automotive E Tailing Market Revenue (billion) Forecast, by Application 2020 & 2033
Frequently Asked Questions
1. What is the projected Compound Annual Growth Rate (CAGR) of the Automotive E Tailing Market?
The projected CAGR is approximately 14.2%.
2. Which companies are prominent players in the Automotive E Tailing Market?
Key companies in the market include Alibaba Group Holding Limited, Delticom AG, Advance Auto Parts Inc, Amazon com Inc, Robert Bosch GmbH, AutoZone Inc, Flipkart*List Not Exhaustive, eBay Inc, O'reilly Automotive Inc, Walmart Inc.
3. What are the main segments of the Automotive E Tailing Market?
The market segments include Component Type, Vehicle Type, Vendor Type.
4. Can you provide details about the market size?
The market size is estimated to be USD 17.1 billion as of 2022.
5. What are some drivers contributing to market growth?
Rise in Vehicle Electrification.
6. What are the notable trends driving market growth?
The Infotainment and Multimedia Segment to Hold Major Share in the Market.
7. Are there any restraints impacting market growth?
The Cost of Raw Materials Used in the Manufacturing of Switches is High.
8. Can you provide examples of recent developments in the market?
In February 2021, CarParts.com Partnered with McDowell and Front Row Motorsports (FRM) CarParts.com partnered with Front Row Motorsports (FRM) and McDowell on several contests, sweepstakes, promotions, and other activities to get more involved in the spark engagement and sport.
9. What pricing options are available for accessing the report?
Pricing options include single-user, multi-user, and enterprise licenses priced at USD 4750, USD 5250, and USD 8750 respectively.
10. Is the market size provided in terms of value or volume?
The market size is provided in terms of value, measured in billion.
11. Are there any specific market keywords associated with the report?
Yes, the market keyword associated with the report is "Automotive E Tailing Market," which aids in identifying and referencing the specific market segment covered.
12. How do I determine which pricing option suits my needs best?
The pricing options vary based on user requirements and access needs. Individual users may opt for single-user licenses, while businesses requiring broader access may choose multi-user or enterprise licenses for cost-effective access to the report.
13. Are there any additional resources or data provided in the Automotive E Tailing Market report?
While the report offers comprehensive insights, it's advisable to review the specific contents or supplementary materials provided to ascertain if additional resources or data are available.
14. How can I stay updated on further developments or reports in the Automotive E Tailing Market?
To stay informed about further developments, trends, and reports in the Automotive E Tailing Market, consider subscribing to industry newsletters, following relevant companies and organizations, or regularly checking reputable industry news sources and publications.
Methodology
Step 1 - Identification of Relevant Samples Size from Population Database


Step 2 - Approaches for Defining Global Market Size (Value, Volume* & Price*)

Note*: In applicable scenarios
Step 3 - Data Sources
Primary Research
- Web Analytics
- Survey Reports
- Research Institute
- Latest Research Reports
- Opinion Leaders
Secondary Research
- Annual Reports
- White Paper
- Latest Press Release
- Industry Association
- Paid Database
- Investor Presentations

Step 4 - Data Triangulation
Involves using different sources of information in order to increase the validity of a study
These sources are likely to be stakeholders in a program - participants, other researchers, program staff, other community members, and so on.
Then we put all data in single framework & apply various statistical tools to find out the dynamic on the market.
During the analysis stage, feedback from the stakeholder groups would be compared to determine areas of agreement as well as areas of divergence