

Key Insights
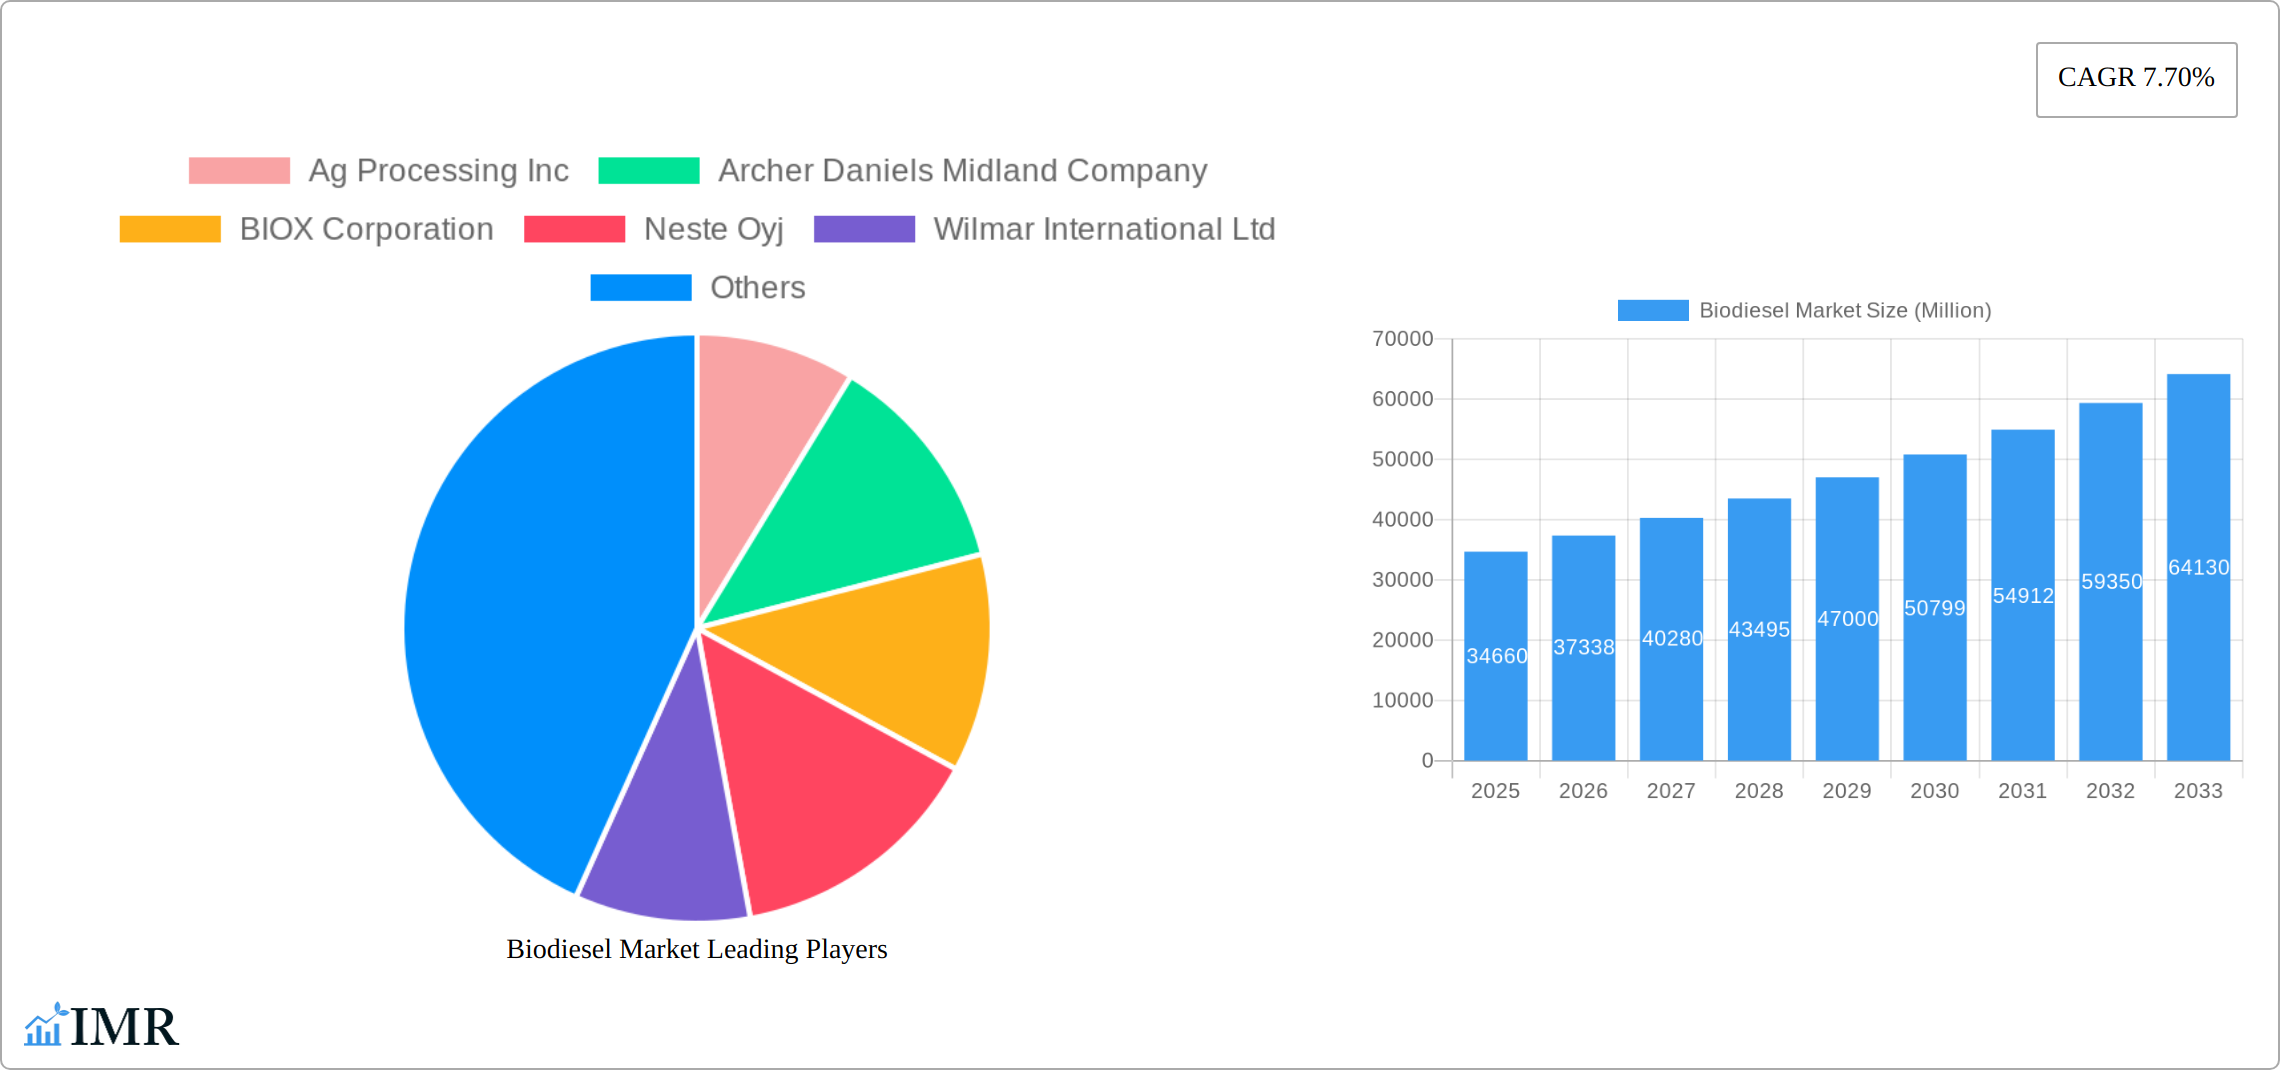
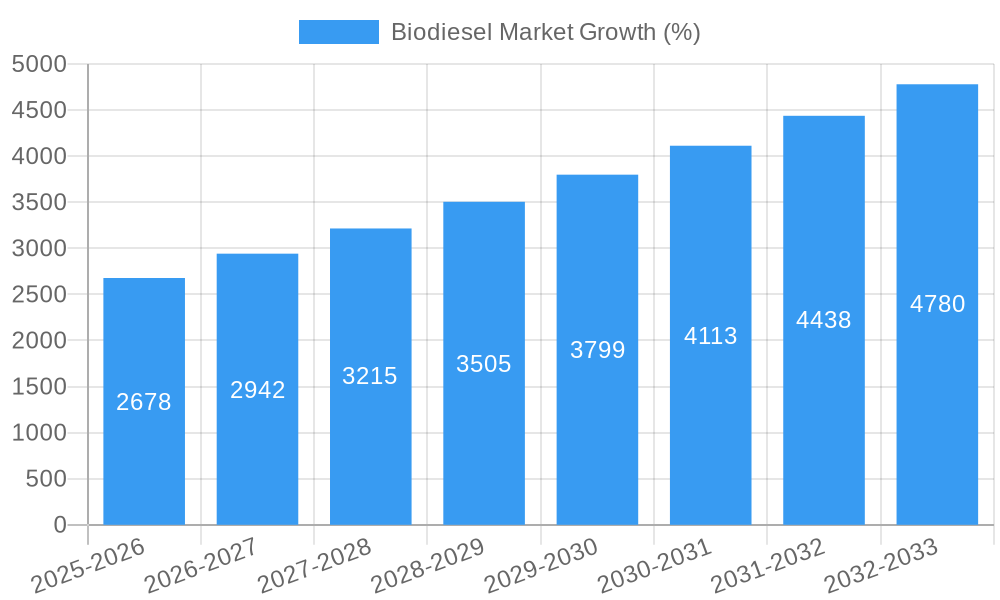
The global biodiesel market, valued at $34.66 billion in 2025, is projected to experience robust growth, driven by increasing environmental concerns and supportive government policies promoting renewable energy sources. A Compound Annual Growth Rate (CAGR) of 7.70% from 2025 to 2033 indicates a significant expansion of the market. Key drivers include stringent emission regulations aimed at reducing greenhouse gas emissions from transportation and power generation, coupled with rising demand for sustainable and eco-friendly fuels. The increasing adoption of biodiesel blends in various applications, including transportation (heavy-duty vehicles, passenger cars), and power generation, further fuels market expansion. While feedstock availability and price fluctuations present challenges, advancements in biodiesel production technologies and the exploration of alternative feedstocks like algae and waste cooking oil are mitigating these restraints. The market is segmented by feedstock (animal fat, vegetable oil, and other feedstocks) and application (transportation, power generation, and other applications). Major players like Ag Processing Inc., Archer Daniels Midland Company, and Neste Oyj are driving innovation and expansion, leading to increased market competition and further development of the biodiesel industry. The geographic distribution shows significant growth potential across various regions, with North America, Europe, and Asia Pacific expected to be key contributors to the overall market expansion due to strong governmental support and high consumer awareness.
The market's segmentation reveals valuable insights. The vegetable oil segment dominates the feedstock market due to its widespread availability and relatively lower cost. However, the "other feedstocks" category, encompassing innovative sources like used cooking oil and algae, is anticipated to witness significant growth driven by sustainability efforts and technological advancements. In terms of application, the transportation sector currently holds the largest market share, fueled by increasing demand for cleaner fuels in both the passenger and heavy-duty vehicle segments. However, the power generation sector is projected to witness faster growth due to the increasing focus on renewable energy sources and government incentives. The competitive landscape is characterized by a mix of large multinational corporations and smaller specialized companies, leading to increased innovation and investment in the biodiesel sector.
Biodiesel Market: A Comprehensive Report (2019-2033)
This in-depth report provides a comprehensive analysis of the Biodiesel Market, encompassing market dynamics, growth trends, regional segmentation, product landscape, key players, and future outlook. The study period covers 2019-2033, with 2025 as the base and estimated year. This report is invaluable for industry professionals, investors, and strategic decision-makers seeking a clear understanding of this dynamic market. The report analyzes the parent market of Renewable Fuels and the child market of Biodiesel, offering a granular view of the industry's current state and future projections.
Biodiesel Market Market Dynamics & Structure
The Biodiesel Market is characterized by a moderately concentrated landscape, with a few major players holding significant market share. Technological innovation, driven by the need for sustainable fuels and stringent environmental regulations, is a key driver. Government policies promoting renewable energy sources and mandates for biodiesel blending significantly influence market growth. Competitive pressures from other renewable fuels and fossil fuels remain substantial. The market exhibits diverse end-user demographics, spanning transportation, power generation, and other industrial applications. Mergers and acquisitions (M&A) activity is expected to increase as companies consolidate their positions and expand their product portfolios.
- Market Concentration: Moderate, with the top 5 players holding approximately xx% of the market share in 2025.
- Technological Innovation: Focus on improving feedstock efficiency, enhancing biodiesel properties, and reducing production costs.
- Regulatory Framework: Government mandates and subsidies drive market growth, while emission standards and environmental regulations create both challenges and opportunities.
- Competitive Substitutes: Petroleum diesel, other renewable fuels (e.g., ethanol, sustainable aviation fuel).
- End-User Demographics: Transportation sector dominates, followed by power generation and other industrial applications.
- M&A Trends: Increasing consolidation expected, with a projected xx number of M&A deals in the forecast period (2025-2033).
Biodiesel Market Growth Trends & Insights
The Biodiesel Market is experiencing robust growth, driven by increasing demand for sustainable transportation fuels and supportive government policies. Market size is projected to reach xx Million units by 2033, exhibiting a CAGR of xx% during the forecast period (2025-2033). Adoption rates are increasing across various sectors, particularly in transportation. Technological advancements are continuously improving biodiesel production efficiency and quality. Consumer preference for eco-friendly fuels is further driving market expansion. However, fluctuating feedstock prices and potential supply chain disruptions pose challenges to sustained growth. The market is also witnessing increased investment in research and development for advanced biodiesel technologies. The shift towards sustainable practices within industries is boosting the acceptance of biodiesel across various applications.
Dominant Regions, Countries, or Segments in Biodiesel Market
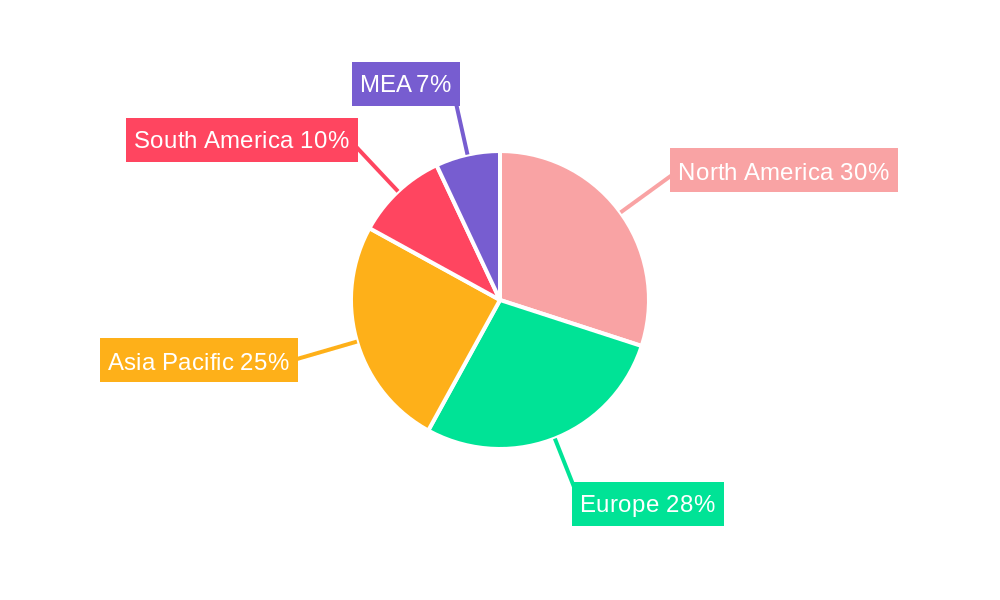
The North American and European regions currently lead the Biodiesel Market, primarily due to established biodiesel production infrastructure, supportive government policies, and stringent emission regulations. Within these regions, countries like the USA and Germany hold significant market shares. The transportation segment remains the dominant application area, followed by power generation. Vegetable oil is the most widely used feedstock.
- Leading Region: North America
- Key Drivers (North America): Stringent emission standards, government incentives, and established infrastructure.
- Leading Country: USA
- Key Drivers (USA): High demand for renewable diesel in the transportation sector, supportive government policies, and abundant feedstock resources.
- Dominant Segment (Application): Transportation
- Key Drivers (Transportation): Growing concerns about greenhouse gas emissions from conventional diesel fuel and increasing adoption of renewable diesel mandates.
- Dominant Segment (Feedstock): Vegetable oil
- Key Drivers (Vegetable oil): Abundant availability, relatively low cost compared to other feedstocks, and established processing technologies.
Biodiesel Market Product Landscape
Biodiesel products are constantly evolving, with innovations focused on improving fuel properties, such as cetane number and lubricity, and expanding feedstock options. Advanced biodiesel blends are being developed to enhance performance and reduce emissions. The market is also witnessing the emergence of customized biodiesel formulations catering to specific applications and engine types. These advancements are enhancing the overall competitiveness of biodiesel against conventional diesel fuel.
Key Drivers, Barriers & Challenges in Biodiesel Market
Key Drivers: Growing environmental concerns, government regulations promoting renewable energy, increasing demand for sustainable transportation fuels, technological advancements in production processes, and decreasing production costs.
Key Challenges: Fluctuating feedstock prices, competition from other renewable fuels and fossil fuels, potential supply chain disruptions, and regulatory hurdles in certain regions. The high initial investment required for biodiesel production facilities can also deter market entry. The variability in feedstock quality and composition also presents a challenge.
Emerging Opportunities in Biodiesel Market
Emerging opportunities lie in untapped markets, particularly in developing economies with growing transportation sectors and limited access to conventional diesel fuel. Innovative applications, such as using biodiesel in marine fuels and heating systems, are expanding the market's potential. Evolving consumer preferences towards sustainable and environmentally friendly products further drive these opportunities. The development of sustainable aviation fuel (SAF) from biodiesel feedstocks presents a major new market avenue.
Growth Accelerators in the Biodiesel Market Industry
Technological breakthroughs in feedstock processing, enhanced biodiesel production efficiency, strategic partnerships between biodiesel producers and energy companies, and successful market expansion strategies in new regions are accelerating market growth. The development of advanced biodiesel blends with superior performance characteristics is also a significant growth catalyst.
Key Players Shaping the Biodiesel Market Market
- Ag Processing Inc
- Archer Daniels Midland Company
- BIOX Corporation
- Neste Oyj
- Wilmar International Ltd
- Cargill Inc
- Bangchak Corporation Public Company Limited
- Renewable Energy Group Inc
Notable Milestones in Biodiesel Market Sector
- February 2022: SLD Pumps & Power (SLD) switched to biodiesel, displacing approximately 1 million liters of mineral diesel annually.
- October 2022: Fluor Corporation secured a contract for Imperial Oil's renewable diesel complex development in Canada.
- November 2022: Technip Energies received a contract from TotalEnergies to produce SAF (210,000 metric tons/year) in France.
In-Depth Biodiesel Market Market Outlook
The Biodiesel Market is poised for significant long-term growth, driven by a confluence of factors including environmental regulations, technological advancements, and evolving consumer preferences. Strategic partnerships and expansion into new geographical markets will further propel market expansion. The increasing adoption of renewable diesel mandates worldwide presents substantial opportunities for market players. The development of sustainable aviation fuel from biodiesel feedstocks presents a particularly significant growth avenue.
Biodiesel Market Segmentation
-
1. Feedstock
- 1.1. Animal Fat
- 1.2. Vegetable Oil
- 1.3. Other Feedstocks
-
2. Application
- 2.1. Transportation
- 2.2. Power Generation
- 2.3. Other Applications
-
3. Geogrpahy
-
3.1. North America
- 3.1.1. United States
- 3.1.2. Canada
- 3.1.3. Rest of North America
-
3.2. Europe
- 3.2.1. Germany
- 3.2.2. France
- 3.2.3. United Kingdom
- 3.2.4. Spain
- 3.2.5. NORDIC
- 3.2.6. Turkey
- 3.2.7. Russia
- 3.2.8. Rest of Europe
-
3.3. Asia-Pacific
- 3.3.1. China
- 3.3.2. India
- 3.3.3. Malaysia
- 3.3.4. Indonesia
- 3.3.5. Vietnam
- 3.3.6. Thailand
- 3.3.7. Japan
- 3.3.8. Australia
- 3.3.9. Rest of Asia-Pacific
-
3.4. South America
- 3.4.1. Brazil
- 3.4.2. Argentina
- 3.4.3. Colombia
- 3.4.4. Rest of South America
-
3.5. Middle East and Africa
- 3.5.1. Saudi Arabia
- 3.5.2. United Arab Emirates
- 3.5.3. Egypt
- 3.5.4. Nigeria
- 3.5.5. Qatar
- 3.5.6. Rest of Middle East and Africa
-
3.1. North America
Biodiesel Market Segmentation By Geography
-
1. North America
- 1.1. United States
- 1.2. Canada
- 1.3. Mexico
-
2. South America
- 2.1. Brazil
- 2.2. Argentina
- 2.3. Rest of South America
-
3. Europe
- 3.1. United Kingdom
- 3.2. Germany
- 3.3. France
- 3.4. Italy
- 3.5. Spain
- 3.6. Russia
- 3.7. Benelux
- 3.8. Nordics
- 3.9. Rest of Europe
-
4. Middle East & Africa
- 4.1. Turkey
- 4.2. Israel
- 4.3. GCC
- 4.4. North Africa
- 4.5. South Africa
- 4.6. Rest of Middle East & Africa
-
5. Asia Pacific
- 5.1. China
- 5.2. India
- 5.3. Japan
- 5.4. South Korea
- 5.5. ASEAN
- 5.6. Oceania
- 5.7. Rest of Asia Pacific
Biodiesel Market REPORT HIGHLIGHTS
| Aspects | Details |
|---|---|
| Study Period | 2019-2033 |
| Base Year | 2024 |
| Estimated Year | 2025 |
| Forecast Period | 2025-2033 |
| Historical Period | 2019-2024 |
| Growth Rate | CAGR of 7.70% from 2019-2033 |
| Segmentation |
|
Table of Contents
- 1. Introduction
- 1.1. Research Scope
- 1.2. Market Segmentation
- 1.3. Research Methodology
- 1.4. Definitions and Assumptions
- 2. Executive Summary
- 2.1. Introduction
- 3. Market Dynamics
- 3.1. Introduction
- 3.2. Market Drivers
- 3.2.1. 4.; The Increasing Demand for Eco-friendly Fuels 4.; Government Support for Biodiesel Production
- 3.3. Market Restrains
- 3.3.1. 4.; The Need for More Feedstock Availability for Biodiesel Generation
- 3.4. Market Trends
- 3.4.1. The Transportation Segment Expected to Dominate the Market
- 4. Market Factor Analysis
- 4.1. Porters Five Forces
- 4.2. Supply/Value Chain
- 4.3. PESTEL analysis
- 4.4. Market Entropy
- 4.5. Patent/Trademark Analysis
- 5. Global Biodiesel Market Analysis, Insights and Forecast, 2019-2031
- 5.1. Market Analysis, Insights and Forecast - by Feedstock
- 5.1.1. Animal Fat
- 5.1.2. Vegetable Oil
- 5.1.3. Other Feedstocks
- 5.2. Market Analysis, Insights and Forecast - by Application
- 5.2.1. Transportation
- 5.2.2. Power Generation
- 5.2.3. Other Applications
- 5.3. Market Analysis, Insights and Forecast - by Geogrpahy
- 5.3.1. North America
- 5.3.1.1. United States
- 5.3.1.2. Canada
- 5.3.1.3. Rest of North America
- 5.3.2. Europe
- 5.3.2.1. Germany
- 5.3.2.2. France
- 5.3.2.3. United Kingdom
- 5.3.2.4. Spain
- 5.3.2.5. NORDIC
- 5.3.2.6. Turkey
- 5.3.2.7. Russia
- 5.3.2.8. Rest of Europe
- 5.3.3. Asia-Pacific
- 5.3.3.1. China
- 5.3.3.2. India
- 5.3.3.3. Malaysia
- 5.3.3.4. Indonesia
- 5.3.3.5. Vietnam
- 5.3.3.6. Thailand
- 5.3.3.7. Japan
- 5.3.3.8. Australia
- 5.3.3.9. Rest of Asia-Pacific
- 5.3.4. South America
- 5.3.4.1. Brazil
- 5.3.4.2. Argentina
- 5.3.4.3. Colombia
- 5.3.4.4. Rest of South America
- 5.3.5. Middle East and Africa
- 5.3.5.1. Saudi Arabia
- 5.3.5.2. United Arab Emirates
- 5.3.5.3. Egypt
- 5.3.5.4. Nigeria
- 5.3.5.5. Qatar
- 5.3.5.6. Rest of Middle East and Africa
- 5.3.1. North America
- 5.4. Market Analysis, Insights and Forecast - by Region
- 5.4.1. North America
- 5.4.2. South America
- 5.4.3. Europe
- 5.4.4. Middle East & Africa
- 5.4.5. Asia Pacific
- 5.1. Market Analysis, Insights and Forecast - by Feedstock
- 6. North America Biodiesel Market Analysis, Insights and Forecast, 2019-2031
- 6.1. Market Analysis, Insights and Forecast - by Feedstock
- 6.1.1. Animal Fat
- 6.1.2. Vegetable Oil
- 6.1.3. Other Feedstocks
- 6.2. Market Analysis, Insights and Forecast - by Application
- 6.2.1. Transportation
- 6.2.2. Power Generation
- 6.2.3. Other Applications
- 6.3. Market Analysis, Insights and Forecast - by Geogrpahy
- 6.3.1. North America
- 6.3.1.1. United States
- 6.3.1.2. Canada
- 6.3.1.3. Rest of North America
- 6.3.2. Europe
- 6.3.2.1. Germany
- 6.3.2.2. France
- 6.3.2.3. United Kingdom
- 6.3.2.4. Spain
- 6.3.2.5. NORDIC
- 6.3.2.6. Turkey
- 6.3.2.7. Russia
- 6.3.2.8. Rest of Europe
- 6.3.3. Asia-Pacific
- 6.3.3.1. China
- 6.3.3.2. India
- 6.3.3.3. Malaysia
- 6.3.3.4. Indonesia
- 6.3.3.5. Vietnam
- 6.3.3.6. Thailand
- 6.3.3.7. Japan
- 6.3.3.8. Australia
- 6.3.3.9. Rest of Asia-Pacific
- 6.3.4. South America
- 6.3.4.1. Brazil
- 6.3.4.2. Argentina
- 6.3.4.3. Colombia
- 6.3.4.4. Rest of South America
- 6.3.5. Middle East and Africa
- 6.3.5.1. Saudi Arabia
- 6.3.5.2. United Arab Emirates
- 6.3.5.3. Egypt
- 6.3.5.4. Nigeria
- 6.3.5.5. Qatar
- 6.3.5.6. Rest of Middle East and Africa
- 6.3.1. North America
- 6.1. Market Analysis, Insights and Forecast - by Feedstock
- 7. South America Biodiesel Market Analysis, Insights and Forecast, 2019-2031
- 7.1. Market Analysis, Insights and Forecast - by Feedstock
- 7.1.1. Animal Fat
- 7.1.2. Vegetable Oil
- 7.1.3. Other Feedstocks
- 7.2. Market Analysis, Insights and Forecast - by Application
- 7.2.1. Transportation
- 7.2.2. Power Generation
- 7.2.3. Other Applications
- 7.3. Market Analysis, Insights and Forecast - by Geogrpahy
- 7.3.1. North America
- 7.3.1.1. United States
- 7.3.1.2. Canada
- 7.3.1.3. Rest of North America
- 7.3.2. Europe
- 7.3.2.1. Germany
- 7.3.2.2. France
- 7.3.2.3. United Kingdom
- 7.3.2.4. Spain
- 7.3.2.5. NORDIC
- 7.3.2.6. Turkey
- 7.3.2.7. Russia
- 7.3.2.8. Rest of Europe
- 7.3.3. Asia-Pacific
- 7.3.3.1. China
- 7.3.3.2. India
- 7.3.3.3. Malaysia
- 7.3.3.4. Indonesia
- 7.3.3.5. Vietnam
- 7.3.3.6. Thailand
- 7.3.3.7. Japan
- 7.3.3.8. Australia
- 7.3.3.9. Rest of Asia-Pacific
- 7.3.4. South America
- 7.3.4.1. Brazil
- 7.3.4.2. Argentina
- 7.3.4.3. Colombia
- 7.3.4.4. Rest of South America
- 7.3.5. Middle East and Africa
- 7.3.5.1. Saudi Arabia
- 7.3.5.2. United Arab Emirates
- 7.3.5.3. Egypt
- 7.3.5.4. Nigeria
- 7.3.5.5. Qatar
- 7.3.5.6. Rest of Middle East and Africa
- 7.3.1. North America
- 7.1. Market Analysis, Insights and Forecast - by Feedstock
- 8. Europe Biodiesel Market Analysis, Insights and Forecast, 2019-2031
- 8.1. Market Analysis, Insights and Forecast - by Feedstock
- 8.1.1. Animal Fat
- 8.1.2. Vegetable Oil
- 8.1.3. Other Feedstocks
- 8.2. Market Analysis, Insights and Forecast - by Application
- 8.2.1. Transportation
- 8.2.2. Power Generation
- 8.2.3. Other Applications
- 8.3. Market Analysis, Insights and Forecast - by Geogrpahy
- 8.3.1. North America
- 8.3.1.1. United States
- 8.3.1.2. Canada
- 8.3.1.3. Rest of North America
- 8.3.2. Europe
- 8.3.2.1. Germany
- 8.3.2.2. France
- 8.3.2.3. United Kingdom
- 8.3.2.4. Spain
- 8.3.2.5. NORDIC
- 8.3.2.6. Turkey
- 8.3.2.7. Russia
- 8.3.2.8. Rest of Europe
- 8.3.3. Asia-Pacific
- 8.3.3.1. China
- 8.3.3.2. India
- 8.3.3.3. Malaysia
- 8.3.3.4. Indonesia
- 8.3.3.5. Vietnam
- 8.3.3.6. Thailand
- 8.3.3.7. Japan
- 8.3.3.8. Australia
- 8.3.3.9. Rest of Asia-Pacific
- 8.3.4. South America
- 8.3.4.1. Brazil
- 8.3.4.2. Argentina
- 8.3.4.3. Colombia
- 8.3.4.4. Rest of South America
- 8.3.5. Middle East and Africa
- 8.3.5.1. Saudi Arabia
- 8.3.5.2. United Arab Emirates
- 8.3.5.3. Egypt
- 8.3.5.4. Nigeria
- 8.3.5.5. Qatar
- 8.3.5.6. Rest of Middle East and Africa
- 8.3.1. North America
- 8.1. Market Analysis, Insights and Forecast - by Feedstock
- 9. Middle East & Africa Biodiesel Market Analysis, Insights and Forecast, 2019-2031
- 9.1. Market Analysis, Insights and Forecast - by Feedstock
- 9.1.1. Animal Fat
- 9.1.2. Vegetable Oil
- 9.1.3. Other Feedstocks
- 9.2. Market Analysis, Insights and Forecast - by Application
- 9.2.1. Transportation
- 9.2.2. Power Generation
- 9.2.3. Other Applications
- 9.3. Market Analysis, Insights and Forecast - by Geogrpahy
- 9.3.1. North America
- 9.3.1.1. United States
- 9.3.1.2. Canada
- 9.3.1.3. Rest of North America
- 9.3.2. Europe
- 9.3.2.1. Germany
- 9.3.2.2. France
- 9.3.2.3. United Kingdom
- 9.3.2.4. Spain
- 9.3.2.5. NORDIC
- 9.3.2.6. Turkey
- 9.3.2.7. Russia
- 9.3.2.8. Rest of Europe
- 9.3.3. Asia-Pacific
- 9.3.3.1. China
- 9.3.3.2. India
- 9.3.3.3. Malaysia
- 9.3.3.4. Indonesia
- 9.3.3.5. Vietnam
- 9.3.3.6. Thailand
- 9.3.3.7. Japan
- 9.3.3.8. Australia
- 9.3.3.9. Rest of Asia-Pacific
- 9.3.4. South America
- 9.3.4.1. Brazil
- 9.3.4.2. Argentina
- 9.3.4.3. Colombia
- 9.3.4.4. Rest of South America
- 9.3.5. Middle East and Africa
- 9.3.5.1. Saudi Arabia
- 9.3.5.2. United Arab Emirates
- 9.3.5.3. Egypt
- 9.3.5.4. Nigeria
- 9.3.5.5. Qatar
- 9.3.5.6. Rest of Middle East and Africa
- 9.3.1. North America
- 9.1. Market Analysis, Insights and Forecast - by Feedstock
- 10. Asia Pacific Biodiesel Market Analysis, Insights and Forecast, 2019-2031
- 10.1. Market Analysis, Insights and Forecast - by Feedstock
- 10.1.1. Animal Fat
- 10.1.2. Vegetable Oil
- 10.1.3. Other Feedstocks
- 10.2. Market Analysis, Insights and Forecast - by Application
- 10.2.1. Transportation
- 10.2.2. Power Generation
- 10.2.3. Other Applications
- 10.3. Market Analysis, Insights and Forecast - by Geogrpahy
- 10.3.1. North America
- 10.3.1.1. United States
- 10.3.1.2. Canada
- 10.3.1.3. Rest of North America
- 10.3.2. Europe
- 10.3.2.1. Germany
- 10.3.2.2. France
- 10.3.2.3. United Kingdom
- 10.3.2.4. Spain
- 10.3.2.5. NORDIC
- 10.3.2.6. Turkey
- 10.3.2.7. Russia
- 10.3.2.8. Rest of Europe
- 10.3.3. Asia-Pacific
- 10.3.3.1. China
- 10.3.3.2. India
- 10.3.3.3. Malaysia
- 10.3.3.4. Indonesia
- 10.3.3.5. Vietnam
- 10.3.3.6. Thailand
- 10.3.3.7. Japan
- 10.3.3.8. Australia
- 10.3.3.9. Rest of Asia-Pacific
- 10.3.4. South America
- 10.3.4.1. Brazil
- 10.3.4.2. Argentina
- 10.3.4.3. Colombia
- 10.3.4.4. Rest of South America
- 10.3.5. Middle East and Africa
- 10.3.5.1. Saudi Arabia
- 10.3.5.2. United Arab Emirates
- 10.3.5.3. Egypt
- 10.3.5.4. Nigeria
- 10.3.5.5. Qatar
- 10.3.5.6. Rest of Middle East and Africa
- 10.3.1. North America
- 10.1. Market Analysis, Insights and Forecast - by Feedstock
- 11. North America Biodiesel Market Analysis, Insights and Forecast, 2019-2031
- 11.1. Market Analysis, Insights and Forecast - By Country/Sub-region
- 11.1.1 United States
- 11.1.2 Canada
- 11.1.3 Mexico
- 12. Europe Biodiesel Market Analysis, Insights and Forecast, 2019-2031
- 12.1. Market Analysis, Insights and Forecast - By Country/Sub-region
- 12.1.1 Germany
- 12.1.2 United Kingdom
- 12.1.3 France
- 12.1.4 Spain
- 12.1.5 Italy
- 12.1.6 Spain
- 12.1.7 Belgium
- 12.1.8 Netherland
- 12.1.9 Nordics
- 12.1.10 Rest of Europe
- 13. Asia Pacific Biodiesel Market Analysis, Insights and Forecast, 2019-2031
- 13.1. Market Analysis, Insights and Forecast - By Country/Sub-region
- 13.1.1 China
- 13.1.2 Japan
- 13.1.3 India
- 13.1.4 South Korea
- 13.1.5 Southeast Asia
- 13.1.6 Australia
- 13.1.7 Indonesia
- 13.1.8 Phillipes
- 13.1.9 Singapore
- 13.1.10 Thailandc
- 13.1.11 Rest of Asia Pacific
- 14. South America Biodiesel Market Analysis, Insights and Forecast, 2019-2031
- 14.1. Market Analysis, Insights and Forecast - By Country/Sub-region
- 14.1.1 Brazil
- 14.1.2 Argentina
- 14.1.3 Peru
- 14.1.4 Chile
- 14.1.5 Colombia
- 14.1.6 Ecuador
- 14.1.7 Venezuela
- 14.1.8 Rest of South America
- 15. MEA Biodiesel Market Analysis, Insights and Forecast, 2019-2031
- 15.1. Market Analysis, Insights and Forecast - By Country/Sub-region
- 15.1.1 United Arab Emirates
- 15.1.2 Saudi Arabia
- 15.1.3 South Africa
- 15.1.4 Rest of Middle East and Africa
- 16. Competitive Analysis
- 16.1. Global Market Share Analysis 2024
- 16.2. Company Profiles
- 16.2.1 Ag Processing Inc
- 16.2.1.1. Overview
- 16.2.1.2. Products
- 16.2.1.3. SWOT Analysis
- 16.2.1.4. Recent Developments
- 16.2.1.5. Financials (Based on Availability)
- 16.2.2 Archer Daniels Midland Company
- 16.2.2.1. Overview
- 16.2.2.2. Products
- 16.2.2.3. SWOT Analysis
- 16.2.2.4. Recent Developments
- 16.2.2.5. Financials (Based on Availability)
- 16.2.3 BIOX Corporation
- 16.2.3.1. Overview
- 16.2.3.2. Products
- 16.2.3.3. SWOT Analysis
- 16.2.3.4. Recent Developments
- 16.2.3.5. Financials (Based on Availability)
- 16.2.4 Neste Oyj
- 16.2.4.1. Overview
- 16.2.4.2. Products
- 16.2.4.3. SWOT Analysis
- 16.2.4.4. Recent Developments
- 16.2.4.5. Financials (Based on Availability)
- 16.2.5 Wilmar International Ltd
- 16.2.5.1. Overview
- 16.2.5.2. Products
- 16.2.5.3. SWOT Analysis
- 16.2.5.4. Recent Developments
- 16.2.5.5. Financials (Based on Availability)
- 16.2.6 Cargill Inc
- 16.2.6.1. Overview
- 16.2.6.2. Products
- 16.2.6.3. SWOT Analysis
- 16.2.6.4. Recent Developments
- 16.2.6.5. Financials (Based on Availability)
- 16.2.7 Bangchak Corporation Public Company Limited
- 16.2.7.1. Overview
- 16.2.7.2. Products
- 16.2.7.3. SWOT Analysis
- 16.2.7.4. Recent Developments
- 16.2.7.5. Financials (Based on Availability)
- 16.2.8 Renewable Energy Group Inc
- 16.2.8.1. Overview
- 16.2.8.2. Products
- 16.2.8.3. SWOT Analysis
- 16.2.8.4. Recent Developments
- 16.2.8.5. Financials (Based on Availability)
- 16.2.1 Ag Processing Inc
List of Figures
- Figure 1: Global Biodiesel Market Revenue Breakdown (Million, %) by Region 2024 & 2032
- Figure 2: Global Biodiesel Market Volume Breakdown (Gallons, %) by Region 2024 & 2032
- Figure 3: North America Biodiesel Market Revenue (Million), by Country 2024 & 2032
- Figure 4: North America Biodiesel Market Volume (Gallons), by Country 2024 & 2032
- Figure 5: North America Biodiesel Market Revenue Share (%), by Country 2024 & 2032
- Figure 6: North America Biodiesel Market Volume Share (%), by Country 2024 & 2032
- Figure 7: Europe Biodiesel Market Revenue (Million), by Country 2024 & 2032
- Figure 8: Europe Biodiesel Market Volume (Gallons), by Country 2024 & 2032
- Figure 9: Europe Biodiesel Market Revenue Share (%), by Country 2024 & 2032
- Figure 10: Europe Biodiesel Market Volume Share (%), by Country 2024 & 2032
- Figure 11: Asia Pacific Biodiesel Market Revenue (Million), by Country 2024 & 2032
- Figure 12: Asia Pacific Biodiesel Market Volume (Gallons), by Country 2024 & 2032
- Figure 13: Asia Pacific Biodiesel Market Revenue Share (%), by Country 2024 & 2032
- Figure 14: Asia Pacific Biodiesel Market Volume Share (%), by Country 2024 & 2032
- Figure 15: South America Biodiesel Market Revenue (Million), by Country 2024 & 2032
- Figure 16: South America Biodiesel Market Volume (Gallons), by Country 2024 & 2032
- Figure 17: South America Biodiesel Market Revenue Share (%), by Country 2024 & 2032
- Figure 18: South America Biodiesel Market Volume Share (%), by Country 2024 & 2032
- Figure 19: MEA Biodiesel Market Revenue (Million), by Country 2024 & 2032
- Figure 20: MEA Biodiesel Market Volume (Gallons), by Country 2024 & 2032
- Figure 21: MEA Biodiesel Market Revenue Share (%), by Country 2024 & 2032
- Figure 22: MEA Biodiesel Market Volume Share (%), by Country 2024 & 2032
- Figure 23: North America Biodiesel Market Revenue (Million), by Feedstock 2024 & 2032
- Figure 24: North America Biodiesel Market Volume (Gallons), by Feedstock 2024 & 2032
- Figure 25: North America Biodiesel Market Revenue Share (%), by Feedstock 2024 & 2032
- Figure 26: North America Biodiesel Market Volume Share (%), by Feedstock 2024 & 2032
- Figure 27: North America Biodiesel Market Revenue (Million), by Application 2024 & 2032
- Figure 28: North America Biodiesel Market Volume (Gallons), by Application 2024 & 2032
- Figure 29: North America Biodiesel Market Revenue Share (%), by Application 2024 & 2032
- Figure 30: North America Biodiesel Market Volume Share (%), by Application 2024 & 2032
- Figure 31: North America Biodiesel Market Revenue (Million), by Geogrpahy 2024 & 2032
- Figure 32: North America Biodiesel Market Volume (Gallons), by Geogrpahy 2024 & 2032
- Figure 33: North America Biodiesel Market Revenue Share (%), by Geogrpahy 2024 & 2032
- Figure 34: North America Biodiesel Market Volume Share (%), by Geogrpahy 2024 & 2032
- Figure 35: North America Biodiesel Market Revenue (Million), by Country 2024 & 2032
- Figure 36: North America Biodiesel Market Volume (Gallons), by Country 2024 & 2032
- Figure 37: North America Biodiesel Market Revenue Share (%), by Country 2024 & 2032
- Figure 38: North America Biodiesel Market Volume Share (%), by Country 2024 & 2032
- Figure 39: South America Biodiesel Market Revenue (Million), by Feedstock 2024 & 2032
- Figure 40: South America Biodiesel Market Volume (Gallons), by Feedstock 2024 & 2032
- Figure 41: South America Biodiesel Market Revenue Share (%), by Feedstock 2024 & 2032
- Figure 42: South America Biodiesel Market Volume Share (%), by Feedstock 2024 & 2032
- Figure 43: South America Biodiesel Market Revenue (Million), by Application 2024 & 2032
- Figure 44: South America Biodiesel Market Volume (Gallons), by Application 2024 & 2032
- Figure 45: South America Biodiesel Market Revenue Share (%), by Application 2024 & 2032
- Figure 46: South America Biodiesel Market Volume Share (%), by Application 2024 & 2032
- Figure 47: South America Biodiesel Market Revenue (Million), by Geogrpahy 2024 & 2032
- Figure 48: South America Biodiesel Market Volume (Gallons), by Geogrpahy 2024 & 2032
- Figure 49: South America Biodiesel Market Revenue Share (%), by Geogrpahy 2024 & 2032
- Figure 50: South America Biodiesel Market Volume Share (%), by Geogrpahy 2024 & 2032
- Figure 51: South America Biodiesel Market Revenue (Million), by Country 2024 & 2032
- Figure 52: South America Biodiesel Market Volume (Gallons), by Country 2024 & 2032
- Figure 53: South America Biodiesel Market Revenue Share (%), by Country 2024 & 2032
- Figure 54: South America Biodiesel Market Volume Share (%), by Country 2024 & 2032
- Figure 55: Europe Biodiesel Market Revenue (Million), by Feedstock 2024 & 2032
- Figure 56: Europe Biodiesel Market Volume (Gallons), by Feedstock 2024 & 2032
- Figure 57: Europe Biodiesel Market Revenue Share (%), by Feedstock 2024 & 2032
- Figure 58: Europe Biodiesel Market Volume Share (%), by Feedstock 2024 & 2032
- Figure 59: Europe Biodiesel Market Revenue (Million), by Application 2024 & 2032
- Figure 60: Europe Biodiesel Market Volume (Gallons), by Application 2024 & 2032
- Figure 61: Europe Biodiesel Market Revenue Share (%), by Application 2024 & 2032
- Figure 62: Europe Biodiesel Market Volume Share (%), by Application 2024 & 2032
- Figure 63: Europe Biodiesel Market Revenue (Million), by Geogrpahy 2024 & 2032
- Figure 64: Europe Biodiesel Market Volume (Gallons), by Geogrpahy 2024 & 2032
- Figure 65: Europe Biodiesel Market Revenue Share (%), by Geogrpahy 2024 & 2032
- Figure 66: Europe Biodiesel Market Volume Share (%), by Geogrpahy 2024 & 2032
- Figure 67: Europe Biodiesel Market Revenue (Million), by Country 2024 & 2032
- Figure 68: Europe Biodiesel Market Volume (Gallons), by Country 2024 & 2032
- Figure 69: Europe Biodiesel Market Revenue Share (%), by Country 2024 & 2032
- Figure 70: Europe Biodiesel Market Volume Share (%), by Country 2024 & 2032
- Figure 71: Middle East & Africa Biodiesel Market Revenue (Million), by Feedstock 2024 & 2032
- Figure 72: Middle East & Africa Biodiesel Market Volume (Gallons), by Feedstock 2024 & 2032
- Figure 73: Middle East & Africa Biodiesel Market Revenue Share (%), by Feedstock 2024 & 2032
- Figure 74: Middle East & Africa Biodiesel Market Volume Share (%), by Feedstock 2024 & 2032
- Figure 75: Middle East & Africa Biodiesel Market Revenue (Million), by Application 2024 & 2032
- Figure 76: Middle East & Africa Biodiesel Market Volume (Gallons), by Application 2024 & 2032
- Figure 77: Middle East & Africa Biodiesel Market Revenue Share (%), by Application 2024 & 2032
- Figure 78: Middle East & Africa Biodiesel Market Volume Share (%), by Application 2024 & 2032
- Figure 79: Middle East & Africa Biodiesel Market Revenue (Million), by Geogrpahy 2024 & 2032
- Figure 80: Middle East & Africa Biodiesel Market Volume (Gallons), by Geogrpahy 2024 & 2032
- Figure 81: Middle East & Africa Biodiesel Market Revenue Share (%), by Geogrpahy 2024 & 2032
- Figure 82: Middle East & Africa Biodiesel Market Volume Share (%), by Geogrpahy 2024 & 2032
- Figure 83: Middle East & Africa Biodiesel Market Revenue (Million), by Country 2024 & 2032
- Figure 84: Middle East & Africa Biodiesel Market Volume (Gallons), by Country 2024 & 2032
- Figure 85: Middle East & Africa Biodiesel Market Revenue Share (%), by Country 2024 & 2032
- Figure 86: Middle East & Africa Biodiesel Market Volume Share (%), by Country 2024 & 2032
- Figure 87: Asia Pacific Biodiesel Market Revenue (Million), by Feedstock 2024 & 2032
- Figure 88: Asia Pacific Biodiesel Market Volume (Gallons), by Feedstock 2024 & 2032
- Figure 89: Asia Pacific Biodiesel Market Revenue Share (%), by Feedstock 2024 & 2032
- Figure 90: Asia Pacific Biodiesel Market Volume Share (%), by Feedstock 2024 & 2032
- Figure 91: Asia Pacific Biodiesel Market Revenue (Million), by Application 2024 & 2032
- Figure 92: Asia Pacific Biodiesel Market Volume (Gallons), by Application 2024 & 2032
- Figure 93: Asia Pacific Biodiesel Market Revenue Share (%), by Application 2024 & 2032
- Figure 94: Asia Pacific Biodiesel Market Volume Share (%), by Application 2024 & 2032
- Figure 95: Asia Pacific Biodiesel Market Revenue (Million), by Geogrpahy 2024 & 2032
- Figure 96: Asia Pacific Biodiesel Market Volume (Gallons), by Geogrpahy 2024 & 2032
- Figure 97: Asia Pacific Biodiesel Market Revenue Share (%), by Geogrpahy 2024 & 2032
- Figure 98: Asia Pacific Biodiesel Market Volume Share (%), by Geogrpahy 2024 & 2032
- Figure 99: Asia Pacific Biodiesel Market Revenue (Million), by Country 2024 & 2032
- Figure 100: Asia Pacific Biodiesel Market Volume (Gallons), by Country 2024 & 2032
- Figure 101: Asia Pacific Biodiesel Market Revenue Share (%), by Country 2024 & 2032
- Figure 102: Asia Pacific Biodiesel Market Volume Share (%), by Country 2024 & 2032
List of Tables
- Table 1: Global Biodiesel Market Revenue Million Forecast, by Region 2019 & 2032
- Table 2: Global Biodiesel Market Volume Gallons Forecast, by Region 2019 & 2032
- Table 3: Global Biodiesel Market Revenue Million Forecast, by Feedstock 2019 & 2032
- Table 4: Global Biodiesel Market Volume Gallons Forecast, by Feedstock 2019 & 2032
- Table 5: Global Biodiesel Market Revenue Million Forecast, by Application 2019 & 2032
- Table 6: Global Biodiesel Market Volume Gallons Forecast, by Application 2019 & 2032
- Table 7: Global Biodiesel Market Revenue Million Forecast, by Geogrpahy 2019 & 2032
- Table 8: Global Biodiesel Market Volume Gallons Forecast, by Geogrpahy 2019 & 2032
- Table 9: Global Biodiesel Market Revenue Million Forecast, by Region 2019 & 2032
- Table 10: Global Biodiesel Market Volume Gallons Forecast, by Region 2019 & 2032
- Table 11: Global Biodiesel Market Revenue Million Forecast, by Country 2019 & 2032
- Table 12: Global Biodiesel Market Volume Gallons Forecast, by Country 2019 & 2032
- Table 13: United States Biodiesel Market Revenue (Million) Forecast, by Application 2019 & 2032
- Table 14: United States Biodiesel Market Volume (Gallons) Forecast, by Application 2019 & 2032
- Table 15: Canada Biodiesel Market Revenue (Million) Forecast, by Application 2019 & 2032
- Table 16: Canada Biodiesel Market Volume (Gallons) Forecast, by Application 2019 & 2032
- Table 17: Mexico Biodiesel Market Revenue (Million) Forecast, by Application 2019 & 2032
- Table 18: Mexico Biodiesel Market Volume (Gallons) Forecast, by Application 2019 & 2032
- Table 19: Global Biodiesel Market Revenue Million Forecast, by Country 2019 & 2032
- Table 20: Global Biodiesel Market Volume Gallons Forecast, by Country 2019 & 2032
- Table 21: Germany Biodiesel Market Revenue (Million) Forecast, by Application 2019 & 2032
- Table 22: Germany Biodiesel Market Volume (Gallons) Forecast, by Application 2019 & 2032
- Table 23: United Kingdom Biodiesel Market Revenue (Million) Forecast, by Application 2019 & 2032
- Table 24: United Kingdom Biodiesel Market Volume (Gallons) Forecast, by Application 2019 & 2032
- Table 25: France Biodiesel Market Revenue (Million) Forecast, by Application 2019 & 2032
- Table 26: France Biodiesel Market Volume (Gallons) Forecast, by Application 2019 & 2032
- Table 27: Spain Biodiesel Market Revenue (Million) Forecast, by Application 2019 & 2032
- Table 28: Spain Biodiesel Market Volume (Gallons) Forecast, by Application 2019 & 2032
- Table 29: Italy Biodiesel Market Revenue (Million) Forecast, by Application 2019 & 2032
- Table 30: Italy Biodiesel Market Volume (Gallons) Forecast, by Application 2019 & 2032
- Table 31: Spain Biodiesel Market Revenue (Million) Forecast, by Application 2019 & 2032
- Table 32: Spain Biodiesel Market Volume (Gallons) Forecast, by Application 2019 & 2032
- Table 33: Belgium Biodiesel Market Revenue (Million) Forecast, by Application 2019 & 2032
- Table 34: Belgium Biodiesel Market Volume (Gallons) Forecast, by Application 2019 & 2032
- Table 35: Netherland Biodiesel Market Revenue (Million) Forecast, by Application 2019 & 2032
- Table 36: Netherland Biodiesel Market Volume (Gallons) Forecast, by Application 2019 & 2032
- Table 37: Nordics Biodiesel Market Revenue (Million) Forecast, by Application 2019 & 2032
- Table 38: Nordics Biodiesel Market Volume (Gallons) Forecast, by Application 2019 & 2032
- Table 39: Rest of Europe Biodiesel Market Revenue (Million) Forecast, by Application 2019 & 2032
- Table 40: Rest of Europe Biodiesel Market Volume (Gallons) Forecast, by Application 2019 & 2032
- Table 41: Global Biodiesel Market Revenue Million Forecast, by Country 2019 & 2032
- Table 42: Global Biodiesel Market Volume Gallons Forecast, by Country 2019 & 2032
- Table 43: China Biodiesel Market Revenue (Million) Forecast, by Application 2019 & 2032
- Table 44: China Biodiesel Market Volume (Gallons) Forecast, by Application 2019 & 2032
- Table 45: Japan Biodiesel Market Revenue (Million) Forecast, by Application 2019 & 2032
- Table 46: Japan Biodiesel Market Volume (Gallons) Forecast, by Application 2019 & 2032
- Table 47: India Biodiesel Market Revenue (Million) Forecast, by Application 2019 & 2032
- Table 48: India Biodiesel Market Volume (Gallons) Forecast, by Application 2019 & 2032
- Table 49: South Korea Biodiesel Market Revenue (Million) Forecast, by Application 2019 & 2032
- Table 50: South Korea Biodiesel Market Volume (Gallons) Forecast, by Application 2019 & 2032
- Table 51: Southeast Asia Biodiesel Market Revenue (Million) Forecast, by Application 2019 & 2032
- Table 52: Southeast Asia Biodiesel Market Volume (Gallons) Forecast, by Application 2019 & 2032
- Table 53: Australia Biodiesel Market Revenue (Million) Forecast, by Application 2019 & 2032
- Table 54: Australia Biodiesel Market Volume (Gallons) Forecast, by Application 2019 & 2032
- Table 55: Indonesia Biodiesel Market Revenue (Million) Forecast, by Application 2019 & 2032
- Table 56: Indonesia Biodiesel Market Volume (Gallons) Forecast, by Application 2019 & 2032
- Table 57: Phillipes Biodiesel Market Revenue (Million) Forecast, by Application 2019 & 2032
- Table 58: Phillipes Biodiesel Market Volume (Gallons) Forecast, by Application 2019 & 2032
- Table 59: Singapore Biodiesel Market Revenue (Million) Forecast, by Application 2019 & 2032
- Table 60: Singapore Biodiesel Market Volume (Gallons) Forecast, by Application 2019 & 2032
- Table 61: Thailandc Biodiesel Market Revenue (Million) Forecast, by Application 2019 & 2032
- Table 62: Thailandc Biodiesel Market Volume (Gallons) Forecast, by Application 2019 & 2032
- Table 63: Rest of Asia Pacific Biodiesel Market Revenue (Million) Forecast, by Application 2019 & 2032
- Table 64: Rest of Asia Pacific Biodiesel Market Volume (Gallons) Forecast, by Application 2019 & 2032
- Table 65: Global Biodiesel Market Revenue Million Forecast, by Country 2019 & 2032
- Table 66: Global Biodiesel Market Volume Gallons Forecast, by Country 2019 & 2032
- Table 67: Brazil Biodiesel Market Revenue (Million) Forecast, by Application 2019 & 2032
- Table 68: Brazil Biodiesel Market Volume (Gallons) Forecast, by Application 2019 & 2032
- Table 69: Argentina Biodiesel Market Revenue (Million) Forecast, by Application 2019 & 2032
- Table 70: Argentina Biodiesel Market Volume (Gallons) Forecast, by Application 2019 & 2032
- Table 71: Peru Biodiesel Market Revenue (Million) Forecast, by Application 2019 & 2032
- Table 72: Peru Biodiesel Market Volume (Gallons) Forecast, by Application 2019 & 2032
- Table 73: Chile Biodiesel Market Revenue (Million) Forecast, by Application 2019 & 2032
- Table 74: Chile Biodiesel Market Volume (Gallons) Forecast, by Application 2019 & 2032
- Table 75: Colombia Biodiesel Market Revenue (Million) Forecast, by Application 2019 & 2032
- Table 76: Colombia Biodiesel Market Volume (Gallons) Forecast, by Application 2019 & 2032
- Table 77: Ecuador Biodiesel Market Revenue (Million) Forecast, by Application 2019 & 2032
- Table 78: Ecuador Biodiesel Market Volume (Gallons) Forecast, by Application 2019 & 2032
- Table 79: Venezuela Biodiesel Market Revenue (Million) Forecast, by Application 2019 & 2032
- Table 80: Venezuela Biodiesel Market Volume (Gallons) Forecast, by Application 2019 & 2032
- Table 81: Rest of South America Biodiesel Market Revenue (Million) Forecast, by Application 2019 & 2032
- Table 82: Rest of South America Biodiesel Market Volume (Gallons) Forecast, by Application 2019 & 2032
- Table 83: Global Biodiesel Market Revenue Million Forecast, by Country 2019 & 2032
- Table 84: Global Biodiesel Market Volume Gallons Forecast, by Country 2019 & 2032
- Table 85: United Arab Emirates Biodiesel Market Revenue (Million) Forecast, by Application 2019 & 2032
- Table 86: United Arab Emirates Biodiesel Market Volume (Gallons) Forecast, by Application 2019 & 2032
- Table 87: Saudi Arabia Biodiesel Market Revenue (Million) Forecast, by Application 2019 & 2032
- Table 88: Saudi Arabia Biodiesel Market Volume (Gallons) Forecast, by Application 2019 & 2032
- Table 89: South Africa Biodiesel Market Revenue (Million) Forecast, by Application 2019 & 2032
- Table 90: South Africa Biodiesel Market Volume (Gallons) Forecast, by Application 2019 & 2032
- Table 91: Rest of Middle East and Africa Biodiesel Market Revenue (Million) Forecast, by Application 2019 & 2032
- Table 92: Rest of Middle East and Africa Biodiesel Market Volume (Gallons) Forecast, by Application 2019 & 2032
- Table 93: Global Biodiesel Market Revenue Million Forecast, by Feedstock 2019 & 2032
- Table 94: Global Biodiesel Market Volume Gallons Forecast, by Feedstock 2019 & 2032
- Table 95: Global Biodiesel Market Revenue Million Forecast, by Application 2019 & 2032
- Table 96: Global Biodiesel Market Volume Gallons Forecast, by Application 2019 & 2032
- Table 97: Global Biodiesel Market Revenue Million Forecast, by Geogrpahy 2019 & 2032
- Table 98: Global Biodiesel Market Volume Gallons Forecast, by Geogrpahy 2019 & 2032
- Table 99: Global Biodiesel Market Revenue Million Forecast, by Country 2019 & 2032
- Table 100: Global Biodiesel Market Volume Gallons Forecast, by Country 2019 & 2032
- Table 101: United States Biodiesel Market Revenue (Million) Forecast, by Application 2019 & 2032
- Table 102: United States Biodiesel Market Volume (Gallons) Forecast, by Application 2019 & 2032
- Table 103: Canada Biodiesel Market Revenue (Million) Forecast, by Application 2019 & 2032
- Table 104: Canada Biodiesel Market Volume (Gallons) Forecast, by Application 2019 & 2032
- Table 105: Mexico Biodiesel Market Revenue (Million) Forecast, by Application 2019 & 2032
- Table 106: Mexico Biodiesel Market Volume (Gallons) Forecast, by Application 2019 & 2032
- Table 107: Global Biodiesel Market Revenue Million Forecast, by Feedstock 2019 & 2032
- Table 108: Global Biodiesel Market Volume Gallons Forecast, by Feedstock 2019 & 2032
- Table 109: Global Biodiesel Market Revenue Million Forecast, by Application 2019 & 2032
- Table 110: Global Biodiesel Market Volume Gallons Forecast, by Application 2019 & 2032
- Table 111: Global Biodiesel Market Revenue Million Forecast, by Geogrpahy 2019 & 2032
- Table 112: Global Biodiesel Market Volume Gallons Forecast, by Geogrpahy 2019 & 2032
- Table 113: Global Biodiesel Market Revenue Million Forecast, by Country 2019 & 2032
- Table 114: Global Biodiesel Market Volume Gallons Forecast, by Country 2019 & 2032
- Table 115: Brazil Biodiesel Market Revenue (Million) Forecast, by Application 2019 & 2032
- Table 116: Brazil Biodiesel Market Volume (Gallons) Forecast, by Application 2019 & 2032
- Table 117: Argentina Biodiesel Market Revenue (Million) Forecast, by Application 2019 & 2032
- Table 118: Argentina Biodiesel Market Volume (Gallons) Forecast, by Application 2019 & 2032
- Table 119: Rest of South America Biodiesel Market Revenue (Million) Forecast, by Application 2019 & 2032
- Table 120: Rest of South America Biodiesel Market Volume (Gallons) Forecast, by Application 2019 & 2032
- Table 121: Global Biodiesel Market Revenue Million Forecast, by Feedstock 2019 & 2032
- Table 122: Global Biodiesel Market Volume Gallons Forecast, by Feedstock 2019 & 2032
- Table 123: Global Biodiesel Market Revenue Million Forecast, by Application 2019 & 2032
- Table 124: Global Biodiesel Market Volume Gallons Forecast, by Application 2019 & 2032
- Table 125: Global Biodiesel Market Revenue Million Forecast, by Geogrpahy 2019 & 2032
- Table 126: Global Biodiesel Market Volume Gallons Forecast, by Geogrpahy 2019 & 2032
- Table 127: Global Biodiesel Market Revenue Million Forecast, by Country 2019 & 2032
- Table 128: Global Biodiesel Market Volume Gallons Forecast, by Country 2019 & 2032
- Table 129: United Kingdom Biodiesel Market Revenue (Million) Forecast, by Application 2019 & 2032
- Table 130: United Kingdom Biodiesel Market Volume (Gallons) Forecast, by Application 2019 & 2032
- Table 131: Germany Biodiesel Market Revenue (Million) Forecast, by Application 2019 & 2032
- Table 132: Germany Biodiesel Market Volume (Gallons) Forecast, by Application 2019 & 2032
- Table 133: France Biodiesel Market Revenue (Million) Forecast, by Application 2019 & 2032
- Table 134: France Biodiesel Market Volume (Gallons) Forecast, by Application 2019 & 2032
- Table 135: Italy Biodiesel Market Revenue (Million) Forecast, by Application 2019 & 2032
- Table 136: Italy Biodiesel Market Volume (Gallons) Forecast, by Application 2019 & 2032
- Table 137: Spain Biodiesel Market Revenue (Million) Forecast, by Application 2019 & 2032
- Table 138: Spain Biodiesel Market Volume (Gallons) Forecast, by Application 2019 & 2032
- Table 139: Russia Biodiesel Market Revenue (Million) Forecast, by Application 2019 & 2032
- Table 140: Russia Biodiesel Market Volume (Gallons) Forecast, by Application 2019 & 2032
- Table 141: Benelux Biodiesel Market Revenue (Million) Forecast, by Application 2019 & 2032
- Table 142: Benelux Biodiesel Market Volume (Gallons) Forecast, by Application 2019 & 2032
- Table 143: Nordics Biodiesel Market Revenue (Million) Forecast, by Application 2019 & 2032
- Table 144: Nordics Biodiesel Market Volume (Gallons) Forecast, by Application 2019 & 2032
- Table 145: Rest of Europe Biodiesel Market Revenue (Million) Forecast, by Application 2019 & 2032
- Table 146: Rest of Europe Biodiesel Market Volume (Gallons) Forecast, by Application 2019 & 2032
- Table 147: Global Biodiesel Market Revenue Million Forecast, by Feedstock 2019 & 2032
- Table 148: Global Biodiesel Market Volume Gallons Forecast, by Feedstock 2019 & 2032
- Table 149: Global Biodiesel Market Revenue Million Forecast, by Application 2019 & 2032
- Table 150: Global Biodiesel Market Volume Gallons Forecast, by Application 2019 & 2032
- Table 151: Global Biodiesel Market Revenue Million Forecast, by Geogrpahy 2019 & 2032
- Table 152: Global Biodiesel Market Volume Gallons Forecast, by Geogrpahy 2019 & 2032
- Table 153: Global Biodiesel Market Revenue Million Forecast, by Country 2019 & 2032
- Table 154: Global Biodiesel Market Volume Gallons Forecast, by Country 2019 & 2032
- Table 155: Turkey Biodiesel Market Revenue (Million) Forecast, by Application 2019 & 2032
- Table 156: Turkey Biodiesel Market Volume (Gallons) Forecast, by Application 2019 & 2032
- Table 157: Israel Biodiesel Market Revenue (Million) Forecast, by Application 2019 & 2032
- Table 158: Israel Biodiesel Market Volume (Gallons) Forecast, by Application 2019 & 2032
- Table 159: GCC Biodiesel Market Revenue (Million) Forecast, by Application 2019 & 2032
- Table 160: GCC Biodiesel Market Volume (Gallons) Forecast, by Application 2019 & 2032
- Table 161: North Africa Biodiesel Market Revenue (Million) Forecast, by Application 2019 & 2032
- Table 162: North Africa Biodiesel Market Volume (Gallons) Forecast, by Application 2019 & 2032
- Table 163: South Africa Biodiesel Market Revenue (Million) Forecast, by Application 2019 & 2032
- Table 164: South Africa Biodiesel Market Volume (Gallons) Forecast, by Application 2019 & 2032
- Table 165: Rest of Middle East & Africa Biodiesel Market Revenue (Million) Forecast, by Application 2019 & 2032
- Table 166: Rest of Middle East & Africa Biodiesel Market Volume (Gallons) Forecast, by Application 2019 & 2032
- Table 167: Global Biodiesel Market Revenue Million Forecast, by Feedstock 2019 & 2032
- Table 168: Global Biodiesel Market Volume Gallons Forecast, by Feedstock 2019 & 2032
- Table 169: Global Biodiesel Market Revenue Million Forecast, by Application 2019 & 2032
- Table 170: Global Biodiesel Market Volume Gallons Forecast, by Application 2019 & 2032
- Table 171: Global Biodiesel Market Revenue Million Forecast, by Geogrpahy 2019 & 2032
- Table 172: Global Biodiesel Market Volume Gallons Forecast, by Geogrpahy 2019 & 2032
- Table 173: Global Biodiesel Market Revenue Million Forecast, by Country 2019 & 2032
- Table 174: Global Biodiesel Market Volume Gallons Forecast, by Country 2019 & 2032
- Table 175: China Biodiesel Market Revenue (Million) Forecast, by Application 2019 & 2032
- Table 176: China Biodiesel Market Volume (Gallons) Forecast, by Application 2019 & 2032
- Table 177: India Biodiesel Market Revenue (Million) Forecast, by Application 2019 & 2032
- Table 178: India Biodiesel Market Volume (Gallons) Forecast, by Application 2019 & 2032
- Table 179: Japan Biodiesel Market Revenue (Million) Forecast, by Application 2019 & 2032
- Table 180: Japan Biodiesel Market Volume (Gallons) Forecast, by Application 2019 & 2032
- Table 181: South Korea Biodiesel Market Revenue (Million) Forecast, by Application 2019 & 2032
- Table 182: South Korea Biodiesel Market Volume (Gallons) Forecast, by Application 2019 & 2032
- Table 183: ASEAN Biodiesel Market Revenue (Million) Forecast, by Application 2019 & 2032
- Table 184: ASEAN Biodiesel Market Volume (Gallons) Forecast, by Application 2019 & 2032
- Table 185: Oceania Biodiesel Market Revenue (Million) Forecast, by Application 2019 & 2032
- Table 186: Oceania Biodiesel Market Volume (Gallons) Forecast, by Application 2019 & 2032
- Table 187: Rest of Asia Pacific Biodiesel Market Revenue (Million) Forecast, by Application 2019 & 2032
- Table 188: Rest of Asia Pacific Biodiesel Market Volume (Gallons) Forecast, by Application 2019 & 2032
Frequently Asked Questions
1. What is the projected Compound Annual Growth Rate (CAGR) of the Biodiesel Market?
The projected CAGR is approximately 7.70%.
2. Which companies are prominent players in the Biodiesel Market?
Key companies in the market include Ag Processing Inc, Archer Daniels Midland Company, BIOX Corporation, Neste Oyj, Wilmar International Ltd, Cargill Inc, Bangchak Corporation Public Company Limited, Renewable Energy Group Inc.
3. What are the main segments of the Biodiesel Market?
The market segments include Feedstock, Application, Geogrpahy.
4. Can you provide details about the market size?
The market size is estimated to be USD 34.66 Million as of 2022.
5. What are some drivers contributing to market growth?
4.; The Increasing Demand for Eco-friendly Fuels 4.; Government Support for Biodiesel Production.
6. What are the notable trends driving market growth?
The Transportation Segment Expected to Dominate the Market.
7. Are there any restraints impacting market growth?
4.; The Need for More Feedstock Availability for Biodiesel Generation.
8. Can you provide examples of recent developments in the market?
November 2022: Technip Energies received a contract from TotalEnergies to produce Sustainable Aviation Fuel (SAF) at the Grandpuits platform in France. The contract covers the EPC assistance for converting the refinery into a zero-crude platform focused on SAF. This facility can produce around 210,000 metric tons per year.
9. What pricing options are available for accessing the report?
Pricing options include single-user, multi-user, and enterprise licenses priced at USD 4750, USD 5250, and USD 8750 respectively.
10. Is the market size provided in terms of value or volume?
The market size is provided in terms of value, measured in Million and volume, measured in Gallons.
11. Are there any specific market keywords associated with the report?
Yes, the market keyword associated with the report is "Biodiesel Market," which aids in identifying and referencing the specific market segment covered.
12. How do I determine which pricing option suits my needs best?
The pricing options vary based on user requirements and access needs. Individual users may opt for single-user licenses, while businesses requiring broader access may choose multi-user or enterprise licenses for cost-effective access to the report.
13. Are there any additional resources or data provided in the Biodiesel Market report?
While the report offers comprehensive insights, it's advisable to review the specific contents or supplementary materials provided to ascertain if additional resources or data are available.
14. How can I stay updated on further developments or reports in the Biodiesel Market?
To stay informed about further developments, trends, and reports in the Biodiesel Market, consider subscribing to industry newsletters, following relevant companies and organizations, or regularly checking reputable industry news sources and publications.
Methodology
Step 1 - Identification of Relevant Samples Size from Population Database


Step 2 - Approaches for Defining Global Market Size (Value, Volume* & Price*)

Note*: In applicable scenarios
Step 3 - Data Sources
Primary Research
- Web Analytics
- Survey Reports
- Research Institute
- Latest Research Reports
- Opinion Leaders
Secondary Research
- Annual Reports
- White Paper
- Latest Press Release
- Industry Association
- Paid Database
- Investor Presentations

Step 4 - Data Triangulation
Involves using different sources of information in order to increase the validity of a study
These sources are likely to be stakeholders in a program - participants, other researchers, program staff, other community members, and so on.
Then we put all data in single framework & apply various statistical tools to find out the dynamic on the market.
During the analysis stage, feedback from the stakeholder groups would be compared to determine areas of agreement as well as areas of divergence
