

Key Insights
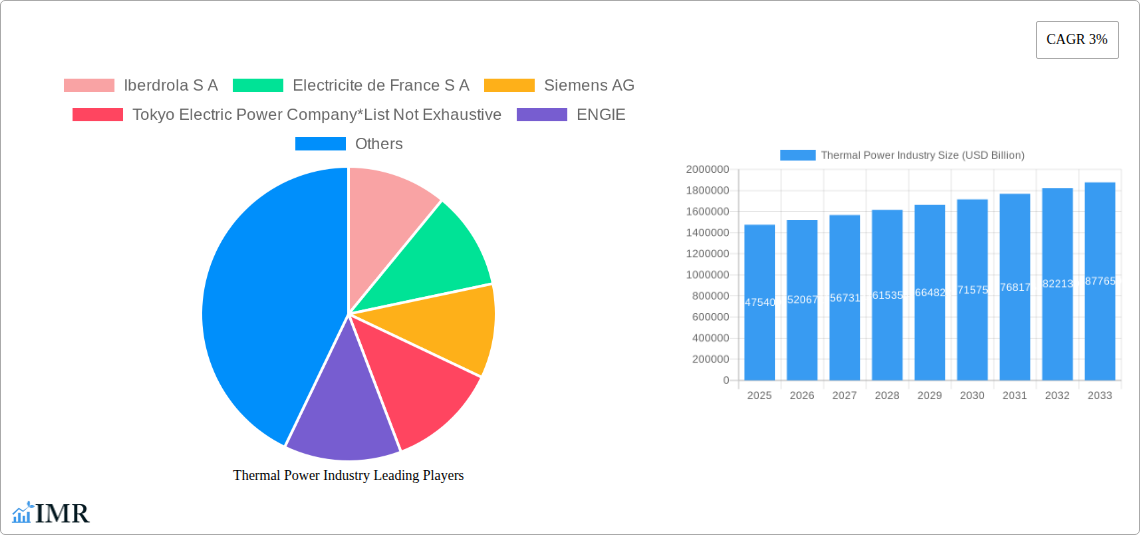
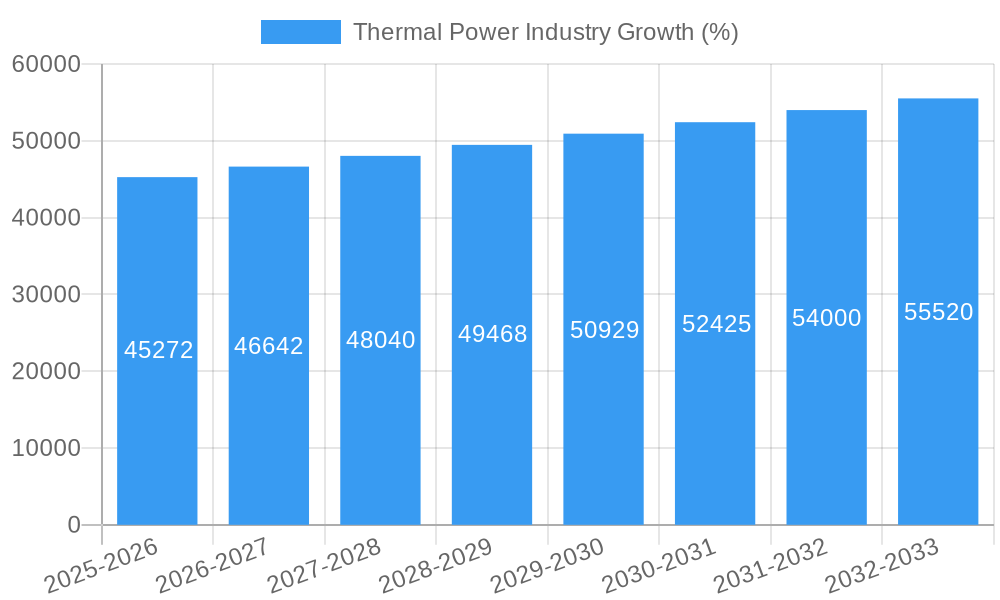
The global thermal power industry, valued at $1,475.40 billion in 2025, is projected to experience steady growth with a Compound Annual Growth Rate (CAGR) of 3% from 2025 to 2033. This growth is driven by several factors. Firstly, reliable and consistent electricity generation remains a critical need in many developing economies experiencing rapid industrialization and population growth. Secondly, thermal power plants, particularly those utilizing natural gas, offer a degree of flexibility and dispatch ability crucial for grid stability, complementing the intermittency of renewable energy sources. However, increasing environmental concerns related to greenhouse gas emissions and air pollution pose significant restraints on the sector’s expansion. Stringent environmental regulations and the rising adoption of renewable energy sources such as solar and wind power are expected to curb the growth of coal-fired thermal power plants. Consequently, we anticipate a shift towards cleaner-burning fuels like natural gas and potentially advanced technologies focused on carbon capture and storage to mitigate the environmental impact of thermal power generation. The industry's segmentation by fuel type reflects this trend, with gas-fired power plants expected to witness comparatively higher growth rates than coal-fired plants over the forecast period.
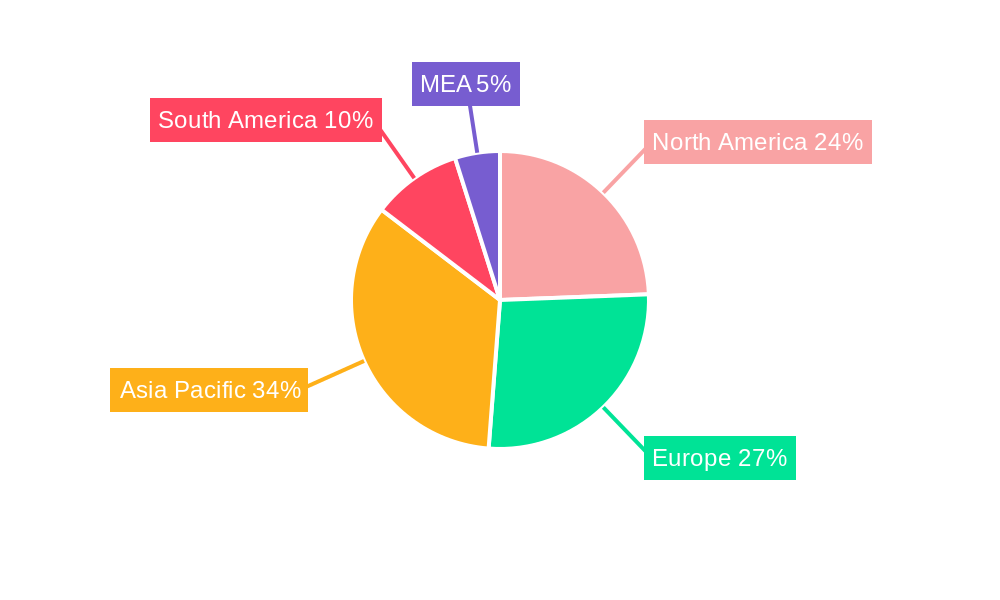
The geographic distribution of the thermal power market is diverse, with significant contributions from North America, Europe, and Asia Pacific. While North America and Europe have established thermal power infrastructure, Asia Pacific's high energy demand and ongoing industrialization are fueling considerable market expansion in this region. Key players like Iberdrola, EDF, Siemens, and GE are actively involved in the industry, focusing on technological advancements and operational efficiency to maintain competitiveness and adapt to evolving market dynamics. The competitive landscape features both established players and emerging companies, creating a dynamic environment shaped by technological innovation, regulatory changes, and the global transition towards cleaner energy sources. The forecast period will likely see a strategic shift towards diversifying fuel sources and incorporating carbon mitigation strategies within thermal power generation.
Thermal Power Industry Market Report: 2019-2033
This comprehensive report provides an in-depth analysis of the global thermal power industry, encompassing market dynamics, growth trends, key players, and future outlook. The study period covers 2019-2033, with a base year of 2025 and a forecast period of 2025-2033. The report segments the market by fuel type (Coal, Gas, Nuclear, Others) and examines key regional and national trends. The total market size in 2025 is estimated at $XX Billion, projected to reach $YY Billion by 2033.
Thermal Power Industry Market Dynamics & Structure
The thermal power industry is characterized by moderate market concentration, with a few major players holding significant market share. However, a fragmented landscape also exists, particularly in emerging markets. Technological innovation, driven by the need for increased efficiency and reduced emissions, is a key driver. Stringent environmental regulations are reshaping the industry, favoring cleaner technologies and prompting mergers and acquisitions (M&A) activity. Competitive substitutes, such as renewable energy sources, are gaining traction, creating competitive pressure. End-user demographics, largely driven by electricity demand from industrial and residential sectors, are critical in shaping market growth.
- Market Concentration: Top 5 players hold approximately XX% of the market share in 2025.
- M&A Activity: An average of XX deals per year were observed during 2019-2024, totaling approximately $XX Billion in deal value.
- Technological Innovation Drivers: Demand for higher efficiency and lower emissions is driving investments in advanced combustion technologies and carbon capture systems.
- Regulatory Frameworks: Stringent emission standards are driving the adoption of cleaner fuel sources and emission control technologies.
- Innovation Barriers: High capital investment costs and technological complexities pose significant barriers to innovation.
Thermal Power Industry Growth Trends & Insights
The thermal power market experienced a CAGR of XX% during the historical period (2019-2024). However, the forecast period (2025-2033) anticipates a more moderate CAGR of YY%, influenced by the increasing adoption of renewable energy sources and stricter environmental regulations. Market penetration of various fuel types is expected to shift, with a decline in coal and a potential rise in gas and potentially advanced nuclear technologies. Consumer behavior is shifting toward greater environmental consciousness, influencing demand for cleaner energy sources. Technological disruptions, including advancements in energy storage and smart grids, will impact the market dynamics. The market size is projected to reach $YY Billion by 2033.
Dominant Regions, Countries, or Segments in Thermal Power Industry
Asia-Pacific is projected to be the dominant region in the thermal power market throughout the forecast period, driven by strong economic growth and rising electricity demand in countries like China and India. Within fuel types, Coal currently holds the largest market share due to its abundance and established infrastructure, but this is expected to decline, with natural gas experiencing relative growth. The region's robust industrial sector necessitates high energy consumption, stimulating demand.
- Key Drivers in Asia-Pacific: Rapid economic growth, increasing urbanization, and expanding industrialization.
- Dominance Factors: High electricity demand, established infrastructure, and relatively low initial investment costs for coal-fired plants (though this advantage is diminishing due to environmental concerns and rising carbon taxes).
- Growth Potential: Continued expansion of the industrial sector, implementation of efficient power generation systems, and potential for gas-based thermal power growth.
Thermal Power Industry Product Landscape
The thermal power industry's product landscape features a range of technologies, including conventional steam turbines, combined cycle gas turbines, and advanced nuclear reactors. Innovations focus on increasing efficiency, reducing emissions, and improving reliability. Products are differentiated based on fuel type, capacity, emission levels, and operational efficiency. The emphasis is on technologies that minimize environmental impact while maintaining cost-effectiveness.
Key Drivers, Barriers & Challenges in Thermal Power Industry
Key Drivers:
- Increasing global energy demand.
- Relatively low cost of thermal power generation (compared to some renewables, though this is changing).
- Existing infrastructure for thermal power plants.
Key Barriers & Challenges:
- Stringent environmental regulations and rising carbon prices.
- Fluctuating fuel prices.
- Competition from renewable energy sources, leading to capacity oversupply concerns in certain markets and reduced profitability.
- Supply chain disruptions can impact the availability of critical components, affecting the timely completion of projects.
Emerging Opportunities in Thermal Power Industry
- The development of carbon capture and storage (CCS) technologies presents significant opportunities for reducing emissions from thermal power plants.
- The integration of thermal power with renewable energy sources (hybrid systems) to provide a stable baseload power supply.
- Focus on optimizing existing plants and improving their operational efficiency.
Growth Accelerators in the Thermal Power Industry
Technological breakthroughs in clean coal technologies, advancements in gas turbine efficiency, and the development of next-generation nuclear reactors are key growth catalysts. Strategic partnerships between thermal power companies and renewable energy developers are accelerating the transition to a cleaner energy mix. Expansion into untapped markets, especially in developing economies, is also crucial.
Key Players Shaping the Thermal Power Industry Market
- Iberdrola S A
- Electricite de France S A
- Siemens AG
- Tokyo Electric Power Company
- ENGIE
- National Thermal Power Corporation Limited
- General Electric Company
- Chubu Electric Power Co Inc
- ABB
- Bharat Heavy Electricals Limited (BHEL)
Notable Milestones in Thermal Power Industry Sector
- 2020: Increased focus on CCS technology implementation by several major players.
- 2021: Several countries announced stricter emission reduction targets impacting thermal power plant operations.
- 2022: Significant investments made in modernizing existing thermal plants to improve efficiency and reduce emissions.
- 2023: Launch of several new, more efficient thermal power plant projects incorporating advanced technologies.
In-Depth Thermal Power Industry Market Outlook
The thermal power industry is poised for significant transformation in the coming years. While the overall market growth will moderate due to the rise of renewables, strategic opportunities exist in areas like efficiency improvements, emissions reduction, and the integration of thermal power within a diversified energy system. Investments in advanced technologies and sustainable practices will be crucial for long-term success in this evolving landscape.
Thermal Power Industry Segmentation
-
1. Fuel Type
- 1.1. Coal
- 1.2. Gas
- 1.3. Nuclear
- 1.4. Others
Thermal Power Industry Segmentation By Geography
- 1. North America
- 2. Asia Pacific
- 3. Europe
- 4. South America
- 5. Middle East and Africa
Thermal Power Industry REPORT HIGHLIGHTS
| Aspects | Details |
|---|---|
| Study Period | 2019-2033 |
| Base Year | 2024 |
| Estimated Year | 2025 |
| Forecast Period | 2025-2033 |
| Historical Period | 2019-2024 |
| Growth Rate | CAGR of 3% from 2019-2033 |
| Segmentation |
|
Table of Contents
- 1. Introduction
- 1.1. Research Scope
- 1.2. Market Segmentation
- 1.3. Research Methodology
- 1.4. Definitions and Assumptions
- 2. Executive Summary
- 2.1. Introduction
- 3. Market Dynamics
- 3.1. Introduction
- 3.2. Market Drivers
- 3.2.1. 4.; Increasing investment in the Midstream Sector4.; Increasing Production of Oil and Natural Gas
- 3.3. Market Restrains
- 3.3.1. 4.; Inadequate Infrastructure in the Country
- 3.4. Market Trends
- 3.4.1. Natural Gas Power Plants to Witness Significant Growth
- 4. Market Factor Analysis
- 4.1. Porters Five Forces
- 4.2. Supply/Value Chain
- 4.3. PESTEL analysis
- 4.4. Market Entropy
- 4.5. Patent/Trademark Analysis
- 5. Global Thermal Power Industry Analysis, Insights and Forecast, 2019-2031
- 5.1. Market Analysis, Insights and Forecast - by Fuel Type
- 5.1.1. Coal
- 5.1.2. Gas
- 5.1.3. Nuclear
- 5.1.4. Others
- 5.2. Market Analysis, Insights and Forecast - by Region
- 5.2.1. North America
- 5.2.2. Asia Pacific
- 5.2.3. Europe
- 5.2.4. South America
- 5.2.5. Middle East and Africa
- 5.1. Market Analysis, Insights and Forecast - by Fuel Type
- 6. North America Thermal Power Industry Analysis, Insights and Forecast, 2019-2031
- 6.1. Market Analysis, Insights and Forecast - by Fuel Type
- 6.1.1. Coal
- 6.1.2. Gas
- 6.1.3. Nuclear
- 6.1.4. Others
- 6.1. Market Analysis, Insights and Forecast - by Fuel Type
- 7. Asia Pacific Thermal Power Industry Analysis, Insights and Forecast, 2019-2031
- 7.1. Market Analysis, Insights and Forecast - by Fuel Type
- 7.1.1. Coal
- 7.1.2. Gas
- 7.1.3. Nuclear
- 7.1.4. Others
- 7.1. Market Analysis, Insights and Forecast - by Fuel Type
- 8. Europe Thermal Power Industry Analysis, Insights and Forecast, 2019-2031
- 8.1. Market Analysis, Insights and Forecast - by Fuel Type
- 8.1.1. Coal
- 8.1.2. Gas
- 8.1.3. Nuclear
- 8.1.4. Others
- 8.1. Market Analysis, Insights and Forecast - by Fuel Type
- 9. South America Thermal Power Industry Analysis, Insights and Forecast, 2019-2031
- 9.1. Market Analysis, Insights and Forecast - by Fuel Type
- 9.1.1. Coal
- 9.1.2. Gas
- 9.1.3. Nuclear
- 9.1.4. Others
- 9.1. Market Analysis, Insights and Forecast - by Fuel Type
- 10. Middle East and Africa Thermal Power Industry Analysis, Insights and Forecast, 2019-2031
- 10.1. Market Analysis, Insights and Forecast - by Fuel Type
- 10.1.1. Coal
- 10.1.2. Gas
- 10.1.3. Nuclear
- 10.1.4. Others
- 10.1. Market Analysis, Insights and Forecast - by Fuel Type
- 11. North America Thermal Power Industry Analysis, Insights and Forecast, 2019-2031
- 11.1. Market Analysis, Insights and Forecast - By Country/Sub-region
- 11.1.1 United States
- 11.1.2 Canada
- 11.1.3 Mexico
- 12. Europe Thermal Power Industry Analysis, Insights and Forecast, 2019-2031
- 12.1. Market Analysis, Insights and Forecast - By Country/Sub-region
- 12.1.1 Germany
- 12.1.2 United Kingdom
- 12.1.3 France
- 12.1.4 Spain
- 12.1.5 Italy
- 12.1.6 Spain
- 12.1.7 Belgium
- 12.1.8 Netherland
- 12.1.9 Nordics
- 12.1.10 Rest of Europe
- 13. Asia Pacific Thermal Power Industry Analysis, Insights and Forecast, 2019-2031
- 13.1. Market Analysis, Insights and Forecast - By Country/Sub-region
- 13.1.1 China
- 13.1.2 Japan
- 13.1.3 India
- 13.1.4 South Korea
- 13.1.5 Southeast Asia
- 13.1.6 Australia
- 13.1.7 Indonesia
- 13.1.8 Phillipes
- 13.1.9 Singapore
- 13.1.10 Thailandc
- 13.1.11 Rest of Asia Pacific
- 14. South America Thermal Power Industry Analysis, Insights and Forecast, 2019-2031
- 14.1. Market Analysis, Insights and Forecast - By Country/Sub-region
- 14.1.1 Brazil
- 14.1.2 Argentina
- 14.1.3 Peru
- 14.1.4 Chile
- 14.1.5 Colombia
- 14.1.6 Ecuador
- 14.1.7 Venezuela
- 14.1.8 Rest of South America
- 15. North America Thermal Power Industry Analysis, Insights and Forecast, 2019-2031
- 15.1. Market Analysis, Insights and Forecast - By Country/Sub-region
- 15.1.1 United States
- 15.1.2 Canada
- 15.1.3 Mexico
- 16. MEA Thermal Power Industry Analysis, Insights and Forecast, 2019-2031
- 16.1. Market Analysis, Insights and Forecast - By Country/Sub-region
- 16.1.1 United Arab Emirates
- 16.1.2 Saudi Arabia
- 16.1.3 South Africa
- 16.1.4 Rest of Middle East and Africa
- 17. Competitive Analysis
- 17.1. Global Market Share Analysis 2024
- 17.2. Company Profiles
- 17.2.1 Iberdrola S A
- 17.2.1.1. Overview
- 17.2.1.2. Products
- 17.2.1.3. SWOT Analysis
- 17.2.1.4. Recent Developments
- 17.2.1.5. Financials (Based on Availability)
- 17.2.2 Electricite de France S A
- 17.2.2.1. Overview
- 17.2.2.2. Products
- 17.2.2.3. SWOT Analysis
- 17.2.2.4. Recent Developments
- 17.2.2.5. Financials (Based on Availability)
- 17.2.3 Siemens AG
- 17.2.3.1. Overview
- 17.2.3.2. Products
- 17.2.3.3. SWOT Analysis
- 17.2.3.4. Recent Developments
- 17.2.3.5. Financials (Based on Availability)
- 17.2.4 Tokyo Electric Power Company*List Not Exhaustive
- 17.2.4.1. Overview
- 17.2.4.2. Products
- 17.2.4.3. SWOT Analysis
- 17.2.4.4. Recent Developments
- 17.2.4.5. Financials (Based on Availability)
- 17.2.5 ENGIE
- 17.2.5.1. Overview
- 17.2.5.2. Products
- 17.2.5.3. SWOT Analysis
- 17.2.5.4. Recent Developments
- 17.2.5.5. Financials (Based on Availability)
- 17.2.6 National Thermal Power Corporation Limited
- 17.2.6.1. Overview
- 17.2.6.2. Products
- 17.2.6.3. SWOT Analysis
- 17.2.6.4. Recent Developments
- 17.2.6.5. Financials (Based on Availability)
- 17.2.7 General Electric Company
- 17.2.7.1. Overview
- 17.2.7.2. Products
- 17.2.7.3. SWOT Analysis
- 17.2.7.4. Recent Developments
- 17.2.7.5. Financials (Based on Availability)
- 17.2.8 Chubu Electric Power Co Inc
- 17.2.8.1. Overview
- 17.2.8.2. Products
- 17.2.8.3. SWOT Analysis
- 17.2.8.4. Recent Developments
- 17.2.8.5. Financials (Based on Availability)
- 17.2.9 ABB
- 17.2.9.1. Overview
- 17.2.9.2. Products
- 17.2.9.3. SWOT Analysis
- 17.2.9.4. Recent Developments
- 17.2.9.5. Financials (Based on Availability)
- 17.2.10 Bharat Heavy Electricals Limited (BHEL)
- 17.2.10.1. Overview
- 17.2.10.2. Products
- 17.2.10.3. SWOT Analysis
- 17.2.10.4. Recent Developments
- 17.2.10.5. Financials (Based on Availability)
- 17.2.1 Iberdrola S A
List of Figures
- Figure 1: Global Thermal Power Industry Revenue Breakdown (USD Billion, %) by Region 2024 & 2032
- Figure 2: Global Thermal Power Industry Volume Breakdown (Megawatt, %) by Region 2024 & 2032
- Figure 3: North America Thermal Power Industry Revenue (USD Billion), by Country 2024 & 2032
- Figure 4: North America Thermal Power Industry Volume (Megawatt), by Country 2024 & 2032
- Figure 5: North America Thermal Power Industry Revenue Share (%), by Country 2024 & 2032
- Figure 6: North America Thermal Power Industry Volume Share (%), by Country 2024 & 2032
- Figure 7: Europe Thermal Power Industry Revenue (USD Billion), by Country 2024 & 2032
- Figure 8: Europe Thermal Power Industry Volume (Megawatt), by Country 2024 & 2032
- Figure 9: Europe Thermal Power Industry Revenue Share (%), by Country 2024 & 2032
- Figure 10: Europe Thermal Power Industry Volume Share (%), by Country 2024 & 2032
- Figure 11: Asia Pacific Thermal Power Industry Revenue (USD Billion), by Country 2024 & 2032
- Figure 12: Asia Pacific Thermal Power Industry Volume (Megawatt), by Country 2024 & 2032
- Figure 13: Asia Pacific Thermal Power Industry Revenue Share (%), by Country 2024 & 2032
- Figure 14: Asia Pacific Thermal Power Industry Volume Share (%), by Country 2024 & 2032
- Figure 15: South America Thermal Power Industry Revenue (USD Billion), by Country 2024 & 2032
- Figure 16: South America Thermal Power Industry Volume (Megawatt), by Country 2024 & 2032
- Figure 17: South America Thermal Power Industry Revenue Share (%), by Country 2024 & 2032
- Figure 18: South America Thermal Power Industry Volume Share (%), by Country 2024 & 2032
- Figure 19: North America Thermal Power Industry Revenue (USD Billion), by Country 2024 & 2032
- Figure 20: North America Thermal Power Industry Volume (Megawatt), by Country 2024 & 2032
- Figure 21: North America Thermal Power Industry Revenue Share (%), by Country 2024 & 2032
- Figure 22: North America Thermal Power Industry Volume Share (%), by Country 2024 & 2032
- Figure 23: MEA Thermal Power Industry Revenue (USD Billion), by Country 2024 & 2032
- Figure 24: MEA Thermal Power Industry Volume (Megawatt), by Country 2024 & 2032
- Figure 25: MEA Thermal Power Industry Revenue Share (%), by Country 2024 & 2032
- Figure 26: MEA Thermal Power Industry Volume Share (%), by Country 2024 & 2032
- Figure 27: North America Thermal Power Industry Revenue (USD Billion), by Fuel Type 2024 & 2032
- Figure 28: North America Thermal Power Industry Volume (Megawatt), by Fuel Type 2024 & 2032
- Figure 29: North America Thermal Power Industry Revenue Share (%), by Fuel Type 2024 & 2032
- Figure 30: North America Thermal Power Industry Volume Share (%), by Fuel Type 2024 & 2032
- Figure 31: North America Thermal Power Industry Revenue (USD Billion), by Country 2024 & 2032
- Figure 32: North America Thermal Power Industry Volume (Megawatt), by Country 2024 & 2032
- Figure 33: North America Thermal Power Industry Revenue Share (%), by Country 2024 & 2032
- Figure 34: North America Thermal Power Industry Volume Share (%), by Country 2024 & 2032
- Figure 35: Asia Pacific Thermal Power Industry Revenue (USD Billion), by Fuel Type 2024 & 2032
- Figure 36: Asia Pacific Thermal Power Industry Volume (Megawatt), by Fuel Type 2024 & 2032
- Figure 37: Asia Pacific Thermal Power Industry Revenue Share (%), by Fuel Type 2024 & 2032
- Figure 38: Asia Pacific Thermal Power Industry Volume Share (%), by Fuel Type 2024 & 2032
- Figure 39: Asia Pacific Thermal Power Industry Revenue (USD Billion), by Country 2024 & 2032
- Figure 40: Asia Pacific Thermal Power Industry Volume (Megawatt), by Country 2024 & 2032
- Figure 41: Asia Pacific Thermal Power Industry Revenue Share (%), by Country 2024 & 2032
- Figure 42: Asia Pacific Thermal Power Industry Volume Share (%), by Country 2024 & 2032
- Figure 43: Europe Thermal Power Industry Revenue (USD Billion), by Fuel Type 2024 & 2032
- Figure 44: Europe Thermal Power Industry Volume (Megawatt), by Fuel Type 2024 & 2032
- Figure 45: Europe Thermal Power Industry Revenue Share (%), by Fuel Type 2024 & 2032
- Figure 46: Europe Thermal Power Industry Volume Share (%), by Fuel Type 2024 & 2032
- Figure 47: Europe Thermal Power Industry Revenue (USD Billion), by Country 2024 & 2032
- Figure 48: Europe Thermal Power Industry Volume (Megawatt), by Country 2024 & 2032
- Figure 49: Europe Thermal Power Industry Revenue Share (%), by Country 2024 & 2032
- Figure 50: Europe Thermal Power Industry Volume Share (%), by Country 2024 & 2032
- Figure 51: South America Thermal Power Industry Revenue (USD Billion), by Fuel Type 2024 & 2032
- Figure 52: South America Thermal Power Industry Volume (Megawatt), by Fuel Type 2024 & 2032
- Figure 53: South America Thermal Power Industry Revenue Share (%), by Fuel Type 2024 & 2032
- Figure 54: South America Thermal Power Industry Volume Share (%), by Fuel Type 2024 & 2032
- Figure 55: South America Thermal Power Industry Revenue (USD Billion), by Country 2024 & 2032
- Figure 56: South America Thermal Power Industry Volume (Megawatt), by Country 2024 & 2032
- Figure 57: South America Thermal Power Industry Revenue Share (%), by Country 2024 & 2032
- Figure 58: South America Thermal Power Industry Volume Share (%), by Country 2024 & 2032
- Figure 59: Middle East and Africa Thermal Power Industry Revenue (USD Billion), by Fuel Type 2024 & 2032
- Figure 60: Middle East and Africa Thermal Power Industry Volume (Megawatt), by Fuel Type 2024 & 2032
- Figure 61: Middle East and Africa Thermal Power Industry Revenue Share (%), by Fuel Type 2024 & 2032
- Figure 62: Middle East and Africa Thermal Power Industry Volume Share (%), by Fuel Type 2024 & 2032
- Figure 63: Middle East and Africa Thermal Power Industry Revenue (USD Billion), by Country 2024 & 2032
- Figure 64: Middle East and Africa Thermal Power Industry Volume (Megawatt), by Country 2024 & 2032
- Figure 65: Middle East and Africa Thermal Power Industry Revenue Share (%), by Country 2024 & 2032
- Figure 66: Middle East and Africa Thermal Power Industry Volume Share (%), by Country 2024 & 2032
List of Tables
- Table 1: Global Thermal Power Industry Revenue USD Billion Forecast, by Region 2019 & 2032
- Table 2: Global Thermal Power Industry Volume Megawatt Forecast, by Region 2019 & 2032
- Table 3: Global Thermal Power Industry Revenue USD Billion Forecast, by Fuel Type 2019 & 2032
- Table 4: Global Thermal Power Industry Volume Megawatt Forecast, by Fuel Type 2019 & 2032
- Table 5: Global Thermal Power Industry Revenue USD Billion Forecast, by Region 2019 & 2032
- Table 6: Global Thermal Power Industry Volume Megawatt Forecast, by Region 2019 & 2032
- Table 7: Global Thermal Power Industry Revenue USD Billion Forecast, by Country 2019 & 2032
- Table 8: Global Thermal Power Industry Volume Megawatt Forecast, by Country 2019 & 2032
- Table 9: United States Thermal Power Industry Revenue (USD Billion) Forecast, by Application 2019 & 2032
- Table 10: United States Thermal Power Industry Volume (Megawatt) Forecast, by Application 2019 & 2032
- Table 11: Canada Thermal Power Industry Revenue (USD Billion) Forecast, by Application 2019 & 2032
- Table 12: Canada Thermal Power Industry Volume (Megawatt) Forecast, by Application 2019 & 2032
- Table 13: Mexico Thermal Power Industry Revenue (USD Billion) Forecast, by Application 2019 & 2032
- Table 14: Mexico Thermal Power Industry Volume (Megawatt) Forecast, by Application 2019 & 2032
- Table 15: Global Thermal Power Industry Revenue USD Billion Forecast, by Country 2019 & 2032
- Table 16: Global Thermal Power Industry Volume Megawatt Forecast, by Country 2019 & 2032
- Table 17: Germany Thermal Power Industry Revenue (USD Billion) Forecast, by Application 2019 & 2032
- Table 18: Germany Thermal Power Industry Volume (Megawatt) Forecast, by Application 2019 & 2032
- Table 19: United Kingdom Thermal Power Industry Revenue (USD Billion) Forecast, by Application 2019 & 2032
- Table 20: United Kingdom Thermal Power Industry Volume (Megawatt) Forecast, by Application 2019 & 2032
- Table 21: France Thermal Power Industry Revenue (USD Billion) Forecast, by Application 2019 & 2032
- Table 22: France Thermal Power Industry Volume (Megawatt) Forecast, by Application 2019 & 2032
- Table 23: Spain Thermal Power Industry Revenue (USD Billion) Forecast, by Application 2019 & 2032
- Table 24: Spain Thermal Power Industry Volume (Megawatt) Forecast, by Application 2019 & 2032
- Table 25: Italy Thermal Power Industry Revenue (USD Billion) Forecast, by Application 2019 & 2032
- Table 26: Italy Thermal Power Industry Volume (Megawatt) Forecast, by Application 2019 & 2032
- Table 27: Spain Thermal Power Industry Revenue (USD Billion) Forecast, by Application 2019 & 2032
- Table 28: Spain Thermal Power Industry Volume (Megawatt) Forecast, by Application 2019 & 2032
- Table 29: Belgium Thermal Power Industry Revenue (USD Billion) Forecast, by Application 2019 & 2032
- Table 30: Belgium Thermal Power Industry Volume (Megawatt) Forecast, by Application 2019 & 2032
- Table 31: Netherland Thermal Power Industry Revenue (USD Billion) Forecast, by Application 2019 & 2032
- Table 32: Netherland Thermal Power Industry Volume (Megawatt) Forecast, by Application 2019 & 2032
- Table 33: Nordics Thermal Power Industry Revenue (USD Billion) Forecast, by Application 2019 & 2032
- Table 34: Nordics Thermal Power Industry Volume (Megawatt) Forecast, by Application 2019 & 2032
- Table 35: Rest of Europe Thermal Power Industry Revenue (USD Billion) Forecast, by Application 2019 & 2032
- Table 36: Rest of Europe Thermal Power Industry Volume (Megawatt) Forecast, by Application 2019 & 2032
- Table 37: Global Thermal Power Industry Revenue USD Billion Forecast, by Country 2019 & 2032
- Table 38: Global Thermal Power Industry Volume Megawatt Forecast, by Country 2019 & 2032
- Table 39: China Thermal Power Industry Revenue (USD Billion) Forecast, by Application 2019 & 2032
- Table 40: China Thermal Power Industry Volume (Megawatt) Forecast, by Application 2019 & 2032
- Table 41: Japan Thermal Power Industry Revenue (USD Billion) Forecast, by Application 2019 & 2032
- Table 42: Japan Thermal Power Industry Volume (Megawatt) Forecast, by Application 2019 & 2032
- Table 43: India Thermal Power Industry Revenue (USD Billion) Forecast, by Application 2019 & 2032
- Table 44: India Thermal Power Industry Volume (Megawatt) Forecast, by Application 2019 & 2032
- Table 45: South Korea Thermal Power Industry Revenue (USD Billion) Forecast, by Application 2019 & 2032
- Table 46: South Korea Thermal Power Industry Volume (Megawatt) Forecast, by Application 2019 & 2032
- Table 47: Southeast Asia Thermal Power Industry Revenue (USD Billion) Forecast, by Application 2019 & 2032
- Table 48: Southeast Asia Thermal Power Industry Volume (Megawatt) Forecast, by Application 2019 & 2032
- Table 49: Australia Thermal Power Industry Revenue (USD Billion) Forecast, by Application 2019 & 2032
- Table 50: Australia Thermal Power Industry Volume (Megawatt) Forecast, by Application 2019 & 2032
- Table 51: Indonesia Thermal Power Industry Revenue (USD Billion) Forecast, by Application 2019 & 2032
- Table 52: Indonesia Thermal Power Industry Volume (Megawatt) Forecast, by Application 2019 & 2032
- Table 53: Phillipes Thermal Power Industry Revenue (USD Billion) Forecast, by Application 2019 & 2032
- Table 54: Phillipes Thermal Power Industry Volume (Megawatt) Forecast, by Application 2019 & 2032
- Table 55: Singapore Thermal Power Industry Revenue (USD Billion) Forecast, by Application 2019 & 2032
- Table 56: Singapore Thermal Power Industry Volume (Megawatt) Forecast, by Application 2019 & 2032
- Table 57: Thailandc Thermal Power Industry Revenue (USD Billion) Forecast, by Application 2019 & 2032
- Table 58: Thailandc Thermal Power Industry Volume (Megawatt) Forecast, by Application 2019 & 2032
- Table 59: Rest of Asia Pacific Thermal Power Industry Revenue (USD Billion) Forecast, by Application 2019 & 2032
- Table 60: Rest of Asia Pacific Thermal Power Industry Volume (Megawatt) Forecast, by Application 2019 & 2032
- Table 61: Global Thermal Power Industry Revenue USD Billion Forecast, by Country 2019 & 2032
- Table 62: Global Thermal Power Industry Volume Megawatt Forecast, by Country 2019 & 2032
- Table 63: Brazil Thermal Power Industry Revenue (USD Billion) Forecast, by Application 2019 & 2032
- Table 64: Brazil Thermal Power Industry Volume (Megawatt) Forecast, by Application 2019 & 2032
- Table 65: Argentina Thermal Power Industry Revenue (USD Billion) Forecast, by Application 2019 & 2032
- Table 66: Argentina Thermal Power Industry Volume (Megawatt) Forecast, by Application 2019 & 2032
- Table 67: Peru Thermal Power Industry Revenue (USD Billion) Forecast, by Application 2019 & 2032
- Table 68: Peru Thermal Power Industry Volume (Megawatt) Forecast, by Application 2019 & 2032
- Table 69: Chile Thermal Power Industry Revenue (USD Billion) Forecast, by Application 2019 & 2032
- Table 70: Chile Thermal Power Industry Volume (Megawatt) Forecast, by Application 2019 & 2032
- Table 71: Colombia Thermal Power Industry Revenue (USD Billion) Forecast, by Application 2019 & 2032
- Table 72: Colombia Thermal Power Industry Volume (Megawatt) Forecast, by Application 2019 & 2032
- Table 73: Ecuador Thermal Power Industry Revenue (USD Billion) Forecast, by Application 2019 & 2032
- Table 74: Ecuador Thermal Power Industry Volume (Megawatt) Forecast, by Application 2019 & 2032
- Table 75: Venezuela Thermal Power Industry Revenue (USD Billion) Forecast, by Application 2019 & 2032
- Table 76: Venezuela Thermal Power Industry Volume (Megawatt) Forecast, by Application 2019 & 2032
- Table 77: Rest of South America Thermal Power Industry Revenue (USD Billion) Forecast, by Application 2019 & 2032
- Table 78: Rest of South America Thermal Power Industry Volume (Megawatt) Forecast, by Application 2019 & 2032
- Table 79: Global Thermal Power Industry Revenue USD Billion Forecast, by Country 2019 & 2032
- Table 80: Global Thermal Power Industry Volume Megawatt Forecast, by Country 2019 & 2032
- Table 81: United States Thermal Power Industry Revenue (USD Billion) Forecast, by Application 2019 & 2032
- Table 82: United States Thermal Power Industry Volume (Megawatt) Forecast, by Application 2019 & 2032
- Table 83: Canada Thermal Power Industry Revenue (USD Billion) Forecast, by Application 2019 & 2032
- Table 84: Canada Thermal Power Industry Volume (Megawatt) Forecast, by Application 2019 & 2032
- Table 85: Mexico Thermal Power Industry Revenue (USD Billion) Forecast, by Application 2019 & 2032
- Table 86: Mexico Thermal Power Industry Volume (Megawatt) Forecast, by Application 2019 & 2032
- Table 87: Global Thermal Power Industry Revenue USD Billion Forecast, by Country 2019 & 2032
- Table 88: Global Thermal Power Industry Volume Megawatt Forecast, by Country 2019 & 2032
- Table 89: United Arab Emirates Thermal Power Industry Revenue (USD Billion) Forecast, by Application 2019 & 2032
- Table 90: United Arab Emirates Thermal Power Industry Volume (Megawatt) Forecast, by Application 2019 & 2032
- Table 91: Saudi Arabia Thermal Power Industry Revenue (USD Billion) Forecast, by Application 2019 & 2032
- Table 92: Saudi Arabia Thermal Power Industry Volume (Megawatt) Forecast, by Application 2019 & 2032
- Table 93: South Africa Thermal Power Industry Revenue (USD Billion) Forecast, by Application 2019 & 2032
- Table 94: South Africa Thermal Power Industry Volume (Megawatt) Forecast, by Application 2019 & 2032
- Table 95: Rest of Middle East and Africa Thermal Power Industry Revenue (USD Billion) Forecast, by Application 2019 & 2032
- Table 96: Rest of Middle East and Africa Thermal Power Industry Volume (Megawatt) Forecast, by Application 2019 & 2032
- Table 97: Global Thermal Power Industry Revenue USD Billion Forecast, by Fuel Type 2019 & 2032
- Table 98: Global Thermal Power Industry Volume Megawatt Forecast, by Fuel Type 2019 & 2032
- Table 99: Global Thermal Power Industry Revenue USD Billion Forecast, by Country 2019 & 2032
- Table 100: Global Thermal Power Industry Volume Megawatt Forecast, by Country 2019 & 2032
- Table 101: Global Thermal Power Industry Revenue USD Billion Forecast, by Fuel Type 2019 & 2032
- Table 102: Global Thermal Power Industry Volume Megawatt Forecast, by Fuel Type 2019 & 2032
- Table 103: Global Thermal Power Industry Revenue USD Billion Forecast, by Country 2019 & 2032
- Table 104: Global Thermal Power Industry Volume Megawatt Forecast, by Country 2019 & 2032
- Table 105: Global Thermal Power Industry Revenue USD Billion Forecast, by Fuel Type 2019 & 2032
- Table 106: Global Thermal Power Industry Volume Megawatt Forecast, by Fuel Type 2019 & 2032
- Table 107: Global Thermal Power Industry Revenue USD Billion Forecast, by Country 2019 & 2032
- Table 108: Global Thermal Power Industry Volume Megawatt Forecast, by Country 2019 & 2032
- Table 109: Global Thermal Power Industry Revenue USD Billion Forecast, by Fuel Type 2019 & 2032
- Table 110: Global Thermal Power Industry Volume Megawatt Forecast, by Fuel Type 2019 & 2032
- Table 111: Global Thermal Power Industry Revenue USD Billion Forecast, by Country 2019 & 2032
- Table 112: Global Thermal Power Industry Volume Megawatt Forecast, by Country 2019 & 2032
- Table 113: Global Thermal Power Industry Revenue USD Billion Forecast, by Fuel Type 2019 & 2032
- Table 114: Global Thermal Power Industry Volume Megawatt Forecast, by Fuel Type 2019 & 2032
- Table 115: Global Thermal Power Industry Revenue USD Billion Forecast, by Country 2019 & 2032
- Table 116: Global Thermal Power Industry Volume Megawatt Forecast, by Country 2019 & 2032
Frequently Asked Questions
1. What is the projected Compound Annual Growth Rate (CAGR) of the Thermal Power Industry?
The projected CAGR is approximately 3%.
2. Which companies are prominent players in the Thermal Power Industry?
Key companies in the market include Iberdrola S A, Electricite de France S A, Siemens AG, Tokyo Electric Power Company*List Not Exhaustive, ENGIE, National Thermal Power Corporation Limited, General Electric Company, Chubu Electric Power Co Inc, ABB , Bharat Heavy Electricals Limited (BHEL).
3. What are the main segments of the Thermal Power Industry?
The market segments include Fuel Type.
4. Can you provide details about the market size?
The market size is estimated to be USD 1,475.40 USD Billion as of 2022.
5. What are some drivers contributing to market growth?
4.; Increasing investment in the Midstream Sector4.; Increasing Production of Oil and Natural Gas.
6. What are the notable trends driving market growth?
Natural Gas Power Plants to Witness Significant Growth.
7. Are there any restraints impacting market growth?
4.; Inadequate Infrastructure in the Country.
8. Can you provide examples of recent developments in the market?
The development of new, more efficient thermal power technologies
9. What pricing options are available for accessing the report?
Pricing options include single-user, multi-user, and enterprise licenses priced at USD 4750, USD 5250, and USD 8750 respectively.
10. Is the market size provided in terms of value or volume?
The market size is provided in terms of value, measured in USD Billion and volume, measured in Megawatt.
11. Are there any specific market keywords associated with the report?
Yes, the market keyword associated with the report is "Thermal Power Industry," which aids in identifying and referencing the specific market segment covered.
12. How do I determine which pricing option suits my needs best?
The pricing options vary based on user requirements and access needs. Individual users may opt for single-user licenses, while businesses requiring broader access may choose multi-user or enterprise licenses for cost-effective access to the report.
13. Are there any additional resources or data provided in the Thermal Power Industry report?
While the report offers comprehensive insights, it's advisable to review the specific contents or supplementary materials provided to ascertain if additional resources or data are available.
14. How can I stay updated on further developments or reports in the Thermal Power Industry?
To stay informed about further developments, trends, and reports in the Thermal Power Industry, consider subscribing to industry newsletters, following relevant companies and organizations, or regularly checking reputable industry news sources and publications.
Methodology
Step 1 - Identification of Relevant Samples Size from Population Database


Step 2 - Approaches for Defining Global Market Size (Value, Volume* & Price*)

Note*: In applicable scenarios
Step 3 - Data Sources
Primary Research
- Web Analytics
- Survey Reports
- Research Institute
- Latest Research Reports
- Opinion Leaders
Secondary Research
- Annual Reports
- White Paper
- Latest Press Release
- Industry Association
- Paid Database
- Investor Presentations

Step 4 - Data Triangulation
Involves using different sources of information in order to increase the validity of a study
These sources are likely to be stakeholders in a program - participants, other researchers, program staff, other community members, and so on.
Then we put all data in single framework & apply various statistical tools to find out the dynamic on the market.
During the analysis stage, feedback from the stakeholder groups would be compared to determine areas of agreement as well as areas of divergence
