

Key Insights
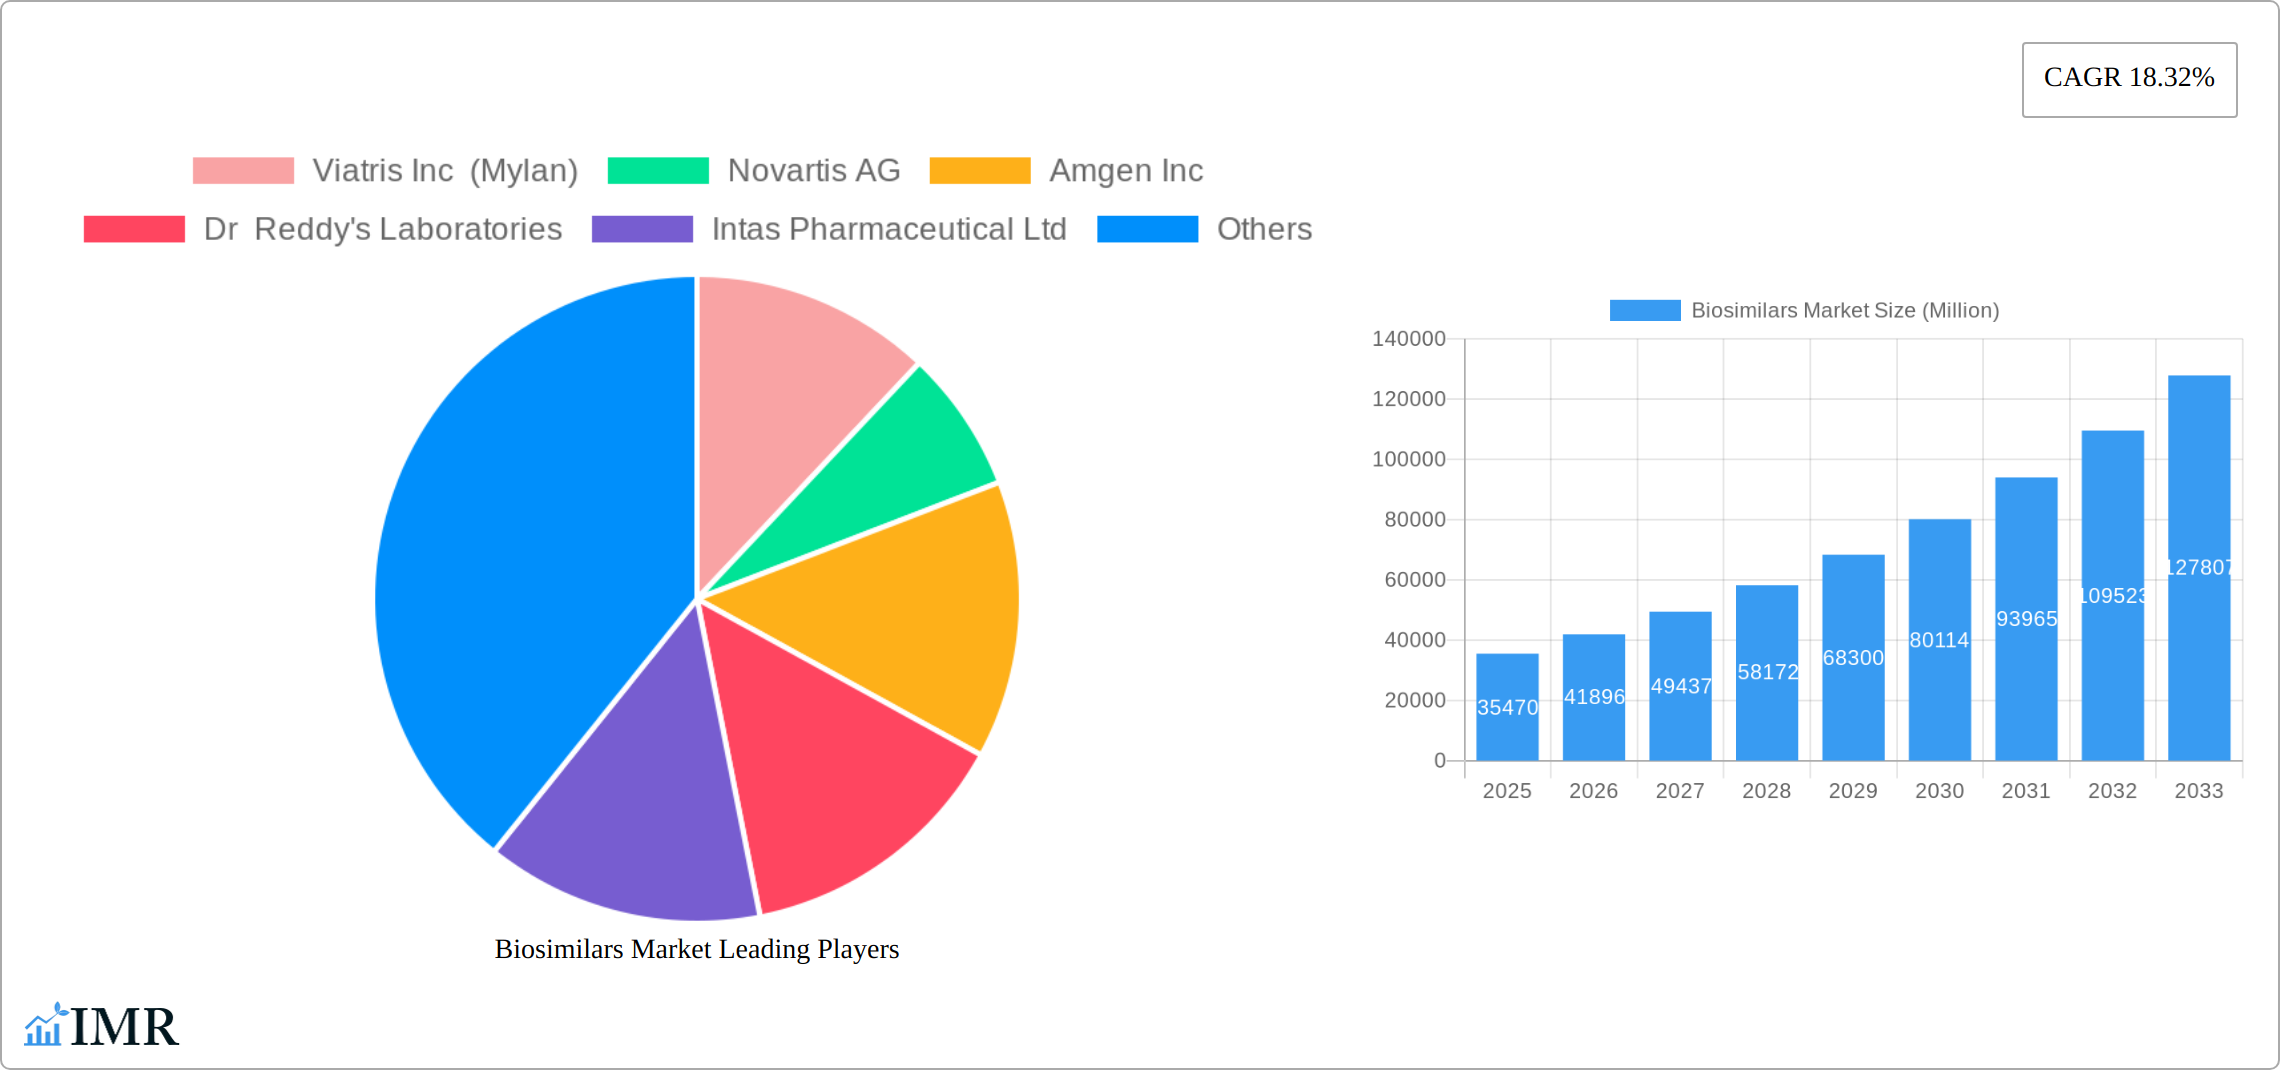
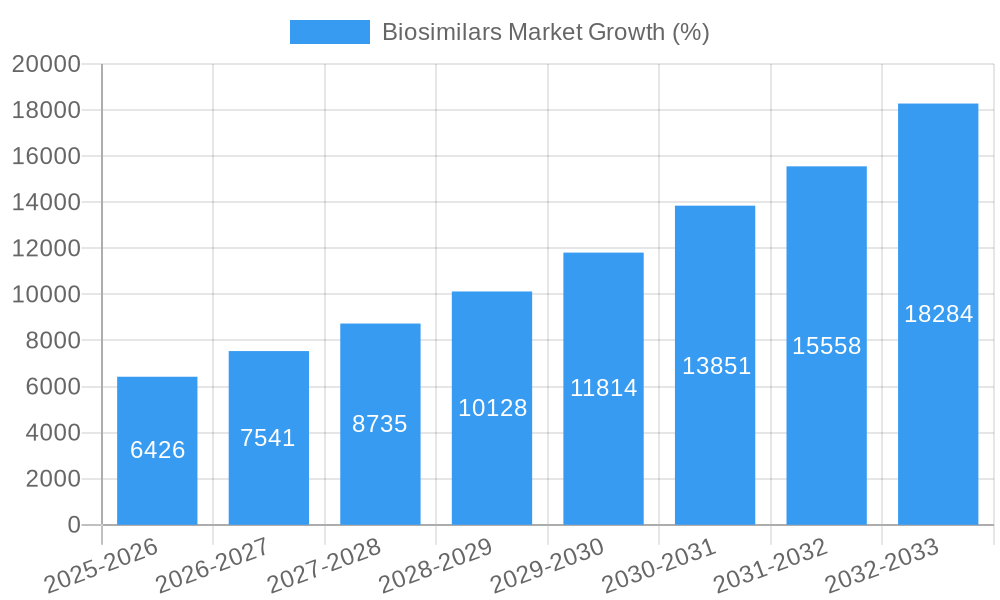
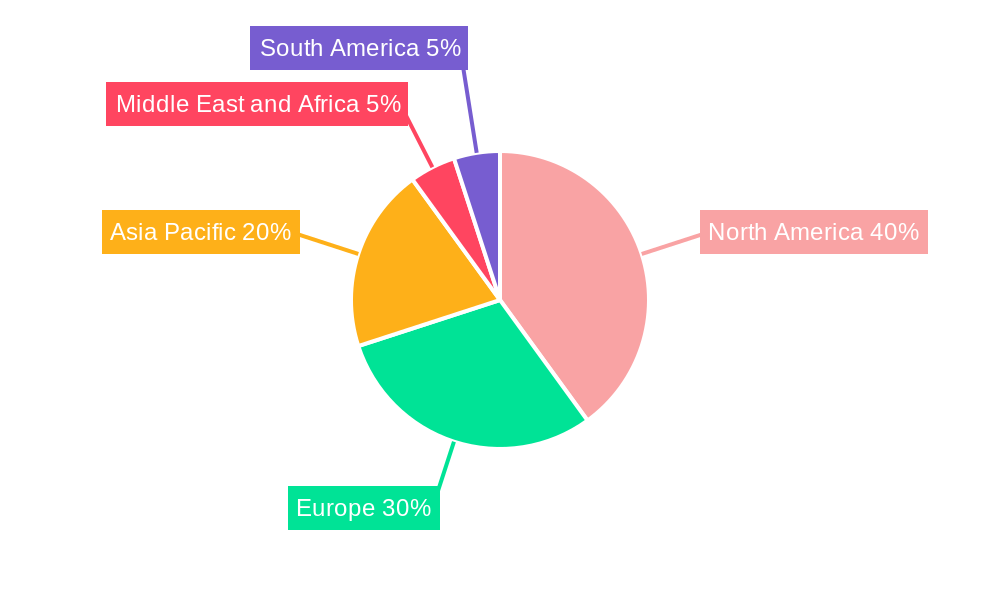
The biosimilars market, valued at $35.47 billion in 2025, is projected to experience robust growth, driven by increasing demand for cost-effective alternatives to expensive biologics. A compound annual growth rate (CAGR) of 18.32% from 2025 to 2033 indicates a significant market expansion, reaching an estimated $137.8 billion by 2033. This growth is fueled by several key factors. Firstly, the patent expirations of numerous blockbuster biologics are creating lucrative opportunities for biosimilar developers. Secondly, rising healthcare costs globally are putting pressure on governments and healthcare providers to adopt more affordable treatment options. Thirdly, advancements in biosimilar manufacturing technologies are leading to improved quality and efficacy, increasing patient and physician confidence. The market is segmented by product class (monoclonal antibodies, recombinant hormones, immunomodulators, anti-inflammatory agents, and others) and application (blood disorders, growth hormonal deficiency, chronic and autoimmune disorders, oncology, and others). Monoclonal antibodies currently dominate the market, reflecting their widespread use across various therapeutic areas. Geographical growth is expected to be strong across all regions, with North America and Europe maintaining significant market shares due to established healthcare infrastructures and high biosimilar adoption rates. However, rapidly developing economies in Asia-Pacific are poised for substantial growth, fueled by increasing healthcare spending and a rising prevalence of chronic diseases.
The competitive landscape is fiercely competitive, with numerous established pharmaceutical companies and emerging biosimilar developers vying for market share. Key players include Viatris Inc, Novartis AG, Amgen Inc, Dr Reddy's Laboratories, and others. These companies are strategically investing in research and development to develop and commercialize a diverse portfolio of biosimilars, focusing on both established and emerging therapeutic areas. Despite the promising outlook, the market faces certain challenges. Regulatory hurdles and the need for rigorous clinical trials can delay biosimilar approvals and increase development costs. Furthermore, establishing biosimilar interchangeability with reference biologics remains a crucial factor influencing market penetration. Overall, the biosimilars market presents significant opportunities for growth, driven by increasing demand, technological advancements, and supportive regulatory frameworks, while navigating regulatory complexities and competition.
Biosimilars Market: A Comprehensive Report (2019-2033)
This comprehensive report provides a detailed analysis of the Biosimilars market, encompassing market dynamics, growth trends, regional segmentation, product landscape, key players, and future outlook. The study period covers 2019-2033, with 2025 as the base and estimated year. The report offers valuable insights for industry professionals, investors, and stakeholders seeking to navigate this rapidly evolving market. The total market size in 2025 is estimated at xx Million Units.
Biosimilars Market Dynamics & Structure
The biosimilars market is characterized by a moderately concentrated structure, with key players like Amgen, Novartis, and Samsung Bioepis holding significant market share. However, the entry of numerous generic pharmaceutical companies is increasing competition. Technological innovation, particularly in biomanufacturing and analytical techniques, is a major growth driver. Stringent regulatory frameworks, including biosimilarity assessments, present both challenges and opportunities. The market witnesses substantial M&A activity, with larger companies acquiring smaller biosimilar developers to expand their portfolios. Substitutes, primarily originator biologics, continue to compete, though biosimilars offer cost advantages.
- Market Concentration: Moderately concentrated, with top 5 players holding approximately xx% of the market share in 2025.
- Technological Innovation: Advancements in biomanufacturing (e.g., single-use technologies) are lowering production costs.
- Regulatory Landscape: Stringent regulatory approvals influence market entry and expansion.
- Competitive Landscape: Intense competition among established players and emerging biosimilar developers.
- M&A Activity: xx M&A deals were observed between 2019 and 2024, with an average deal value of xx Million units.
- End-User Demographics: Growing elderly population fuels demand for biologics and biosimilars.
Biosimilars Market Growth Trends & Insights
The biosimilars market exhibits robust growth, driven by increasing demand for cost-effective alternatives to originator biologics. The market size has witnessed a Compound Annual Growth Rate (CAGR) of xx% during the historical period (2019-2024) and is projected to grow at a CAGR of xx% during the forecast period (2025-2033). This growth is fueled by factors such as patent expirations of blockbuster biologics, increasing healthcare expenditure, and growing awareness among healthcare professionals and patients. Technological advancements, including the development of next-generation biosimilars, further accelerate market expansion. Consumer behavior shifts toward cost-conscious healthcare choices also contribute to market growth. Market penetration is expected to reach xx% by 2033.
Dominant Regions, Countries, or Segments in Biosimilars Market
North America currently dominates the biosimilars market due to high biologics consumption, robust regulatory frameworks, and significant investments in research and development. Within this region, the US is the largest market. Europe is another key region, exhibiting strong growth driven by government initiatives promoting biosimilar adoption and increasing healthcare expenditure. In terms of product class, Monoclonal Antibodies constitute the largest segment, followed by Recombinant Hormones. Within applications, Oncology and Chronic and Autoimmune Disorders are the leading segments.
- North America: High biologics consumption and established regulatory frameworks drive market dominance.
- Europe: Government policies supporting biosimilar adoption boost market growth.
- Monoclonal Antibodies: Largest product class segment due to the wide range of applications and high demand.
- Oncology & Chronic and Autoimmune Disorders: Significant demand in these therapeutic areas drive substantial market growth.
- Emerging Markets: Significant growth potential exists in developing economies due to rising healthcare spending.
Biosimilars Market Product Landscape
The biosimilars market features a diverse range of products, spanning various therapeutic areas. Continuous innovation focuses on enhancing biosimilar efficacy, safety, and manufacturing processes. Companies are developing next-generation biosimilars with improved characteristics compared to originator biologics. Key product differentiators include superior pharmacokinetic profiles, reduced immunogenicity, and cost-effectiveness.
Key Drivers, Barriers & Challenges in Biosimilars Market
Key Drivers:
- Increasing patent expiries of blockbuster biologics.
- Growing healthcare expenditure and cost-containment pressures.
- Rising prevalence of chronic diseases.
- Favorable regulatory frameworks in key markets.
Key Challenges:
- Regulatory hurdles and lengthy approval processes.
- Concerns regarding biosimilar efficacy and safety compared to originator biologics.
- Competition from originator biologics and pricing pressures.
- Supply chain complexities and manufacturing challenges.
Emerging Opportunities in Biosimilars Market
- Expanding into untapped markets in developing economies.
- Development of innovative biosimilars targeting unmet medical needs.
- Leveraging personalized medicine approaches to optimize biosimilar efficacy.
- Strategic partnerships and collaborations between biosimilar developers and pharmaceutical companies.
Growth Accelerators in the Biosimilars Market Industry
Technological breakthroughs in biomanufacturing, particularly in reducing production costs and improving quality, are major growth catalysts. Strategic partnerships, including collaborations between originator companies and biosimilar developers, facilitate market entry and expand product portfolios. Market expansion into emerging economies offers substantial growth potential, driven by rising healthcare spending and increased demand for affordable therapies.
Key Players Shaping the Biosimilars Market Market
- Viatris Inc (Mylan)
- Novartis AG
- Amgen Inc
- Dr Reddy's Laboratories
- Intas Pharmaceutical Ltd
- Coherus Biosciences Inc
- Samsung Bioepis Co Ltd
- Eli Lilly and Company
- LG Life Sciences (LG Chem)
- Biocad
- Teva Pharmaceutical Industries Ltd
- Celltrion Healthcare
- Stada Arzneimittel AG
- Biocon Limited
- Pfizer Inc
Notable Milestones in Biosimilars Market Sector
- May 2022: Amneal Pharmaceuticals receives FDA approval for FYLNETRA (pegfilgrastim-pbbk), a biosimilar to Neulasta.
- September 2021: Samsung Bioepis and Biogen receive FDA approval for BYOOVIZ (ranibizumab-nuna), the first ophthalmology biosimilar approved in the US.
In-Depth Biosimilars Market Market Outlook
The biosimilars market is poised for continued robust growth, driven by the factors outlined above. Strategic investments in research and development, coupled with expanding market penetration, will fuel long-term growth. Opportunities abound for companies that can successfully navigate regulatory hurdles, address concerns regarding biosimilar efficacy and safety, and offer cost-effective treatment options to patients. The market presents significant potential for both established players and emerging entrants.
Biosimilars Market Segmentation
-
1. Product Class
- 1.1. Monoclonal Antibodies
- 1.2. Recombinant Hormones
- 1.3. Immunomodulators
- 1.4. Anti-Inflammatory Agents
- 1.5. Other Product Classes
-
2. Application
- 2.1. Blood Disorders
- 2.2. Growth Hormonal Deficiency
- 2.3. Chronic and Autoimmune Disorders
- 2.4. Oncology
- 2.5. Other Applications
Biosimilars Market Segmentation By Geography
-
1. North America
- 1.1. United States
- 1.2. Canada
- 1.3. Mexico
-
2. Europe
- 2.1. Germany
- 2.2. United Kingdom
- 2.3. France
- 2.4. Italy
- 2.5. Spain
- 2.6. Rest of Europe
-
3. Asia Pacific
- 3.1. China
- 3.2. Japan
- 3.3. India
- 3.4. Australia
- 3.5. South Korea
- 3.6. Rest of Asia Pacific
-
4. Middle East and Africa
- 4.1. GCC
- 4.2. South Africa
- 4.3. Rest of Middle East and Africa
-
5. South America
- 5.1. Brazil
- 5.2. Argentina
- 5.3. Rest of South America
Biosimilars Market REPORT HIGHLIGHTS
| Aspects | Details |
|---|---|
| Study Period | 2019-2033 |
| Base Year | 2024 |
| Estimated Year | 2025 |
| Forecast Period | 2025-2033 |
| Historical Period | 2019-2024 |
| Growth Rate | CAGR of 18.32% from 2019-2033 |
| Segmentation |
|
Table of Contents
- 1. Introduction
- 1.1. Research Scope
- 1.2. Market Segmentation
- 1.3. Research Methodology
- 1.4. Definitions and Assumptions
- 2. Executive Summary
- 2.1. Introduction
- 3. Market Dynamics
- 3.1. Introduction
- 3.2. Market Drivers
- 3.2.1. Several Blockbuster Biopharmaceuticals Going Off-patent over the Next Five to Ten Years; Growing Burden of Chronic Diseases and Increasing R&D Investments; Increasing Demand for Biosimilar Drugs Due to Their Cost Effectiveness
- 3.3. Market Restrains
- 3.3.1. Concerns Regarding Substitutability and Interchangeability; Regulatory Uncertainty and Growing Competition from Biobetters; High Cost Involvement and Complexities in Manufacturing
- 3.4. Market Trends
- 3.4.1. The Oncology Segment Holds the Major Share in the Global Biosimilars Industry
- 4. Market Factor Analysis
- 4.1. Porters Five Forces
- 4.2. Supply/Value Chain
- 4.3. PESTEL analysis
- 4.4. Market Entropy
- 4.5. Patent/Trademark Analysis
- 5. Global Biosimilars Market Analysis, Insights and Forecast, 2019-2031
- 5.1. Market Analysis, Insights and Forecast - by Product Class
- 5.1.1. Monoclonal Antibodies
- 5.1.2. Recombinant Hormones
- 5.1.3. Immunomodulators
- 5.1.4. Anti-Inflammatory Agents
- 5.1.5. Other Product Classes
- 5.2. Market Analysis, Insights and Forecast - by Application
- 5.2.1. Blood Disorders
- 5.2.2. Growth Hormonal Deficiency
- 5.2.3. Chronic and Autoimmune Disorders
- 5.2.4. Oncology
- 5.2.5. Other Applications
- 5.3. Market Analysis, Insights and Forecast - by Region
- 5.3.1. North America
- 5.3.2. Europe
- 5.3.3. Asia Pacific
- 5.3.4. Middle East and Africa
- 5.3.5. South America
- 5.1. Market Analysis, Insights and Forecast - by Product Class
- 6. North America Biosimilars Market Analysis, Insights and Forecast, 2019-2031
- 6.1. Market Analysis, Insights and Forecast - by Product Class
- 6.1.1. Monoclonal Antibodies
- 6.1.2. Recombinant Hormones
- 6.1.3. Immunomodulators
- 6.1.4. Anti-Inflammatory Agents
- 6.1.5. Other Product Classes
- 6.2. Market Analysis, Insights and Forecast - by Application
- 6.2.1. Blood Disorders
- 6.2.2. Growth Hormonal Deficiency
- 6.2.3. Chronic and Autoimmune Disorders
- 6.2.4. Oncology
- 6.2.5. Other Applications
- 6.1. Market Analysis, Insights and Forecast - by Product Class
- 7. Europe Biosimilars Market Analysis, Insights and Forecast, 2019-2031
- 7.1. Market Analysis, Insights and Forecast - by Product Class
- 7.1.1. Monoclonal Antibodies
- 7.1.2. Recombinant Hormones
- 7.1.3. Immunomodulators
- 7.1.4. Anti-Inflammatory Agents
- 7.1.5. Other Product Classes
- 7.2. Market Analysis, Insights and Forecast - by Application
- 7.2.1. Blood Disorders
- 7.2.2. Growth Hormonal Deficiency
- 7.2.3. Chronic and Autoimmune Disorders
- 7.2.4. Oncology
- 7.2.5. Other Applications
- 7.1. Market Analysis, Insights and Forecast - by Product Class
- 8. Asia Pacific Biosimilars Market Analysis, Insights and Forecast, 2019-2031
- 8.1. Market Analysis, Insights and Forecast - by Product Class
- 8.1.1. Monoclonal Antibodies
- 8.1.2. Recombinant Hormones
- 8.1.3. Immunomodulators
- 8.1.4. Anti-Inflammatory Agents
- 8.1.5. Other Product Classes
- 8.2. Market Analysis, Insights and Forecast - by Application
- 8.2.1. Blood Disorders
- 8.2.2. Growth Hormonal Deficiency
- 8.2.3. Chronic and Autoimmune Disorders
- 8.2.4. Oncology
- 8.2.5. Other Applications
- 8.1. Market Analysis, Insights and Forecast - by Product Class
- 9. Middle East and Africa Biosimilars Market Analysis, Insights and Forecast, 2019-2031
- 9.1. Market Analysis, Insights and Forecast - by Product Class
- 9.1.1. Monoclonal Antibodies
- 9.1.2. Recombinant Hormones
- 9.1.3. Immunomodulators
- 9.1.4. Anti-Inflammatory Agents
- 9.1.5. Other Product Classes
- 9.2. Market Analysis, Insights and Forecast - by Application
- 9.2.1. Blood Disorders
- 9.2.2. Growth Hormonal Deficiency
- 9.2.3. Chronic and Autoimmune Disorders
- 9.2.4. Oncology
- 9.2.5. Other Applications
- 9.1. Market Analysis, Insights and Forecast - by Product Class
- 10. South America Biosimilars Market Analysis, Insights and Forecast, 2019-2031
- 10.1. Market Analysis, Insights and Forecast - by Product Class
- 10.1.1. Monoclonal Antibodies
- 10.1.2. Recombinant Hormones
- 10.1.3. Immunomodulators
- 10.1.4. Anti-Inflammatory Agents
- 10.1.5. Other Product Classes
- 10.2. Market Analysis, Insights and Forecast - by Application
- 10.2.1. Blood Disorders
- 10.2.2. Growth Hormonal Deficiency
- 10.2.3. Chronic and Autoimmune Disorders
- 10.2.4. Oncology
- 10.2.5. Other Applications
- 10.1. Market Analysis, Insights and Forecast - by Product Class
- 11. North America Biosimilars Market Analysis, Insights and Forecast, 2019-2031
- 11.1. Market Analysis, Insights and Forecast - By Country/Sub-region
- 11.1.1 United States
- 11.1.2 Canada
- 11.1.3 Mexico
- 12. Europe Biosimilars Market Analysis, Insights and Forecast, 2019-2031
- 12.1. Market Analysis, Insights and Forecast - By Country/Sub-region
- 12.1.1 Germany
- 12.1.2 United Kingdom
- 12.1.3 France
- 12.1.4 Italy
- 12.1.5 Spain
- 12.1.6 Rest of Europe
- 13. Asia Pacific Biosimilars Market Analysis, Insights and Forecast, 2019-2031
- 13.1. Market Analysis, Insights and Forecast - By Country/Sub-region
- 13.1.1 China
- 13.1.2 Japan
- 13.1.3 India
- 13.1.4 Australia
- 13.1.5 South Korea
- 13.1.6 Rest of Asia Pacific
- 14. Middle East and Africa Biosimilars Market Analysis, Insights and Forecast, 2019-2031
- 14.1. Market Analysis, Insights and Forecast - By Country/Sub-region
- 14.1.1 GCC
- 14.1.2 South Africa
- 14.1.3 Rest of Middle East and Africa
- 15. South America Biosimilars Market Analysis, Insights and Forecast, 2019-2031
- 15.1. Market Analysis, Insights and Forecast - By Country/Sub-region
- 15.1.1 Brazil
- 15.1.2 Argentina
- 15.1.3 Rest of South America
- 16. Competitive Analysis
- 16.1. Global Market Share Analysis 2024
- 16.2. Company Profiles
- 16.2.1 Viatris Inc (Mylan)
- 16.2.1.1. Overview
- 16.2.1.2. Products
- 16.2.1.3. SWOT Analysis
- 16.2.1.4. Recent Developments
- 16.2.1.5. Financials (Based on Availability)
- 16.2.2 Novartis AG
- 16.2.2.1. Overview
- 16.2.2.2. Products
- 16.2.2.3. SWOT Analysis
- 16.2.2.4. Recent Developments
- 16.2.2.5. Financials (Based on Availability)
- 16.2.3 Amgen Inc
- 16.2.3.1. Overview
- 16.2.3.2. Products
- 16.2.3.3. SWOT Analysis
- 16.2.3.4. Recent Developments
- 16.2.3.5. Financials (Based on Availability)
- 16.2.4 Dr Reddy's Laboratories
- 16.2.4.1. Overview
- 16.2.4.2. Products
- 16.2.4.3. SWOT Analysis
- 16.2.4.4. Recent Developments
- 16.2.4.5. Financials (Based on Availability)
- 16.2.5 Intas Pharmaceutical Ltd
- 16.2.5.1. Overview
- 16.2.5.2. Products
- 16.2.5.3. SWOT Analysis
- 16.2.5.4. Recent Developments
- 16.2.5.5. Financials (Based on Availability)
- 16.2.6 Coherus Biosciences Inc
- 16.2.6.1. Overview
- 16.2.6.2. Products
- 16.2.6.3. SWOT Analysis
- 16.2.6.4. Recent Developments
- 16.2.6.5. Financials (Based on Availability)
- 16.2.7 Samsung Bioepis Co Ltd
- 16.2.7.1. Overview
- 16.2.7.2. Products
- 16.2.7.3. SWOT Analysis
- 16.2.7.4. Recent Developments
- 16.2.7.5. Financials (Based on Availability)
- 16.2.8 Eli Lilly and Company
- 16.2.8.1. Overview
- 16.2.8.2. Products
- 16.2.8.3. SWOT Analysis
- 16.2.8.4. Recent Developments
- 16.2.8.5. Financials (Based on Availability)
- 16.2.9 LG Life Sciences (LG Chem)
- 16.2.9.1. Overview
- 16.2.9.2. Products
- 16.2.9.3. SWOT Analysis
- 16.2.9.4. Recent Developments
- 16.2.9.5. Financials (Based on Availability)
- 16.2.10 Biocad
- 16.2.10.1. Overview
- 16.2.10.2. Products
- 16.2.10.3. SWOT Analysis
- 16.2.10.4. Recent Developments
- 16.2.10.5. Financials (Based on Availability)
- 16.2.11 Teva Pharmaceutical Industries Ltd
- 16.2.11.1. Overview
- 16.2.11.2. Products
- 16.2.11.3. SWOT Analysis
- 16.2.11.4. Recent Developments
- 16.2.11.5. Financials (Based on Availability)
- 16.2.12 Celltrion Healthcare
- 16.2.12.1. Overview
- 16.2.12.2. Products
- 16.2.12.3. SWOT Analysis
- 16.2.12.4. Recent Developments
- 16.2.12.5. Financials (Based on Availability)
- 16.2.13 Stada Arzneimittel AG
- 16.2.13.1. Overview
- 16.2.13.2. Products
- 16.2.13.3. SWOT Analysis
- 16.2.13.4. Recent Developments
- 16.2.13.5. Financials (Based on Availability)
- 16.2.14 Biocon Limited
- 16.2.14.1. Overview
- 16.2.14.2. Products
- 16.2.14.3. SWOT Analysis
- 16.2.14.4. Recent Developments
- 16.2.14.5. Financials (Based on Availability)
- 16.2.15 Pfizer Inc
- 16.2.15.1. Overview
- 16.2.15.2. Products
- 16.2.15.3. SWOT Analysis
- 16.2.15.4. Recent Developments
- 16.2.15.5. Financials (Based on Availability)
- 16.2.1 Viatris Inc (Mylan)
List of Figures
- Figure 1: Global Biosimilars Market Revenue Breakdown (Million, %) by Region 2024 & 2032
- Figure 2: Global Biosimilars Market Volume Breakdown (K Unit, %) by Region 2024 & 2032
- Figure 3: North America Biosimilars Market Revenue (Million), by Country 2024 & 2032
- Figure 4: North America Biosimilars Market Volume (K Unit), by Country 2024 & 2032
- Figure 5: North America Biosimilars Market Revenue Share (%), by Country 2024 & 2032
- Figure 6: North America Biosimilars Market Volume Share (%), by Country 2024 & 2032
- Figure 7: Europe Biosimilars Market Revenue (Million), by Country 2024 & 2032
- Figure 8: Europe Biosimilars Market Volume (K Unit), by Country 2024 & 2032
- Figure 9: Europe Biosimilars Market Revenue Share (%), by Country 2024 & 2032
- Figure 10: Europe Biosimilars Market Volume Share (%), by Country 2024 & 2032
- Figure 11: Asia Pacific Biosimilars Market Revenue (Million), by Country 2024 & 2032
- Figure 12: Asia Pacific Biosimilars Market Volume (K Unit), by Country 2024 & 2032
- Figure 13: Asia Pacific Biosimilars Market Revenue Share (%), by Country 2024 & 2032
- Figure 14: Asia Pacific Biosimilars Market Volume Share (%), by Country 2024 & 2032
- Figure 15: Middle East and Africa Biosimilars Market Revenue (Million), by Country 2024 & 2032
- Figure 16: Middle East and Africa Biosimilars Market Volume (K Unit), by Country 2024 & 2032
- Figure 17: Middle East and Africa Biosimilars Market Revenue Share (%), by Country 2024 & 2032
- Figure 18: Middle East and Africa Biosimilars Market Volume Share (%), by Country 2024 & 2032
- Figure 19: South America Biosimilars Market Revenue (Million), by Country 2024 & 2032
- Figure 20: South America Biosimilars Market Volume (K Unit), by Country 2024 & 2032
- Figure 21: South America Biosimilars Market Revenue Share (%), by Country 2024 & 2032
- Figure 22: South America Biosimilars Market Volume Share (%), by Country 2024 & 2032
- Figure 23: North America Biosimilars Market Revenue (Million), by Product Class 2024 & 2032
- Figure 24: North America Biosimilars Market Volume (K Unit), by Product Class 2024 & 2032
- Figure 25: North America Biosimilars Market Revenue Share (%), by Product Class 2024 & 2032
- Figure 26: North America Biosimilars Market Volume Share (%), by Product Class 2024 & 2032
- Figure 27: North America Biosimilars Market Revenue (Million), by Application 2024 & 2032
- Figure 28: North America Biosimilars Market Volume (K Unit), by Application 2024 & 2032
- Figure 29: North America Biosimilars Market Revenue Share (%), by Application 2024 & 2032
- Figure 30: North America Biosimilars Market Volume Share (%), by Application 2024 & 2032
- Figure 31: North America Biosimilars Market Revenue (Million), by Country 2024 & 2032
- Figure 32: North America Biosimilars Market Volume (K Unit), by Country 2024 & 2032
- Figure 33: North America Biosimilars Market Revenue Share (%), by Country 2024 & 2032
- Figure 34: North America Biosimilars Market Volume Share (%), by Country 2024 & 2032
- Figure 35: Europe Biosimilars Market Revenue (Million), by Product Class 2024 & 2032
- Figure 36: Europe Biosimilars Market Volume (K Unit), by Product Class 2024 & 2032
- Figure 37: Europe Biosimilars Market Revenue Share (%), by Product Class 2024 & 2032
- Figure 38: Europe Biosimilars Market Volume Share (%), by Product Class 2024 & 2032
- Figure 39: Europe Biosimilars Market Revenue (Million), by Application 2024 & 2032
- Figure 40: Europe Biosimilars Market Volume (K Unit), by Application 2024 & 2032
- Figure 41: Europe Biosimilars Market Revenue Share (%), by Application 2024 & 2032
- Figure 42: Europe Biosimilars Market Volume Share (%), by Application 2024 & 2032
- Figure 43: Europe Biosimilars Market Revenue (Million), by Country 2024 & 2032
- Figure 44: Europe Biosimilars Market Volume (K Unit), by Country 2024 & 2032
- Figure 45: Europe Biosimilars Market Revenue Share (%), by Country 2024 & 2032
- Figure 46: Europe Biosimilars Market Volume Share (%), by Country 2024 & 2032
- Figure 47: Asia Pacific Biosimilars Market Revenue (Million), by Product Class 2024 & 2032
- Figure 48: Asia Pacific Biosimilars Market Volume (K Unit), by Product Class 2024 & 2032
- Figure 49: Asia Pacific Biosimilars Market Revenue Share (%), by Product Class 2024 & 2032
- Figure 50: Asia Pacific Biosimilars Market Volume Share (%), by Product Class 2024 & 2032
- Figure 51: Asia Pacific Biosimilars Market Revenue (Million), by Application 2024 & 2032
- Figure 52: Asia Pacific Biosimilars Market Volume (K Unit), by Application 2024 & 2032
- Figure 53: Asia Pacific Biosimilars Market Revenue Share (%), by Application 2024 & 2032
- Figure 54: Asia Pacific Biosimilars Market Volume Share (%), by Application 2024 & 2032
- Figure 55: Asia Pacific Biosimilars Market Revenue (Million), by Country 2024 & 2032
- Figure 56: Asia Pacific Biosimilars Market Volume (K Unit), by Country 2024 & 2032
- Figure 57: Asia Pacific Biosimilars Market Revenue Share (%), by Country 2024 & 2032
- Figure 58: Asia Pacific Biosimilars Market Volume Share (%), by Country 2024 & 2032
- Figure 59: Middle East and Africa Biosimilars Market Revenue (Million), by Product Class 2024 & 2032
- Figure 60: Middle East and Africa Biosimilars Market Volume (K Unit), by Product Class 2024 & 2032
- Figure 61: Middle East and Africa Biosimilars Market Revenue Share (%), by Product Class 2024 & 2032
- Figure 62: Middle East and Africa Biosimilars Market Volume Share (%), by Product Class 2024 & 2032
- Figure 63: Middle East and Africa Biosimilars Market Revenue (Million), by Application 2024 & 2032
- Figure 64: Middle East and Africa Biosimilars Market Volume (K Unit), by Application 2024 & 2032
- Figure 65: Middle East and Africa Biosimilars Market Revenue Share (%), by Application 2024 & 2032
- Figure 66: Middle East and Africa Biosimilars Market Volume Share (%), by Application 2024 & 2032
- Figure 67: Middle East and Africa Biosimilars Market Revenue (Million), by Country 2024 & 2032
- Figure 68: Middle East and Africa Biosimilars Market Volume (K Unit), by Country 2024 & 2032
- Figure 69: Middle East and Africa Biosimilars Market Revenue Share (%), by Country 2024 & 2032
- Figure 70: Middle East and Africa Biosimilars Market Volume Share (%), by Country 2024 & 2032
- Figure 71: South America Biosimilars Market Revenue (Million), by Product Class 2024 & 2032
- Figure 72: South America Biosimilars Market Volume (K Unit), by Product Class 2024 & 2032
- Figure 73: South America Biosimilars Market Revenue Share (%), by Product Class 2024 & 2032
- Figure 74: South America Biosimilars Market Volume Share (%), by Product Class 2024 & 2032
- Figure 75: South America Biosimilars Market Revenue (Million), by Application 2024 & 2032
- Figure 76: South America Biosimilars Market Volume (K Unit), by Application 2024 & 2032
- Figure 77: South America Biosimilars Market Revenue Share (%), by Application 2024 & 2032
- Figure 78: South America Biosimilars Market Volume Share (%), by Application 2024 & 2032
- Figure 79: South America Biosimilars Market Revenue (Million), by Country 2024 & 2032
- Figure 80: South America Biosimilars Market Volume (K Unit), by Country 2024 & 2032
- Figure 81: South America Biosimilars Market Revenue Share (%), by Country 2024 & 2032
- Figure 82: South America Biosimilars Market Volume Share (%), by Country 2024 & 2032
List of Tables
- Table 1: Global Biosimilars Market Revenue Million Forecast, by Region 2019 & 2032
- Table 2: Global Biosimilars Market Volume K Unit Forecast, by Region 2019 & 2032
- Table 3: Global Biosimilars Market Revenue Million Forecast, by Product Class 2019 & 2032
- Table 4: Global Biosimilars Market Volume K Unit Forecast, by Product Class 2019 & 2032
- Table 5: Global Biosimilars Market Revenue Million Forecast, by Application 2019 & 2032
- Table 6: Global Biosimilars Market Volume K Unit Forecast, by Application 2019 & 2032
- Table 7: Global Biosimilars Market Revenue Million Forecast, by Region 2019 & 2032
- Table 8: Global Biosimilars Market Volume K Unit Forecast, by Region 2019 & 2032
- Table 9: Global Biosimilars Market Revenue Million Forecast, by Country 2019 & 2032
- Table 10: Global Biosimilars Market Volume K Unit Forecast, by Country 2019 & 2032
- Table 11: United States Biosimilars Market Revenue (Million) Forecast, by Application 2019 & 2032
- Table 12: United States Biosimilars Market Volume (K Unit) Forecast, by Application 2019 & 2032
- Table 13: Canada Biosimilars Market Revenue (Million) Forecast, by Application 2019 & 2032
- Table 14: Canada Biosimilars Market Volume (K Unit) Forecast, by Application 2019 & 2032
- Table 15: Mexico Biosimilars Market Revenue (Million) Forecast, by Application 2019 & 2032
- Table 16: Mexico Biosimilars Market Volume (K Unit) Forecast, by Application 2019 & 2032
- Table 17: Global Biosimilars Market Revenue Million Forecast, by Country 2019 & 2032
- Table 18: Global Biosimilars Market Volume K Unit Forecast, by Country 2019 & 2032
- Table 19: Germany Biosimilars Market Revenue (Million) Forecast, by Application 2019 & 2032
- Table 20: Germany Biosimilars Market Volume (K Unit) Forecast, by Application 2019 & 2032
- Table 21: United Kingdom Biosimilars Market Revenue (Million) Forecast, by Application 2019 & 2032
- Table 22: United Kingdom Biosimilars Market Volume (K Unit) Forecast, by Application 2019 & 2032
- Table 23: France Biosimilars Market Revenue (Million) Forecast, by Application 2019 & 2032
- Table 24: France Biosimilars Market Volume (K Unit) Forecast, by Application 2019 & 2032
- Table 25: Italy Biosimilars Market Revenue (Million) Forecast, by Application 2019 & 2032
- Table 26: Italy Biosimilars Market Volume (K Unit) Forecast, by Application 2019 & 2032
- Table 27: Spain Biosimilars Market Revenue (Million) Forecast, by Application 2019 & 2032
- Table 28: Spain Biosimilars Market Volume (K Unit) Forecast, by Application 2019 & 2032
- Table 29: Rest of Europe Biosimilars Market Revenue (Million) Forecast, by Application 2019 & 2032
- Table 30: Rest of Europe Biosimilars Market Volume (K Unit) Forecast, by Application 2019 & 2032
- Table 31: Global Biosimilars Market Revenue Million Forecast, by Country 2019 & 2032
- Table 32: Global Biosimilars Market Volume K Unit Forecast, by Country 2019 & 2032
- Table 33: China Biosimilars Market Revenue (Million) Forecast, by Application 2019 & 2032
- Table 34: China Biosimilars Market Volume (K Unit) Forecast, by Application 2019 & 2032
- Table 35: Japan Biosimilars Market Revenue (Million) Forecast, by Application 2019 & 2032
- Table 36: Japan Biosimilars Market Volume (K Unit) Forecast, by Application 2019 & 2032
- Table 37: India Biosimilars Market Revenue (Million) Forecast, by Application 2019 & 2032
- Table 38: India Biosimilars Market Volume (K Unit) Forecast, by Application 2019 & 2032
- Table 39: Australia Biosimilars Market Revenue (Million) Forecast, by Application 2019 & 2032
- Table 40: Australia Biosimilars Market Volume (K Unit) Forecast, by Application 2019 & 2032
- Table 41: South Korea Biosimilars Market Revenue (Million) Forecast, by Application 2019 & 2032
- Table 42: South Korea Biosimilars Market Volume (K Unit) Forecast, by Application 2019 & 2032
- Table 43: Rest of Asia Pacific Biosimilars Market Revenue (Million) Forecast, by Application 2019 & 2032
- Table 44: Rest of Asia Pacific Biosimilars Market Volume (K Unit) Forecast, by Application 2019 & 2032
- Table 45: Global Biosimilars Market Revenue Million Forecast, by Country 2019 & 2032
- Table 46: Global Biosimilars Market Volume K Unit Forecast, by Country 2019 & 2032
- Table 47: GCC Biosimilars Market Revenue (Million) Forecast, by Application 2019 & 2032
- Table 48: GCC Biosimilars Market Volume (K Unit) Forecast, by Application 2019 & 2032
- Table 49: South Africa Biosimilars Market Revenue (Million) Forecast, by Application 2019 & 2032
- Table 50: South Africa Biosimilars Market Volume (K Unit) Forecast, by Application 2019 & 2032
- Table 51: Rest of Middle East and Africa Biosimilars Market Revenue (Million) Forecast, by Application 2019 & 2032
- Table 52: Rest of Middle East and Africa Biosimilars Market Volume (K Unit) Forecast, by Application 2019 & 2032
- Table 53: Global Biosimilars Market Revenue Million Forecast, by Country 2019 & 2032
- Table 54: Global Biosimilars Market Volume K Unit Forecast, by Country 2019 & 2032
- Table 55: Brazil Biosimilars Market Revenue (Million) Forecast, by Application 2019 & 2032
- Table 56: Brazil Biosimilars Market Volume (K Unit) Forecast, by Application 2019 & 2032
- Table 57: Argentina Biosimilars Market Revenue (Million) Forecast, by Application 2019 & 2032
- Table 58: Argentina Biosimilars Market Volume (K Unit) Forecast, by Application 2019 & 2032
- Table 59: Rest of South America Biosimilars Market Revenue (Million) Forecast, by Application 2019 & 2032
- Table 60: Rest of South America Biosimilars Market Volume (K Unit) Forecast, by Application 2019 & 2032
- Table 61: Global Biosimilars Market Revenue Million Forecast, by Product Class 2019 & 2032
- Table 62: Global Biosimilars Market Volume K Unit Forecast, by Product Class 2019 & 2032
- Table 63: Global Biosimilars Market Revenue Million Forecast, by Application 2019 & 2032
- Table 64: Global Biosimilars Market Volume K Unit Forecast, by Application 2019 & 2032
- Table 65: Global Biosimilars Market Revenue Million Forecast, by Country 2019 & 2032
- Table 66: Global Biosimilars Market Volume K Unit Forecast, by Country 2019 & 2032
- Table 67: United States Biosimilars Market Revenue (Million) Forecast, by Application 2019 & 2032
- Table 68: United States Biosimilars Market Volume (K Unit) Forecast, by Application 2019 & 2032
- Table 69: Canada Biosimilars Market Revenue (Million) Forecast, by Application 2019 & 2032
- Table 70: Canada Biosimilars Market Volume (K Unit) Forecast, by Application 2019 & 2032
- Table 71: Mexico Biosimilars Market Revenue (Million) Forecast, by Application 2019 & 2032
- Table 72: Mexico Biosimilars Market Volume (K Unit) Forecast, by Application 2019 & 2032
- Table 73: Global Biosimilars Market Revenue Million Forecast, by Product Class 2019 & 2032
- Table 74: Global Biosimilars Market Volume K Unit Forecast, by Product Class 2019 & 2032
- Table 75: Global Biosimilars Market Revenue Million Forecast, by Application 2019 & 2032
- Table 76: Global Biosimilars Market Volume K Unit Forecast, by Application 2019 & 2032
- Table 77: Global Biosimilars Market Revenue Million Forecast, by Country 2019 & 2032
- Table 78: Global Biosimilars Market Volume K Unit Forecast, by Country 2019 & 2032
- Table 79: Germany Biosimilars Market Revenue (Million) Forecast, by Application 2019 & 2032
- Table 80: Germany Biosimilars Market Volume (K Unit) Forecast, by Application 2019 & 2032
- Table 81: United Kingdom Biosimilars Market Revenue (Million) Forecast, by Application 2019 & 2032
- Table 82: United Kingdom Biosimilars Market Volume (K Unit) Forecast, by Application 2019 & 2032
- Table 83: France Biosimilars Market Revenue (Million) Forecast, by Application 2019 & 2032
- Table 84: France Biosimilars Market Volume (K Unit) Forecast, by Application 2019 & 2032
- Table 85: Italy Biosimilars Market Revenue (Million) Forecast, by Application 2019 & 2032
- Table 86: Italy Biosimilars Market Volume (K Unit) Forecast, by Application 2019 & 2032
- Table 87: Spain Biosimilars Market Revenue (Million) Forecast, by Application 2019 & 2032
- Table 88: Spain Biosimilars Market Volume (K Unit) Forecast, by Application 2019 & 2032
- Table 89: Rest of Europe Biosimilars Market Revenue (Million) Forecast, by Application 2019 & 2032
- Table 90: Rest of Europe Biosimilars Market Volume (K Unit) Forecast, by Application 2019 & 2032
- Table 91: Global Biosimilars Market Revenue Million Forecast, by Product Class 2019 & 2032
- Table 92: Global Biosimilars Market Volume K Unit Forecast, by Product Class 2019 & 2032
- Table 93: Global Biosimilars Market Revenue Million Forecast, by Application 2019 & 2032
- Table 94: Global Biosimilars Market Volume K Unit Forecast, by Application 2019 & 2032
- Table 95: Global Biosimilars Market Revenue Million Forecast, by Country 2019 & 2032
- Table 96: Global Biosimilars Market Volume K Unit Forecast, by Country 2019 & 2032
- Table 97: China Biosimilars Market Revenue (Million) Forecast, by Application 2019 & 2032
- Table 98: China Biosimilars Market Volume (K Unit) Forecast, by Application 2019 & 2032
- Table 99: Japan Biosimilars Market Revenue (Million) Forecast, by Application 2019 & 2032
- Table 100: Japan Biosimilars Market Volume (K Unit) Forecast, by Application 2019 & 2032
- Table 101: India Biosimilars Market Revenue (Million) Forecast, by Application 2019 & 2032
- Table 102: India Biosimilars Market Volume (K Unit) Forecast, by Application 2019 & 2032
- Table 103: Australia Biosimilars Market Revenue (Million) Forecast, by Application 2019 & 2032
- Table 104: Australia Biosimilars Market Volume (K Unit) Forecast, by Application 2019 & 2032
- Table 105: South Korea Biosimilars Market Revenue (Million) Forecast, by Application 2019 & 2032
- Table 106: South Korea Biosimilars Market Volume (K Unit) Forecast, by Application 2019 & 2032
- Table 107: Rest of Asia Pacific Biosimilars Market Revenue (Million) Forecast, by Application 2019 & 2032
- Table 108: Rest of Asia Pacific Biosimilars Market Volume (K Unit) Forecast, by Application 2019 & 2032
- Table 109: Global Biosimilars Market Revenue Million Forecast, by Product Class 2019 & 2032
- Table 110: Global Biosimilars Market Volume K Unit Forecast, by Product Class 2019 & 2032
- Table 111: Global Biosimilars Market Revenue Million Forecast, by Application 2019 & 2032
- Table 112: Global Biosimilars Market Volume K Unit Forecast, by Application 2019 & 2032
- Table 113: Global Biosimilars Market Revenue Million Forecast, by Country 2019 & 2032
- Table 114: Global Biosimilars Market Volume K Unit Forecast, by Country 2019 & 2032
- Table 115: GCC Biosimilars Market Revenue (Million) Forecast, by Application 2019 & 2032
- Table 116: GCC Biosimilars Market Volume (K Unit) Forecast, by Application 2019 & 2032
- Table 117: South Africa Biosimilars Market Revenue (Million) Forecast, by Application 2019 & 2032
- Table 118: South Africa Biosimilars Market Volume (K Unit) Forecast, by Application 2019 & 2032
- Table 119: Rest of Middle East and Africa Biosimilars Market Revenue (Million) Forecast, by Application 2019 & 2032
- Table 120: Rest of Middle East and Africa Biosimilars Market Volume (K Unit) Forecast, by Application 2019 & 2032
- Table 121: Global Biosimilars Market Revenue Million Forecast, by Product Class 2019 & 2032
- Table 122: Global Biosimilars Market Volume K Unit Forecast, by Product Class 2019 & 2032
- Table 123: Global Biosimilars Market Revenue Million Forecast, by Application 2019 & 2032
- Table 124: Global Biosimilars Market Volume K Unit Forecast, by Application 2019 & 2032
- Table 125: Global Biosimilars Market Revenue Million Forecast, by Country 2019 & 2032
- Table 126: Global Biosimilars Market Volume K Unit Forecast, by Country 2019 & 2032
- Table 127: Brazil Biosimilars Market Revenue (Million) Forecast, by Application 2019 & 2032
- Table 128: Brazil Biosimilars Market Volume (K Unit) Forecast, by Application 2019 & 2032
- Table 129: Argentina Biosimilars Market Revenue (Million) Forecast, by Application 2019 & 2032
- Table 130: Argentina Biosimilars Market Volume (K Unit) Forecast, by Application 2019 & 2032
- Table 131: Rest of South America Biosimilars Market Revenue (Million) Forecast, by Application 2019 & 2032
- Table 132: Rest of South America Biosimilars Market Volume (K Unit) Forecast, by Application 2019 & 2032
Frequently Asked Questions
1. What is the projected Compound Annual Growth Rate (CAGR) of the Biosimilars Market?
The projected CAGR is approximately 18.32%.
2. Which companies are prominent players in the Biosimilars Market?
Key companies in the market include Viatris Inc (Mylan), Novartis AG, Amgen Inc, Dr Reddy's Laboratories, Intas Pharmaceutical Ltd, Coherus Biosciences Inc, Samsung Bioepis Co Ltd, Eli Lilly and Company, LG Life Sciences (LG Chem), Biocad, Teva Pharmaceutical Industries Ltd, Celltrion Healthcare, Stada Arzneimittel AG, Biocon Limited, Pfizer Inc.
3. What are the main segments of the Biosimilars Market?
The market segments include Product Class, Application.
4. Can you provide details about the market size?
The market size is estimated to be USD 35.47 Million as of 2022.
5. What are some drivers contributing to market growth?
Several Blockbuster Biopharmaceuticals Going Off-patent over the Next Five to Ten Years; Growing Burden of Chronic Diseases and Increasing R&D Investments; Increasing Demand for Biosimilar Drugs Due to Their Cost Effectiveness.
6. What are the notable trends driving market growth?
The Oncology Segment Holds the Major Share in the Global Biosimilars Industry.
7. Are there any restraints impacting market growth?
Concerns Regarding Substitutability and Interchangeability; Regulatory Uncertainty and Growing Competition from Biobetters; High Cost Involvement and Complexities in Manufacturing.
8. Can you provide examples of recent developments in the market?
In May 2022, Amneal Pharmaceuticals, Inc. received United States Food and Drug Administration ("FDA") approval for a Biologics License Application ("BLA") for pegfilgrastim-pbbk, a biosimilar referencing Neulasta. The product will be marketed under the proprietary name FYLNETRA.
9. What pricing options are available for accessing the report?
Pricing options include single-user, multi-user, and enterprise licenses priced at USD 4750, USD 5250, and USD 8750 respectively.
10. Is the market size provided in terms of value or volume?
The market size is provided in terms of value, measured in Million and volume, measured in K Unit.
11. Are there any specific market keywords associated with the report?
Yes, the market keyword associated with the report is "Biosimilars Market," which aids in identifying and referencing the specific market segment covered.
12. How do I determine which pricing option suits my needs best?
The pricing options vary based on user requirements and access needs. Individual users may opt for single-user licenses, while businesses requiring broader access may choose multi-user or enterprise licenses for cost-effective access to the report.
13. Are there any additional resources or data provided in the Biosimilars Market report?
While the report offers comprehensive insights, it's advisable to review the specific contents or supplementary materials provided to ascertain if additional resources or data are available.
14. How can I stay updated on further developments or reports in the Biosimilars Market?
To stay informed about further developments, trends, and reports in the Biosimilars Market, consider subscribing to industry newsletters, following relevant companies and organizations, or regularly checking reputable industry news sources and publications.
Methodology
Step 1 - Identification of Relevant Samples Size from Population Database


Step 2 - Approaches for Defining Global Market Size (Value, Volume* & Price*)

Note*: In applicable scenarios
Step 3 - Data Sources
Primary Research
- Web Analytics
- Survey Reports
- Research Institute
- Latest Research Reports
- Opinion Leaders
Secondary Research
- Annual Reports
- White Paper
- Latest Press Release
- Industry Association
- Paid Database
- Investor Presentations

Step 4 - Data Triangulation
Involves using different sources of information in order to increase the validity of a study
These sources are likely to be stakeholders in a program - participants, other researchers, program staff, other community members, and so on.
Then we put all data in single framework & apply various statistical tools to find out the dynamic on the market.
During the analysis stage, feedback from the stakeholder groups would be compared to determine areas of agreement as well as areas of divergence
