

Key Insights
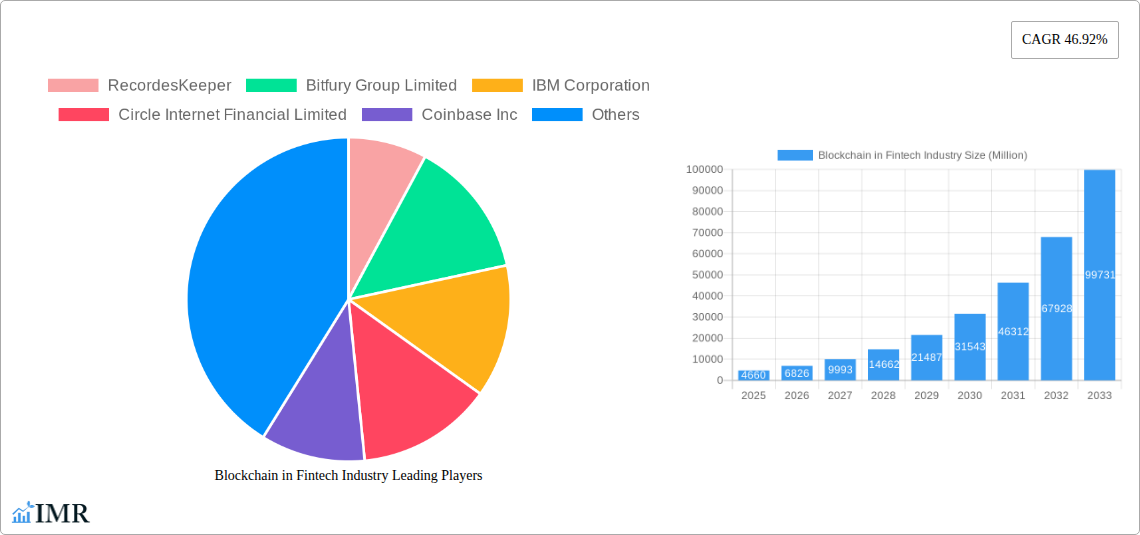
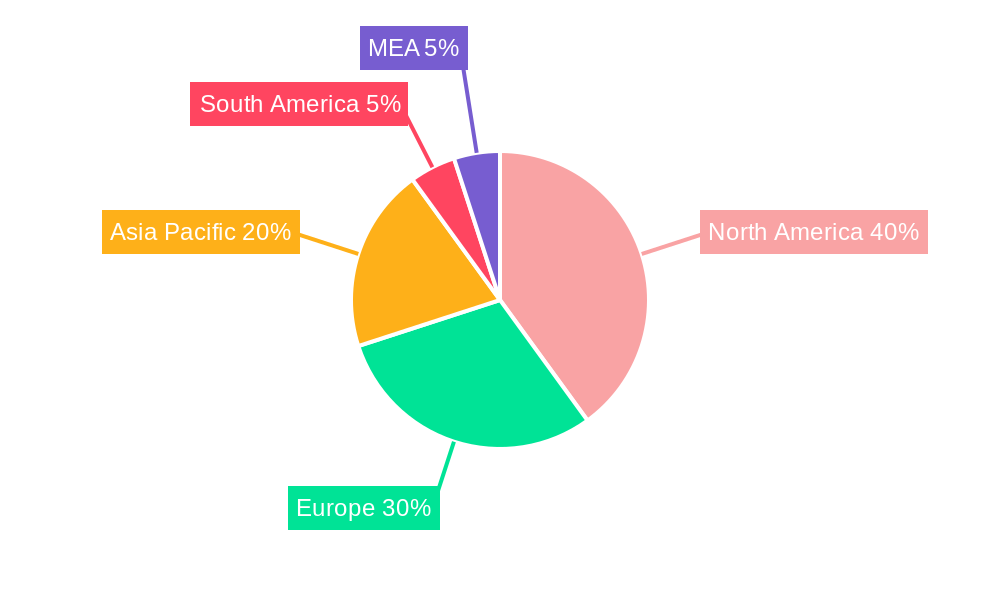
The Blockchain in Fintech market is experiencing explosive growth, projected to reach $4.66 billion in 2025 and exhibiting a remarkable Compound Annual Growth Rate (CAGR) of 46.92% from 2025 to 2033. This rapid expansion is driven by several key factors. Firstly, the increasing demand for enhanced security and transparency in financial transactions is fueling adoption across various applications. Payments, clearing, and settlement systems are benefiting significantly from blockchain's immutable ledger technology, reducing fraud and improving efficiency. Secondly, the rise of decentralized finance (DeFi) and the growing interest in cryptocurrencies are creating new opportunities for blockchain integration within existing financial infrastructures. Smart contracts are automating processes, improving operational agility, and reducing costs. Furthermore, regulatory clarity and supportive government initiatives in several regions are fostering a positive environment for blockchain technology adoption. The market is segmented by provider type (middleware, application & solution, infrastructure & protocol), application (payments, exchanges, smart contracts, identity management, etc.), organization size (large enterprises, SMEs), and vertical (banking, insurance, etc.). North America currently holds a significant market share, but Asia Pacific is projected to experience rapid growth due to increasing digitalization and technological advancements.
The competitive landscape is dynamic, with established tech giants like IBM, Microsoft, and Amazon Web Services competing alongside specialized blockchain firms like Ripple Labs, Bitfury, and Circle Internet Financial. The market's expansion is also being facilitated by the ongoing development of scalable blockchain solutions and the maturation of related technologies such as decentralized identifiers (DIDs) and zero-knowledge proofs. However, challenges remain, including scalability concerns, regulatory uncertainty in some regions, and the need for greater interoperability between different blockchain platforms. Despite these obstacles, the long-term outlook for blockchain in Fintech remains exceptionally promising, with significant potential for disrupting traditional financial systems and creating new avenues for innovation. The continued focus on addressing scalability and interoperability issues will be crucial for realizing the full potential of this transformative technology.
Blockchain in Fintech Industry: Market Report 2019-2033
This comprehensive report provides a detailed analysis of the Blockchain in Fintech Industry market, offering invaluable insights for investors, industry professionals, and strategic decision-makers. With a study period spanning 2019-2033, a base year of 2025, and a forecast period of 2025-2033, this report leverages extensive data analysis to present a robust and future-oriented perspective on this rapidly evolving market. The total market size is projected to reach xx Million by 2033.
Blockchain in Fintech Industry Market Dynamics & Structure
This section analyzes the market concentration, technological innovation drivers, regulatory frameworks, competitive product substitutes, end-user demographics, and M&A trends within the Blockchain in Fintech industry. The market is characterized by a relatively high degree of fragmentation, with numerous players competing across different segments. However, larger players such as IBM and Microsoft are emerging as significant players through strategic acquisitions and partnerships. Technological advancements, particularly in areas like scalability and interoperability, are key drivers of innovation. Regulatory uncertainty remains a significant challenge, varying considerably across jurisdictions.
- Market Concentration: Moderately fragmented, with a few dominant players emerging. Market share of top 5 players: 40%.
- Innovation Drivers: Improved scalability solutions, enhanced security protocols, cross-chain interoperability.
- Regulatory Frameworks: Vary significantly across regions, creating both opportunities and challenges. Increased regulatory clarity is expected to accelerate market growth.
- Competitive Substitutes: Traditional financial infrastructure solutions pose a major competitive threat.
- End-User Demographics: Large enterprises are the primary adopters, with SMEs showing increasing interest.
- M&A Trends: Strategic acquisitions are driving consolidation, with an average of xx M&A deals per year during 2019-2024.
Blockchain in Fintech Industry Growth Trends & Insights
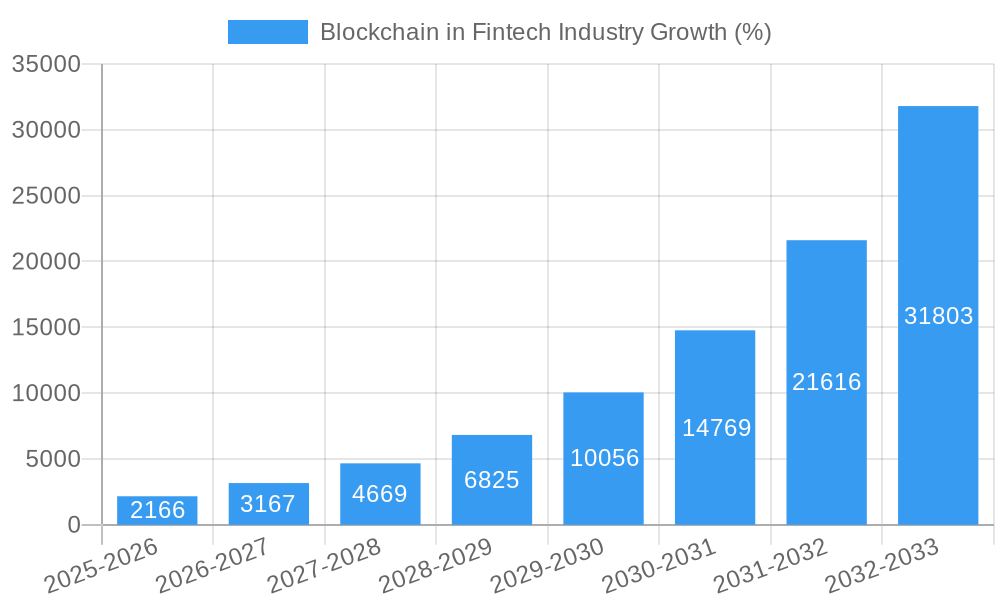
The Blockchain in Fintech market experienced substantial growth during the historical period (2019-2024), driven by increasing adoption across various applications, including payments, and growing awareness of blockchain's potential to enhance security, transparency, and efficiency in financial transactions. The market is expected to maintain a robust Compound Annual Growth Rate (CAGR) of xx% during the forecast period (2025-2033), reaching a projected value of xx Million by 2033. This growth will be fueled by continued technological advancements, expanding regulatory clarity in key markets, and increasing institutional adoption. The market penetration rate is expected to reach xx% by 2033.
Dominant Regions, Countries, or Segments in Blockchain in Fintech Industry
North America currently dominates the Blockchain in Fintech market, driven by early adoption by major financial institutions and a supportive regulatory environment. However, Asia-Pacific is projected to experience the fastest growth rate during the forecast period, driven by increasing technological advancements and a large, rapidly growing fintech ecosystem. Within segments, Payments, Clearing, and Settlement is the largest application segment, followed by Exchanges and Remittance. Large Enterprises are the dominant adopters due to their capacity to invest in blockchain infrastructure and expertise. The Banking vertical shows the highest adoption rate.
- By Provider: Application and Solution Providers hold the largest market share.
- By Application: Payments, Clearing, and Settlement is the dominant application.
- By Organization Size: Large Enterprises represent the largest segment.
- By Vertical: Banking sector shows the highest adoption and market share.
- Key Drivers: Government support for fintech innovation, increasing digitalization, and growing demand for secure and efficient financial transactions.
Blockchain in Fintech Industry Product Landscape
The Blockchain in Fintech product landscape is characterized by a diverse range of solutions catering to various needs, including middleware, application platforms, and infrastructure components. These solutions are continuously evolving, incorporating advancements in areas like scalability, security, and interoperability. Many providers offer unique value propositions through specialized functionalities or integrations with existing financial systems. Key features include enhanced security, reduced transaction costs, and increased transparency.
Key Drivers, Barriers & Challenges in Blockchain in Fintech Industry
Key Drivers:
- Growing demand for secure and transparent financial transactions.
- Increasing regulatory clarity in certain jurisdictions.
- Technological advancements enhancing scalability and interoperability.
Challenges & Restraints:
- Regulatory uncertainty and inconsistent regulations across different jurisdictions.
- Scalability limitations of certain blockchain technologies.
- Security concerns and the potential for vulnerabilities.
- Interoperability issues between different blockchain platforms. Lack of interoperability is estimated to cost the industry xx Million annually.
Emerging Opportunities in Blockchain in Fintech Industry
- Expanding adoption in developing economies with limited access to traditional financial services.
- Integration of blockchain technology with other emerging technologies, such as Artificial Intelligence (AI) and Internet of Things (IoT).
- Development of decentralized finance (DeFi) applications.
- Growing interest in Central Bank Digital Currencies (CBDCs).
Growth Accelerators in the Blockchain in Fintech Industry Industry
The long-term growth of the Blockchain in Fintech industry will be propelled by continuous technological innovation, strategic partnerships between established financial institutions and blockchain technology providers, and expanding government support. Increased cross-border collaboration and the development of industry standards will further accelerate market growth. The development of user-friendly applications and platforms will broaden adoption across a wider range of users.
Key Players Shaping the Blockchain in Fintech Industry Market
- RecordesKeeper
- Bitfury Group Limited
- IBM Corporation
- Circle Internet Financial Limited
- Coinbase Inc
- Factom Inc
- Microsoft Corporation
- Cambridge Blockchain LLC
- Accenture Plc
- Amazon Web Services Inc
- Earthport Plc
- Digital Asset Holdings LLC
- Oracle Corporation
- AlphaPoint Corporation
- GuardTime AS
- Ripple Lab Inc
Notable Milestones in Blockchain in Fintech Industry Sector
- October 2022: Nubank announces plans to launch its own cryptocurrency, Nucoin, in Brazil.
- October 2022: The Reserve Bank of India reveals its concept for a Central Bank Digital Currency (CBDC).
In-Depth Blockchain in Fintech Industry Market Outlook
The future of the Blockchain in Fintech industry is bright, with significant growth potential driven by technological advancements, expanding adoption across various sectors, and increasing regulatory clarity. Strategic partnerships, innovative product development, and expansion into new markets will be key factors in shaping the market landscape. The continued development of scalable and interoperable blockchain solutions will unlock new opportunities and accelerate the transformation of the financial services industry.
Blockchain in Fintech Industry Segmentation
-
1. Provider
- 1.1. Middleware Providers
- 1.2. Application and Solution Providers
- 1.3. Infrastructure and Protocol Providers
-
2. Application
- 2.1. Payments, Clearing, and Settlement
- 2.2. Exchanges and Remittance
- 2.3. Smart Contract
- 2.4. Identity Management
- 2.5. Compliance Management/ KYC
- 2.6. Other Applications
-
3. Organization Size
- 3.1. Large Enterprises
- 3.2. Small and Medium-sized Enterprises
-
4. End-user Verticals
- 4.1. Banking
- 4.2. Non-banking Financial Services
- 4.3. Insurance
Blockchain in Fintech Industry Segmentation By Geography
- 1. North America
- 2. Europe
- 3. Asia
- 4. Australia and New Zealand
- 5. Latin America
- 6. Middle East and Africa
Blockchain in Fintech Industry REPORT HIGHLIGHTS
| Aspects | Details |
|---|---|
| Study Period | 2019-2033 |
| Base Year | 2024 |
| Estimated Year | 2025 |
| Forecast Period | 2025-2033 |
| Historical Period | 2019-2024 |
| Growth Rate | CAGR of 46.92% from 2019-2033 |
| Segmentation |
|
Table of Contents
- 1. Introduction
- 1.1. Research Scope
- 1.2. Market Segmentation
- 1.3. Research Methodology
- 1.4. Definitions and Assumptions
- 2. Executive Summary
- 2.1. Introduction
- 3. Market Dynamics
- 3.1. Introduction
- 3.2. Market Drivers
- 3.2.1 Rising R&D Activities for Transformative and Highly Intelligent Programmable Blockchain Platform; Increasing Adoption of Blockchain Technology for Applications in Banking Sector Such As Payments
- 3.2.2 Smart Contracts
- 3.2.3 Etc.; Reduced Total Cost of Ownership
- 3.3. Market Restrains
- 3.3.1. High Cost of Ownership
- 3.4. Market Trends
- 3.4.1. Increasing Use of Blockchain in the Insurance Sector is expected to Drive the Market
- 4. Market Factor Analysis
- 4.1. Porters Five Forces
- 4.2. Supply/Value Chain
- 4.3. PESTEL analysis
- 4.4. Market Entropy
- 4.5. Patent/Trademark Analysis
- 5. Global Blockchain in Fintech Industry Analysis, Insights and Forecast, 2019-2031
- 5.1. Market Analysis, Insights and Forecast - by Provider
- 5.1.1. Middleware Providers
- 5.1.2. Application and Solution Providers
- 5.1.3. Infrastructure and Protocol Providers
- 5.2. Market Analysis, Insights and Forecast - by Application
- 5.2.1. Payments, Clearing, and Settlement
- 5.2.2. Exchanges and Remittance
- 5.2.3. Smart Contract
- 5.2.4. Identity Management
- 5.2.5. Compliance Management/ KYC
- 5.2.6. Other Applications
- 5.3. Market Analysis, Insights and Forecast - by Organization Size
- 5.3.1. Large Enterprises
- 5.3.2. Small and Medium-sized Enterprises
- 5.4. Market Analysis, Insights and Forecast - by End-user Verticals
- 5.4.1. Banking
- 5.4.2. Non-banking Financial Services
- 5.4.3. Insurance
- 5.5. Market Analysis, Insights and Forecast - by Region
- 5.5.1. North America
- 5.5.2. Europe
- 5.5.3. Asia
- 5.5.4. Australia and New Zealand
- 5.5.5. Latin America
- 5.5.6. Middle East and Africa
- 5.1. Market Analysis, Insights and Forecast - by Provider
- 6. North America Blockchain in Fintech Industry Analysis, Insights and Forecast, 2019-2031
- 6.1. Market Analysis, Insights and Forecast - by Provider
- 6.1.1. Middleware Providers
- 6.1.2. Application and Solution Providers
- 6.1.3. Infrastructure and Protocol Providers
- 6.2. Market Analysis, Insights and Forecast - by Application
- 6.2.1. Payments, Clearing, and Settlement
- 6.2.2. Exchanges and Remittance
- 6.2.3. Smart Contract
- 6.2.4. Identity Management
- 6.2.5. Compliance Management/ KYC
- 6.2.6. Other Applications
- 6.3. Market Analysis, Insights and Forecast - by Organization Size
- 6.3.1. Large Enterprises
- 6.3.2. Small and Medium-sized Enterprises
- 6.4. Market Analysis, Insights and Forecast - by End-user Verticals
- 6.4.1. Banking
- 6.4.2. Non-banking Financial Services
- 6.4.3. Insurance
- 6.1. Market Analysis, Insights and Forecast - by Provider
- 7. Europe Blockchain in Fintech Industry Analysis, Insights and Forecast, 2019-2031
- 7.1. Market Analysis, Insights and Forecast - by Provider
- 7.1.1. Middleware Providers
- 7.1.2. Application and Solution Providers
- 7.1.3. Infrastructure and Protocol Providers
- 7.2. Market Analysis, Insights and Forecast - by Application
- 7.2.1. Payments, Clearing, and Settlement
- 7.2.2. Exchanges and Remittance
- 7.2.3. Smart Contract
- 7.2.4. Identity Management
- 7.2.5. Compliance Management/ KYC
- 7.2.6. Other Applications
- 7.3. Market Analysis, Insights and Forecast - by Organization Size
- 7.3.1. Large Enterprises
- 7.3.2. Small and Medium-sized Enterprises
- 7.4. Market Analysis, Insights and Forecast - by End-user Verticals
- 7.4.1. Banking
- 7.4.2. Non-banking Financial Services
- 7.4.3. Insurance
- 7.1. Market Analysis, Insights and Forecast - by Provider
- 8. Asia Blockchain in Fintech Industry Analysis, Insights and Forecast, 2019-2031
- 8.1. Market Analysis, Insights and Forecast - by Provider
- 8.1.1. Middleware Providers
- 8.1.2. Application and Solution Providers
- 8.1.3. Infrastructure and Protocol Providers
- 8.2. Market Analysis, Insights and Forecast - by Application
- 8.2.1. Payments, Clearing, and Settlement
- 8.2.2. Exchanges and Remittance
- 8.2.3. Smart Contract
- 8.2.4. Identity Management
- 8.2.5. Compliance Management/ KYC
- 8.2.6. Other Applications
- 8.3. Market Analysis, Insights and Forecast - by Organization Size
- 8.3.1. Large Enterprises
- 8.3.2. Small and Medium-sized Enterprises
- 8.4. Market Analysis, Insights and Forecast - by End-user Verticals
- 8.4.1. Banking
- 8.4.2. Non-banking Financial Services
- 8.4.3. Insurance
- 8.1. Market Analysis, Insights and Forecast - by Provider
- 9. Australia and New Zealand Blockchain in Fintech Industry Analysis, Insights and Forecast, 2019-2031
- 9.1. Market Analysis, Insights and Forecast - by Provider
- 9.1.1. Middleware Providers
- 9.1.2. Application and Solution Providers
- 9.1.3. Infrastructure and Protocol Providers
- 9.2. Market Analysis, Insights and Forecast - by Application
- 9.2.1. Payments, Clearing, and Settlement
- 9.2.2. Exchanges and Remittance
- 9.2.3. Smart Contract
- 9.2.4. Identity Management
- 9.2.5. Compliance Management/ KYC
- 9.2.6. Other Applications
- 9.3. Market Analysis, Insights and Forecast - by Organization Size
- 9.3.1. Large Enterprises
- 9.3.2. Small and Medium-sized Enterprises
- 9.4. Market Analysis, Insights and Forecast - by End-user Verticals
- 9.4.1. Banking
- 9.4.2. Non-banking Financial Services
- 9.4.3. Insurance
- 9.1. Market Analysis, Insights and Forecast - by Provider
- 10. Latin America Blockchain in Fintech Industry Analysis, Insights and Forecast, 2019-2031
- 10.1. Market Analysis, Insights and Forecast - by Provider
- 10.1.1. Middleware Providers
- 10.1.2. Application and Solution Providers
- 10.1.3. Infrastructure and Protocol Providers
- 10.2. Market Analysis, Insights and Forecast - by Application
- 10.2.1. Payments, Clearing, and Settlement
- 10.2.2. Exchanges and Remittance
- 10.2.3. Smart Contract
- 10.2.4. Identity Management
- 10.2.5. Compliance Management/ KYC
- 10.2.6. Other Applications
- 10.3. Market Analysis, Insights and Forecast - by Organization Size
- 10.3.1. Large Enterprises
- 10.3.2. Small and Medium-sized Enterprises
- 10.4. Market Analysis, Insights and Forecast - by End-user Verticals
- 10.4.1. Banking
- 10.4.2. Non-banking Financial Services
- 10.4.3. Insurance
- 10.1. Market Analysis, Insights and Forecast - by Provider
- 11. Middle East and Africa Blockchain in Fintech Industry Analysis, Insights and Forecast, 2019-2031
- 11.1. Market Analysis, Insights and Forecast - by Provider
- 11.1.1. Middleware Providers
- 11.1.2. Application and Solution Providers
- 11.1.3. Infrastructure and Protocol Providers
- 11.2. Market Analysis, Insights and Forecast - by Application
- 11.2.1. Payments, Clearing, and Settlement
- 11.2.2. Exchanges and Remittance
- 11.2.3. Smart Contract
- 11.2.4. Identity Management
- 11.2.5. Compliance Management/ KYC
- 11.2.6. Other Applications
- 11.3. Market Analysis, Insights and Forecast - by Organization Size
- 11.3.1. Large Enterprises
- 11.3.2. Small and Medium-sized Enterprises
- 11.4. Market Analysis, Insights and Forecast - by End-user Verticals
- 11.4.1. Banking
- 11.4.2. Non-banking Financial Services
- 11.4.3. Insurance
- 11.1. Market Analysis, Insights and Forecast - by Provider
- 12. North America Blockchain in Fintech Industry Analysis, Insights and Forecast, 2019-2031
- 12.1. Market Analysis, Insights and Forecast - By Country/Sub-region
- 12.1.1 United States
- 12.1.2 Canada
- 12.1.3 Mexico
- 13. Europe Blockchain in Fintech Industry Analysis, Insights and Forecast, 2019-2031
- 13.1. Market Analysis, Insights and Forecast - By Country/Sub-region
- 13.1.1 Germany
- 13.1.2 United Kingdom
- 13.1.3 France
- 13.1.4 Spain
- 13.1.5 Italy
- 13.1.6 Spain
- 13.1.7 Belgium
- 13.1.8 Netherland
- 13.1.9 Nordics
- 13.1.10 Rest of Europe
- 14. Asia Pacific Blockchain in Fintech Industry Analysis, Insights and Forecast, 2019-2031
- 14.1. Market Analysis, Insights and Forecast - By Country/Sub-region
- 14.1.1 China
- 14.1.2 Japan
- 14.1.3 India
- 14.1.4 South Korea
- 14.1.5 Southeast Asia
- 14.1.6 Australia
- 14.1.7 Indonesia
- 14.1.8 Phillipes
- 14.1.9 Singapore
- 14.1.10 Thailandc
- 14.1.11 Rest of Asia Pacific
- 15. South America Blockchain in Fintech Industry Analysis, Insights and Forecast, 2019-2031
- 15.1. Market Analysis, Insights and Forecast - By Country/Sub-region
- 15.1.1 Brazil
- 15.1.2 Argentina
- 15.1.3 Peru
- 15.1.4 Chile
- 15.1.5 Colombia
- 15.1.6 Ecuador
- 15.1.7 Venezuela
- 15.1.8 Rest of South America
- 16. North America Blockchain in Fintech Industry Analysis, Insights and Forecast, 2019-2031
- 16.1. Market Analysis, Insights and Forecast - By Country/Sub-region
- 16.1.1 United States
- 16.1.2 Canada
- 16.1.3 Mexico
- 17. MEA Blockchain in Fintech Industry Analysis, Insights and Forecast, 2019-2031
- 17.1. Market Analysis, Insights and Forecast - By Country/Sub-region
- 17.1.1 United Arab Emirates
- 17.1.2 Saudi Arabia
- 17.1.3 South Africa
- 17.1.4 Rest of Middle East and Africa
- 18. Competitive Analysis
- 18.1. Global Market Share Analysis 2024
- 18.2. Company Profiles
- 18.2.1 RecordesKeeper
- 18.2.1.1. Overview
- 18.2.1.2. Products
- 18.2.1.3. SWOT Analysis
- 18.2.1.4. Recent Developments
- 18.2.1.5. Financials (Based on Availability)
- 18.2.2 Bitfury Group Limited
- 18.2.2.1. Overview
- 18.2.2.2. Products
- 18.2.2.3. SWOT Analysis
- 18.2.2.4. Recent Developments
- 18.2.2.5. Financials (Based on Availability)
- 18.2.3 IBM Corporation
- 18.2.3.1. Overview
- 18.2.3.2. Products
- 18.2.3.3. SWOT Analysis
- 18.2.3.4. Recent Developments
- 18.2.3.5. Financials (Based on Availability)
- 18.2.4 Circle Internet Financial Limited
- 18.2.4.1. Overview
- 18.2.4.2. Products
- 18.2.4.3. SWOT Analysis
- 18.2.4.4. Recent Developments
- 18.2.4.5. Financials (Based on Availability)
- 18.2.5 Coinbase Inc
- 18.2.5.1. Overview
- 18.2.5.2. Products
- 18.2.5.3. SWOT Analysis
- 18.2.5.4. Recent Developments
- 18.2.5.5. Financials (Based on Availability)
- 18.2.6 Factom Inc
- 18.2.6.1. Overview
- 18.2.6.2. Products
- 18.2.6.3. SWOT Analysis
- 18.2.6.4. Recent Developments
- 18.2.6.5. Financials (Based on Availability)
- 18.2.7 Microsoft Corporation
- 18.2.7.1. Overview
- 18.2.7.2. Products
- 18.2.7.3. SWOT Analysis
- 18.2.7.4. Recent Developments
- 18.2.7.5. Financials (Based on Availability)
- 18.2.8 Cambridge Blockchain LLC
- 18.2.8.1. Overview
- 18.2.8.2. Products
- 18.2.8.3. SWOT Analysis
- 18.2.8.4. Recent Developments
- 18.2.8.5. Financials (Based on Availability)
- 18.2.9 Accenture Plc
- 18.2.9.1. Overview
- 18.2.9.2. Products
- 18.2.9.3. SWOT Analysis
- 18.2.9.4. Recent Developments
- 18.2.9.5. Financials (Based on Availability)
- 18.2.10 Amazon Web Services Inc
- 18.2.10.1. Overview
- 18.2.10.2. Products
- 18.2.10.3. SWOT Analysis
- 18.2.10.4. Recent Developments
- 18.2.10.5. Financials (Based on Availability)
- 18.2.11 Earthport Plc
- 18.2.11.1. Overview
- 18.2.11.2. Products
- 18.2.11.3. SWOT Analysis
- 18.2.11.4. Recent Developments
- 18.2.11.5. Financials (Based on Availability)
- 18.2.12 Digital Asset Holdings LLC
- 18.2.12.1. Overview
- 18.2.12.2. Products
- 18.2.12.3. SWOT Analysis
- 18.2.12.4. Recent Developments
- 18.2.12.5. Financials (Based on Availability)
- 18.2.13 Oracle Corporation
- 18.2.13.1. Overview
- 18.2.13.2. Products
- 18.2.13.3. SWOT Analysis
- 18.2.13.4. Recent Developments
- 18.2.13.5. Financials (Based on Availability)
- 18.2.14 AlphaPoint Corporation
- 18.2.14.1. Overview
- 18.2.14.2. Products
- 18.2.14.3. SWOT Analysis
- 18.2.14.4. Recent Developments
- 18.2.14.5. Financials (Based on Availability)
- 18.2.15 GuardTime AS
- 18.2.15.1. Overview
- 18.2.15.2. Products
- 18.2.15.3. SWOT Analysis
- 18.2.15.4. Recent Developments
- 18.2.15.5. Financials (Based on Availability)
- 18.2.16 Ripple Lab Inc
- 18.2.16.1. Overview
- 18.2.16.2. Products
- 18.2.16.3. SWOT Analysis
- 18.2.16.4. Recent Developments
- 18.2.16.5. Financials (Based on Availability)
- 18.2.1 RecordesKeeper
List of Figures
- Figure 1: Global Blockchain in Fintech Industry Revenue Breakdown (Million, %) by Region 2024 & 2032
- Figure 2: Global Blockchain in Fintech Industry Volume Breakdown (K Unit, %) by Region 2024 & 2032
- Figure 3: North America Blockchain in Fintech Industry Revenue (Million), by Country 2024 & 2032
- Figure 4: North America Blockchain in Fintech Industry Volume (K Unit), by Country 2024 & 2032
- Figure 5: North America Blockchain in Fintech Industry Revenue Share (%), by Country 2024 & 2032
- Figure 6: North America Blockchain in Fintech Industry Volume Share (%), by Country 2024 & 2032
- Figure 7: Europe Blockchain in Fintech Industry Revenue (Million), by Country 2024 & 2032
- Figure 8: Europe Blockchain in Fintech Industry Volume (K Unit), by Country 2024 & 2032
- Figure 9: Europe Blockchain in Fintech Industry Revenue Share (%), by Country 2024 & 2032
- Figure 10: Europe Blockchain in Fintech Industry Volume Share (%), by Country 2024 & 2032
- Figure 11: Asia Pacific Blockchain in Fintech Industry Revenue (Million), by Country 2024 & 2032
- Figure 12: Asia Pacific Blockchain in Fintech Industry Volume (K Unit), by Country 2024 & 2032
- Figure 13: Asia Pacific Blockchain in Fintech Industry Revenue Share (%), by Country 2024 & 2032
- Figure 14: Asia Pacific Blockchain in Fintech Industry Volume Share (%), by Country 2024 & 2032
- Figure 15: South America Blockchain in Fintech Industry Revenue (Million), by Country 2024 & 2032
- Figure 16: South America Blockchain in Fintech Industry Volume (K Unit), by Country 2024 & 2032
- Figure 17: South America Blockchain in Fintech Industry Revenue Share (%), by Country 2024 & 2032
- Figure 18: South America Blockchain in Fintech Industry Volume Share (%), by Country 2024 & 2032
- Figure 19: North America Blockchain in Fintech Industry Revenue (Million), by Country 2024 & 2032
- Figure 20: North America Blockchain in Fintech Industry Volume (K Unit), by Country 2024 & 2032
- Figure 21: North America Blockchain in Fintech Industry Revenue Share (%), by Country 2024 & 2032
- Figure 22: North America Blockchain in Fintech Industry Volume Share (%), by Country 2024 & 2032
- Figure 23: MEA Blockchain in Fintech Industry Revenue (Million), by Country 2024 & 2032
- Figure 24: MEA Blockchain in Fintech Industry Volume (K Unit), by Country 2024 & 2032
- Figure 25: MEA Blockchain in Fintech Industry Revenue Share (%), by Country 2024 & 2032
- Figure 26: MEA Blockchain in Fintech Industry Volume Share (%), by Country 2024 & 2032
- Figure 27: North America Blockchain in Fintech Industry Revenue (Million), by Provider 2024 & 2032
- Figure 28: North America Blockchain in Fintech Industry Volume (K Unit), by Provider 2024 & 2032
- Figure 29: North America Blockchain in Fintech Industry Revenue Share (%), by Provider 2024 & 2032
- Figure 30: North America Blockchain in Fintech Industry Volume Share (%), by Provider 2024 & 2032
- Figure 31: North America Blockchain in Fintech Industry Revenue (Million), by Application 2024 & 2032
- Figure 32: North America Blockchain in Fintech Industry Volume (K Unit), by Application 2024 & 2032
- Figure 33: North America Blockchain in Fintech Industry Revenue Share (%), by Application 2024 & 2032
- Figure 34: North America Blockchain in Fintech Industry Volume Share (%), by Application 2024 & 2032
- Figure 35: North America Blockchain in Fintech Industry Revenue (Million), by Organization Size 2024 & 2032
- Figure 36: North America Blockchain in Fintech Industry Volume (K Unit), by Organization Size 2024 & 2032
- Figure 37: North America Blockchain in Fintech Industry Revenue Share (%), by Organization Size 2024 & 2032
- Figure 38: North America Blockchain in Fintech Industry Volume Share (%), by Organization Size 2024 & 2032
- Figure 39: North America Blockchain in Fintech Industry Revenue (Million), by End-user Verticals 2024 & 2032
- Figure 40: North America Blockchain in Fintech Industry Volume (K Unit), by End-user Verticals 2024 & 2032
- Figure 41: North America Blockchain in Fintech Industry Revenue Share (%), by End-user Verticals 2024 & 2032
- Figure 42: North America Blockchain in Fintech Industry Volume Share (%), by End-user Verticals 2024 & 2032
- Figure 43: North America Blockchain in Fintech Industry Revenue (Million), by Country 2024 & 2032
- Figure 44: North America Blockchain in Fintech Industry Volume (K Unit), by Country 2024 & 2032
- Figure 45: North America Blockchain in Fintech Industry Revenue Share (%), by Country 2024 & 2032
- Figure 46: North America Blockchain in Fintech Industry Volume Share (%), by Country 2024 & 2032
- Figure 47: Europe Blockchain in Fintech Industry Revenue (Million), by Provider 2024 & 2032
- Figure 48: Europe Blockchain in Fintech Industry Volume (K Unit), by Provider 2024 & 2032
- Figure 49: Europe Blockchain in Fintech Industry Revenue Share (%), by Provider 2024 & 2032
- Figure 50: Europe Blockchain in Fintech Industry Volume Share (%), by Provider 2024 & 2032
- Figure 51: Europe Blockchain in Fintech Industry Revenue (Million), by Application 2024 & 2032
- Figure 52: Europe Blockchain in Fintech Industry Volume (K Unit), by Application 2024 & 2032
- Figure 53: Europe Blockchain in Fintech Industry Revenue Share (%), by Application 2024 & 2032
- Figure 54: Europe Blockchain in Fintech Industry Volume Share (%), by Application 2024 & 2032
- Figure 55: Europe Blockchain in Fintech Industry Revenue (Million), by Organization Size 2024 & 2032
- Figure 56: Europe Blockchain in Fintech Industry Volume (K Unit), by Organization Size 2024 & 2032
- Figure 57: Europe Blockchain in Fintech Industry Revenue Share (%), by Organization Size 2024 & 2032
- Figure 58: Europe Blockchain in Fintech Industry Volume Share (%), by Organization Size 2024 & 2032
- Figure 59: Europe Blockchain in Fintech Industry Revenue (Million), by End-user Verticals 2024 & 2032
- Figure 60: Europe Blockchain in Fintech Industry Volume (K Unit), by End-user Verticals 2024 & 2032
- Figure 61: Europe Blockchain in Fintech Industry Revenue Share (%), by End-user Verticals 2024 & 2032
- Figure 62: Europe Blockchain in Fintech Industry Volume Share (%), by End-user Verticals 2024 & 2032
- Figure 63: Europe Blockchain in Fintech Industry Revenue (Million), by Country 2024 & 2032
- Figure 64: Europe Blockchain in Fintech Industry Volume (K Unit), by Country 2024 & 2032
- Figure 65: Europe Blockchain in Fintech Industry Revenue Share (%), by Country 2024 & 2032
- Figure 66: Europe Blockchain in Fintech Industry Volume Share (%), by Country 2024 & 2032
- Figure 67: Asia Blockchain in Fintech Industry Revenue (Million), by Provider 2024 & 2032
- Figure 68: Asia Blockchain in Fintech Industry Volume (K Unit), by Provider 2024 & 2032
- Figure 69: Asia Blockchain in Fintech Industry Revenue Share (%), by Provider 2024 & 2032
- Figure 70: Asia Blockchain in Fintech Industry Volume Share (%), by Provider 2024 & 2032
- Figure 71: Asia Blockchain in Fintech Industry Revenue (Million), by Application 2024 & 2032
- Figure 72: Asia Blockchain in Fintech Industry Volume (K Unit), by Application 2024 & 2032
- Figure 73: Asia Blockchain in Fintech Industry Revenue Share (%), by Application 2024 & 2032
- Figure 74: Asia Blockchain in Fintech Industry Volume Share (%), by Application 2024 & 2032
- Figure 75: Asia Blockchain in Fintech Industry Revenue (Million), by Organization Size 2024 & 2032
- Figure 76: Asia Blockchain in Fintech Industry Volume (K Unit), by Organization Size 2024 & 2032
- Figure 77: Asia Blockchain in Fintech Industry Revenue Share (%), by Organization Size 2024 & 2032
- Figure 78: Asia Blockchain in Fintech Industry Volume Share (%), by Organization Size 2024 & 2032
- Figure 79: Asia Blockchain in Fintech Industry Revenue (Million), by End-user Verticals 2024 & 2032
- Figure 80: Asia Blockchain in Fintech Industry Volume (K Unit), by End-user Verticals 2024 & 2032
- Figure 81: Asia Blockchain in Fintech Industry Revenue Share (%), by End-user Verticals 2024 & 2032
- Figure 82: Asia Blockchain in Fintech Industry Volume Share (%), by End-user Verticals 2024 & 2032
- Figure 83: Asia Blockchain in Fintech Industry Revenue (Million), by Country 2024 & 2032
- Figure 84: Asia Blockchain in Fintech Industry Volume (K Unit), by Country 2024 & 2032
- Figure 85: Asia Blockchain in Fintech Industry Revenue Share (%), by Country 2024 & 2032
- Figure 86: Asia Blockchain in Fintech Industry Volume Share (%), by Country 2024 & 2032
- Figure 87: Australia and New Zealand Blockchain in Fintech Industry Revenue (Million), by Provider 2024 & 2032
- Figure 88: Australia and New Zealand Blockchain in Fintech Industry Volume (K Unit), by Provider 2024 & 2032
- Figure 89: Australia and New Zealand Blockchain in Fintech Industry Revenue Share (%), by Provider 2024 & 2032
- Figure 90: Australia and New Zealand Blockchain in Fintech Industry Volume Share (%), by Provider 2024 & 2032
- Figure 91: Australia and New Zealand Blockchain in Fintech Industry Revenue (Million), by Application 2024 & 2032
- Figure 92: Australia and New Zealand Blockchain in Fintech Industry Volume (K Unit), by Application 2024 & 2032
- Figure 93: Australia and New Zealand Blockchain in Fintech Industry Revenue Share (%), by Application 2024 & 2032
- Figure 94: Australia and New Zealand Blockchain in Fintech Industry Volume Share (%), by Application 2024 & 2032
- Figure 95: Australia and New Zealand Blockchain in Fintech Industry Revenue (Million), by Organization Size 2024 & 2032
- Figure 96: Australia and New Zealand Blockchain in Fintech Industry Volume (K Unit), by Organization Size 2024 & 2032
- Figure 97: Australia and New Zealand Blockchain in Fintech Industry Revenue Share (%), by Organization Size 2024 & 2032
- Figure 98: Australia and New Zealand Blockchain in Fintech Industry Volume Share (%), by Organization Size 2024 & 2032
- Figure 99: Australia and New Zealand Blockchain in Fintech Industry Revenue (Million), by End-user Verticals 2024 & 2032
- Figure 100: Australia and New Zealand Blockchain in Fintech Industry Volume (K Unit), by End-user Verticals 2024 & 2032
- Figure 101: Australia and New Zealand Blockchain in Fintech Industry Revenue Share (%), by End-user Verticals 2024 & 2032
- Figure 102: Australia and New Zealand Blockchain in Fintech Industry Volume Share (%), by End-user Verticals 2024 & 2032
- Figure 103: Australia and New Zealand Blockchain in Fintech Industry Revenue (Million), by Country 2024 & 2032
- Figure 104: Australia and New Zealand Blockchain in Fintech Industry Volume (K Unit), by Country 2024 & 2032
- Figure 105: Australia and New Zealand Blockchain in Fintech Industry Revenue Share (%), by Country 2024 & 2032
- Figure 106: Australia and New Zealand Blockchain in Fintech Industry Volume Share (%), by Country 2024 & 2032
- Figure 107: Latin America Blockchain in Fintech Industry Revenue (Million), by Provider 2024 & 2032
- Figure 108: Latin America Blockchain in Fintech Industry Volume (K Unit), by Provider 2024 & 2032
- Figure 109: Latin America Blockchain in Fintech Industry Revenue Share (%), by Provider 2024 & 2032
- Figure 110: Latin America Blockchain in Fintech Industry Volume Share (%), by Provider 2024 & 2032
- Figure 111: Latin America Blockchain in Fintech Industry Revenue (Million), by Application 2024 & 2032
- Figure 112: Latin America Blockchain in Fintech Industry Volume (K Unit), by Application 2024 & 2032
- Figure 113: Latin America Blockchain in Fintech Industry Revenue Share (%), by Application 2024 & 2032
- Figure 114: Latin America Blockchain in Fintech Industry Volume Share (%), by Application 2024 & 2032
- Figure 115: Latin America Blockchain in Fintech Industry Revenue (Million), by Organization Size 2024 & 2032
- Figure 116: Latin America Blockchain in Fintech Industry Volume (K Unit), by Organization Size 2024 & 2032
- Figure 117: Latin America Blockchain in Fintech Industry Revenue Share (%), by Organization Size 2024 & 2032
- Figure 118: Latin America Blockchain in Fintech Industry Volume Share (%), by Organization Size 2024 & 2032
- Figure 119: Latin America Blockchain in Fintech Industry Revenue (Million), by End-user Verticals 2024 & 2032
- Figure 120: Latin America Blockchain in Fintech Industry Volume (K Unit), by End-user Verticals 2024 & 2032
- Figure 121: Latin America Blockchain in Fintech Industry Revenue Share (%), by End-user Verticals 2024 & 2032
- Figure 122: Latin America Blockchain in Fintech Industry Volume Share (%), by End-user Verticals 2024 & 2032
- Figure 123: Latin America Blockchain in Fintech Industry Revenue (Million), by Country 2024 & 2032
- Figure 124: Latin America Blockchain in Fintech Industry Volume (K Unit), by Country 2024 & 2032
- Figure 125: Latin America Blockchain in Fintech Industry Revenue Share (%), by Country 2024 & 2032
- Figure 126: Latin America Blockchain in Fintech Industry Volume Share (%), by Country 2024 & 2032
- Figure 127: Middle East and Africa Blockchain in Fintech Industry Revenue (Million), by Provider 2024 & 2032
- Figure 128: Middle East and Africa Blockchain in Fintech Industry Volume (K Unit), by Provider 2024 & 2032
- Figure 129: Middle East and Africa Blockchain in Fintech Industry Revenue Share (%), by Provider 2024 & 2032
- Figure 130: Middle East and Africa Blockchain in Fintech Industry Volume Share (%), by Provider 2024 & 2032
- Figure 131: Middle East and Africa Blockchain in Fintech Industry Revenue (Million), by Application 2024 & 2032
- Figure 132: Middle East and Africa Blockchain in Fintech Industry Volume (K Unit), by Application 2024 & 2032
- Figure 133: Middle East and Africa Blockchain in Fintech Industry Revenue Share (%), by Application 2024 & 2032
- Figure 134: Middle East and Africa Blockchain in Fintech Industry Volume Share (%), by Application 2024 & 2032
- Figure 135: Middle East and Africa Blockchain in Fintech Industry Revenue (Million), by Organization Size 2024 & 2032
- Figure 136: Middle East and Africa Blockchain in Fintech Industry Volume (K Unit), by Organization Size 2024 & 2032
- Figure 137: Middle East and Africa Blockchain in Fintech Industry Revenue Share (%), by Organization Size 2024 & 2032
- Figure 138: Middle East and Africa Blockchain in Fintech Industry Volume Share (%), by Organization Size 2024 & 2032
- Figure 139: Middle East and Africa Blockchain in Fintech Industry Revenue (Million), by End-user Verticals 2024 & 2032
- Figure 140: Middle East and Africa Blockchain in Fintech Industry Volume (K Unit), by End-user Verticals 2024 & 2032
- Figure 141: Middle East and Africa Blockchain in Fintech Industry Revenue Share (%), by End-user Verticals 2024 & 2032
- Figure 142: Middle East and Africa Blockchain in Fintech Industry Volume Share (%), by End-user Verticals 2024 & 2032
- Figure 143: Middle East and Africa Blockchain in Fintech Industry Revenue (Million), by Country 2024 & 2032
- Figure 144: Middle East and Africa Blockchain in Fintech Industry Volume (K Unit), by Country 2024 & 2032
- Figure 145: Middle East and Africa Blockchain in Fintech Industry Revenue Share (%), by Country 2024 & 2032
- Figure 146: Middle East and Africa Blockchain in Fintech Industry Volume Share (%), by Country 2024 & 2032
List of Tables
- Table 1: Global Blockchain in Fintech Industry Revenue Million Forecast, by Region 2019 & 2032
- Table 2: Global Blockchain in Fintech Industry Volume K Unit Forecast, by Region 2019 & 2032
- Table 3: Global Blockchain in Fintech Industry Revenue Million Forecast, by Provider 2019 & 2032
- Table 4: Global Blockchain in Fintech Industry Volume K Unit Forecast, by Provider 2019 & 2032
- Table 5: Global Blockchain in Fintech Industry Revenue Million Forecast, by Application 2019 & 2032
- Table 6: Global Blockchain in Fintech Industry Volume K Unit Forecast, by Application 2019 & 2032
- Table 7: Global Blockchain in Fintech Industry Revenue Million Forecast, by Organization Size 2019 & 2032
- Table 8: Global Blockchain in Fintech Industry Volume K Unit Forecast, by Organization Size 2019 & 2032
- Table 9: Global Blockchain in Fintech Industry Revenue Million Forecast, by End-user Verticals 2019 & 2032
- Table 10: Global Blockchain in Fintech Industry Volume K Unit Forecast, by End-user Verticals 2019 & 2032
- Table 11: Global Blockchain in Fintech Industry Revenue Million Forecast, by Region 2019 & 2032
- Table 12: Global Blockchain in Fintech Industry Volume K Unit Forecast, by Region 2019 & 2032
- Table 13: Global Blockchain in Fintech Industry Revenue Million Forecast, by Country 2019 & 2032
- Table 14: Global Blockchain in Fintech Industry Volume K Unit Forecast, by Country 2019 & 2032
- Table 15: United States Blockchain in Fintech Industry Revenue (Million) Forecast, by Application 2019 & 2032
- Table 16: United States Blockchain in Fintech Industry Volume (K Unit) Forecast, by Application 2019 & 2032
- Table 17: Canada Blockchain in Fintech Industry Revenue (Million) Forecast, by Application 2019 & 2032
- Table 18: Canada Blockchain in Fintech Industry Volume (K Unit) Forecast, by Application 2019 & 2032
- Table 19: Mexico Blockchain in Fintech Industry Revenue (Million) Forecast, by Application 2019 & 2032
- Table 20: Mexico Blockchain in Fintech Industry Volume (K Unit) Forecast, by Application 2019 & 2032
- Table 21: Global Blockchain in Fintech Industry Revenue Million Forecast, by Country 2019 & 2032
- Table 22: Global Blockchain in Fintech Industry Volume K Unit Forecast, by Country 2019 & 2032
- Table 23: Germany Blockchain in Fintech Industry Revenue (Million) Forecast, by Application 2019 & 2032
- Table 24: Germany Blockchain in Fintech Industry Volume (K Unit) Forecast, by Application 2019 & 2032
- Table 25: United Kingdom Blockchain in Fintech Industry Revenue (Million) Forecast, by Application 2019 & 2032
- Table 26: United Kingdom Blockchain in Fintech Industry Volume (K Unit) Forecast, by Application 2019 & 2032
- Table 27: France Blockchain in Fintech Industry Revenue (Million) Forecast, by Application 2019 & 2032
- Table 28: France Blockchain in Fintech Industry Volume (K Unit) Forecast, by Application 2019 & 2032
- Table 29: Spain Blockchain in Fintech Industry Revenue (Million) Forecast, by Application 2019 & 2032
- Table 30: Spain Blockchain in Fintech Industry Volume (K Unit) Forecast, by Application 2019 & 2032
- Table 31: Italy Blockchain in Fintech Industry Revenue (Million) Forecast, by Application 2019 & 2032
- Table 32: Italy Blockchain in Fintech Industry Volume (K Unit) Forecast, by Application 2019 & 2032
- Table 33: Spain Blockchain in Fintech Industry Revenue (Million) Forecast, by Application 2019 & 2032
- Table 34: Spain Blockchain in Fintech Industry Volume (K Unit) Forecast, by Application 2019 & 2032
- Table 35: Belgium Blockchain in Fintech Industry Revenue (Million) Forecast, by Application 2019 & 2032
- Table 36: Belgium Blockchain in Fintech Industry Volume (K Unit) Forecast, by Application 2019 & 2032
- Table 37: Netherland Blockchain in Fintech Industry Revenue (Million) Forecast, by Application 2019 & 2032
- Table 38: Netherland Blockchain in Fintech Industry Volume (K Unit) Forecast, by Application 2019 & 2032
- Table 39: Nordics Blockchain in Fintech Industry Revenue (Million) Forecast, by Application 2019 & 2032
- Table 40: Nordics Blockchain in Fintech Industry Volume (K Unit) Forecast, by Application 2019 & 2032
- Table 41: Rest of Europe Blockchain in Fintech Industry Revenue (Million) Forecast, by Application 2019 & 2032
- Table 42: Rest of Europe Blockchain in Fintech Industry Volume (K Unit) Forecast, by Application 2019 & 2032
- Table 43: Global Blockchain in Fintech Industry Revenue Million Forecast, by Country 2019 & 2032
- Table 44: Global Blockchain in Fintech Industry Volume K Unit Forecast, by Country 2019 & 2032
- Table 45: China Blockchain in Fintech Industry Revenue (Million) Forecast, by Application 2019 & 2032
- Table 46: China Blockchain in Fintech Industry Volume (K Unit) Forecast, by Application 2019 & 2032
- Table 47: Japan Blockchain in Fintech Industry Revenue (Million) Forecast, by Application 2019 & 2032
- Table 48: Japan Blockchain in Fintech Industry Volume (K Unit) Forecast, by Application 2019 & 2032
- Table 49: India Blockchain in Fintech Industry Revenue (Million) Forecast, by Application 2019 & 2032
- Table 50: India Blockchain in Fintech Industry Volume (K Unit) Forecast, by Application 2019 & 2032
- Table 51: South Korea Blockchain in Fintech Industry Revenue (Million) Forecast, by Application 2019 & 2032
- Table 52: South Korea Blockchain in Fintech Industry Volume (K Unit) Forecast, by Application 2019 & 2032
- Table 53: Southeast Asia Blockchain in Fintech Industry Revenue (Million) Forecast, by Application 2019 & 2032
- Table 54: Southeast Asia Blockchain in Fintech Industry Volume (K Unit) Forecast, by Application 2019 & 2032
- Table 55: Australia Blockchain in Fintech Industry Revenue (Million) Forecast, by Application 2019 & 2032
- Table 56: Australia Blockchain in Fintech Industry Volume (K Unit) Forecast, by Application 2019 & 2032
- Table 57: Indonesia Blockchain in Fintech Industry Revenue (Million) Forecast, by Application 2019 & 2032
- Table 58: Indonesia Blockchain in Fintech Industry Volume (K Unit) Forecast, by Application 2019 & 2032
- Table 59: Phillipes Blockchain in Fintech Industry Revenue (Million) Forecast, by Application 2019 & 2032
- Table 60: Phillipes Blockchain in Fintech Industry Volume (K Unit) Forecast, by Application 2019 & 2032
- Table 61: Singapore Blockchain in Fintech Industry Revenue (Million) Forecast, by Application 2019 & 2032
- Table 62: Singapore Blockchain in Fintech Industry Volume (K Unit) Forecast, by Application 2019 & 2032
- Table 63: Thailandc Blockchain in Fintech Industry Revenue (Million) Forecast, by Application 2019 & 2032
- Table 64: Thailandc Blockchain in Fintech Industry Volume (K Unit) Forecast, by Application 2019 & 2032
- Table 65: Rest of Asia Pacific Blockchain in Fintech Industry Revenue (Million) Forecast, by Application 2019 & 2032
- Table 66: Rest of Asia Pacific Blockchain in Fintech Industry Volume (K Unit) Forecast, by Application 2019 & 2032
- Table 67: Global Blockchain in Fintech Industry Revenue Million Forecast, by Country 2019 & 2032
- Table 68: Global Blockchain in Fintech Industry Volume K Unit Forecast, by Country 2019 & 2032
- Table 69: Brazil Blockchain in Fintech Industry Revenue (Million) Forecast, by Application 2019 & 2032
- Table 70: Brazil Blockchain in Fintech Industry Volume (K Unit) Forecast, by Application 2019 & 2032
- Table 71: Argentina Blockchain in Fintech Industry Revenue (Million) Forecast, by Application 2019 & 2032
- Table 72: Argentina Blockchain in Fintech Industry Volume (K Unit) Forecast, by Application 2019 & 2032
- Table 73: Peru Blockchain in Fintech Industry Revenue (Million) Forecast, by Application 2019 & 2032
- Table 74: Peru Blockchain in Fintech Industry Volume (K Unit) Forecast, by Application 2019 & 2032
- Table 75: Chile Blockchain in Fintech Industry Revenue (Million) Forecast, by Application 2019 & 2032
- Table 76: Chile Blockchain in Fintech Industry Volume (K Unit) Forecast, by Application 2019 & 2032
- Table 77: Colombia Blockchain in Fintech Industry Revenue (Million) Forecast, by Application 2019 & 2032
- Table 78: Colombia Blockchain in Fintech Industry Volume (K Unit) Forecast, by Application 2019 & 2032
- Table 79: Ecuador Blockchain in Fintech Industry Revenue (Million) Forecast, by Application 2019 & 2032
- Table 80: Ecuador Blockchain in Fintech Industry Volume (K Unit) Forecast, by Application 2019 & 2032
- Table 81: Venezuela Blockchain in Fintech Industry Revenue (Million) Forecast, by Application 2019 & 2032
- Table 82: Venezuela Blockchain in Fintech Industry Volume (K Unit) Forecast, by Application 2019 & 2032
- Table 83: Rest of South America Blockchain in Fintech Industry Revenue (Million) Forecast, by Application 2019 & 2032
- Table 84: Rest of South America Blockchain in Fintech Industry Volume (K Unit) Forecast, by Application 2019 & 2032
- Table 85: Global Blockchain in Fintech Industry Revenue Million Forecast, by Country 2019 & 2032
- Table 86: Global Blockchain in Fintech Industry Volume K Unit Forecast, by Country 2019 & 2032
- Table 87: United States Blockchain in Fintech Industry Revenue (Million) Forecast, by Application 2019 & 2032
- Table 88: United States Blockchain in Fintech Industry Volume (K Unit) Forecast, by Application 2019 & 2032
- Table 89: Canada Blockchain in Fintech Industry Revenue (Million) Forecast, by Application 2019 & 2032
- Table 90: Canada Blockchain in Fintech Industry Volume (K Unit) Forecast, by Application 2019 & 2032
- Table 91: Mexico Blockchain in Fintech Industry Revenue (Million) Forecast, by Application 2019 & 2032
- Table 92: Mexico Blockchain in Fintech Industry Volume (K Unit) Forecast, by Application 2019 & 2032
- Table 93: Global Blockchain in Fintech Industry Revenue Million Forecast, by Country 2019 & 2032
- Table 94: Global Blockchain in Fintech Industry Volume K Unit Forecast, by Country 2019 & 2032
- Table 95: United Arab Emirates Blockchain in Fintech Industry Revenue (Million) Forecast, by Application 2019 & 2032
- Table 96: United Arab Emirates Blockchain in Fintech Industry Volume (K Unit) Forecast, by Application 2019 & 2032
- Table 97: Saudi Arabia Blockchain in Fintech Industry Revenue (Million) Forecast, by Application 2019 & 2032
- Table 98: Saudi Arabia Blockchain in Fintech Industry Volume (K Unit) Forecast, by Application 2019 & 2032
- Table 99: South Africa Blockchain in Fintech Industry Revenue (Million) Forecast, by Application 2019 & 2032
- Table 100: South Africa Blockchain in Fintech Industry Volume (K Unit) Forecast, by Application 2019 & 2032
- Table 101: Rest of Middle East and Africa Blockchain in Fintech Industry Revenue (Million) Forecast, by Application 2019 & 2032
- Table 102: Rest of Middle East and Africa Blockchain in Fintech Industry Volume (K Unit) Forecast, by Application 2019 & 2032
- Table 103: Global Blockchain in Fintech Industry Revenue Million Forecast, by Provider 2019 & 2032
- Table 104: Global Blockchain in Fintech Industry Volume K Unit Forecast, by Provider 2019 & 2032
- Table 105: Global Blockchain in Fintech Industry Revenue Million Forecast, by Application 2019 & 2032
- Table 106: Global Blockchain in Fintech Industry Volume K Unit Forecast, by Application 2019 & 2032
- Table 107: Global Blockchain in Fintech Industry Revenue Million Forecast, by Organization Size 2019 & 2032
- Table 108: Global Blockchain in Fintech Industry Volume K Unit Forecast, by Organization Size 2019 & 2032
- Table 109: Global Blockchain in Fintech Industry Revenue Million Forecast, by End-user Verticals 2019 & 2032
- Table 110: Global Blockchain in Fintech Industry Volume K Unit Forecast, by End-user Verticals 2019 & 2032
- Table 111: Global Blockchain in Fintech Industry Revenue Million Forecast, by Country 2019 & 2032
- Table 112: Global Blockchain in Fintech Industry Volume K Unit Forecast, by Country 2019 & 2032
- Table 113: Global Blockchain in Fintech Industry Revenue Million Forecast, by Provider 2019 & 2032
- Table 114: Global Blockchain in Fintech Industry Volume K Unit Forecast, by Provider 2019 & 2032
- Table 115: Global Blockchain in Fintech Industry Revenue Million Forecast, by Application 2019 & 2032
- Table 116: Global Blockchain in Fintech Industry Volume K Unit Forecast, by Application 2019 & 2032
- Table 117: Global Blockchain in Fintech Industry Revenue Million Forecast, by Organization Size 2019 & 2032
- Table 118: Global Blockchain in Fintech Industry Volume K Unit Forecast, by Organization Size 2019 & 2032
- Table 119: Global Blockchain in Fintech Industry Revenue Million Forecast, by End-user Verticals 2019 & 2032
- Table 120: Global Blockchain in Fintech Industry Volume K Unit Forecast, by End-user Verticals 2019 & 2032
- Table 121: Global Blockchain in Fintech Industry Revenue Million Forecast, by Country 2019 & 2032
- Table 122: Global Blockchain in Fintech Industry Volume K Unit Forecast, by Country 2019 & 2032
- Table 123: Global Blockchain in Fintech Industry Revenue Million Forecast, by Provider 2019 & 2032
- Table 124: Global Blockchain in Fintech Industry Volume K Unit Forecast, by Provider 2019 & 2032
- Table 125: Global Blockchain in Fintech Industry Revenue Million Forecast, by Application 2019 & 2032
- Table 126: Global Blockchain in Fintech Industry Volume K Unit Forecast, by Application 2019 & 2032
- Table 127: Global Blockchain in Fintech Industry Revenue Million Forecast, by Organization Size 2019 & 2032
- Table 128: Global Blockchain in Fintech Industry Volume K Unit Forecast, by Organization Size 2019 & 2032
- Table 129: Global Blockchain in Fintech Industry Revenue Million Forecast, by End-user Verticals 2019 & 2032
- Table 130: Global Blockchain in Fintech Industry Volume K Unit Forecast, by End-user Verticals 2019 & 2032
- Table 131: Global Blockchain in Fintech Industry Revenue Million Forecast, by Country 2019 & 2032
- Table 132: Global Blockchain in Fintech Industry Volume K Unit Forecast, by Country 2019 & 2032
- Table 133: Global Blockchain in Fintech Industry Revenue Million Forecast, by Provider 2019 & 2032
- Table 134: Global Blockchain in Fintech Industry Volume K Unit Forecast, by Provider 2019 & 2032
- Table 135: Global Blockchain in Fintech Industry Revenue Million Forecast, by Application 2019 & 2032
- Table 136: Global Blockchain in Fintech Industry Volume K Unit Forecast, by Application 2019 & 2032
- Table 137: Global Blockchain in Fintech Industry Revenue Million Forecast, by Organization Size 2019 & 2032
- Table 138: Global Blockchain in Fintech Industry Volume K Unit Forecast, by Organization Size 2019 & 2032
- Table 139: Global Blockchain in Fintech Industry Revenue Million Forecast, by End-user Verticals 2019 & 2032
- Table 140: Global Blockchain in Fintech Industry Volume K Unit Forecast, by End-user Verticals 2019 & 2032
- Table 141: Global Blockchain in Fintech Industry Revenue Million Forecast, by Country 2019 & 2032
- Table 142: Global Blockchain in Fintech Industry Volume K Unit Forecast, by Country 2019 & 2032
- Table 143: Global Blockchain in Fintech Industry Revenue Million Forecast, by Provider 2019 & 2032
- Table 144: Global Blockchain in Fintech Industry Volume K Unit Forecast, by Provider 2019 & 2032
- Table 145: Global Blockchain in Fintech Industry Revenue Million Forecast, by Application 2019 & 2032
- Table 146: Global Blockchain in Fintech Industry Volume K Unit Forecast, by Application 2019 & 2032
- Table 147: Global Blockchain in Fintech Industry Revenue Million Forecast, by Organization Size 2019 & 2032
- Table 148: Global Blockchain in Fintech Industry Volume K Unit Forecast, by Organization Size 2019 & 2032
- Table 149: Global Blockchain in Fintech Industry Revenue Million Forecast, by End-user Verticals 2019 & 2032
- Table 150: Global Blockchain in Fintech Industry Volume K Unit Forecast, by End-user Verticals 2019 & 2032
- Table 151: Global Blockchain in Fintech Industry Revenue Million Forecast, by Country 2019 & 2032
- Table 152: Global Blockchain in Fintech Industry Volume K Unit Forecast, by Country 2019 & 2032
- Table 153: Global Blockchain in Fintech Industry Revenue Million Forecast, by Provider 2019 & 2032
- Table 154: Global Blockchain in Fintech Industry Volume K Unit Forecast, by Provider 2019 & 2032
- Table 155: Global Blockchain in Fintech Industry Revenue Million Forecast, by Application 2019 & 2032
- Table 156: Global Blockchain in Fintech Industry Volume K Unit Forecast, by Application 2019 & 2032
- Table 157: Global Blockchain in Fintech Industry Revenue Million Forecast, by Organization Size 2019 & 2032
- Table 158: Global Blockchain in Fintech Industry Volume K Unit Forecast, by Organization Size 2019 & 2032
- Table 159: Global Blockchain in Fintech Industry Revenue Million Forecast, by End-user Verticals 2019 & 2032
- Table 160: Global Blockchain in Fintech Industry Volume K Unit Forecast, by End-user Verticals 2019 & 2032
- Table 161: Global Blockchain in Fintech Industry Revenue Million Forecast, by Country 2019 & 2032
- Table 162: Global Blockchain in Fintech Industry Volume K Unit Forecast, by Country 2019 & 2032
Frequently Asked Questions
1. What is the projected Compound Annual Growth Rate (CAGR) of the Blockchain in Fintech Industry?
The projected CAGR is approximately 46.92%.
2. Which companies are prominent players in the Blockchain in Fintech Industry?
Key companies in the market include RecordesKeeper, Bitfury Group Limited, IBM Corporation, Circle Internet Financial Limited, Coinbase Inc, Factom Inc, Microsoft Corporation, Cambridge Blockchain LLC, Accenture Plc, Amazon Web Services Inc, Earthport Plc, Digital Asset Holdings LLC, Oracle Corporation, AlphaPoint Corporation, GuardTime AS, Ripple Lab Inc.
3. What are the main segments of the Blockchain in Fintech Industry?
The market segments include Provider, Application, Organization Size, End-user Verticals.
4. Can you provide details about the market size?
The market size is estimated to be USD 4.66 Million as of 2022.
5. What are some drivers contributing to market growth?
Rising R&D Activities for Transformative and Highly Intelligent Programmable Blockchain Platform; Increasing Adoption of Blockchain Technology for Applications in Banking Sector Such As Payments. Smart Contracts. Etc.; Reduced Total Cost of Ownership.
6. What are the notable trends driving market growth?
Increasing Use of Blockchain in the Insurance Sector is expected to Drive the Market.
7. Are there any restraints impacting market growth?
High Cost of Ownership.
8. Can you provide examples of recent developments in the market?
October 2022, Nubank: A Brazilian digital banking startup, Nubank, announced its plan to launch its own cryptocurrency called Nucoin in Brazil by the first half of 2023. This move by Nubank is a significant step towards leveraging the transformative potential of blockchain technology and democratizing its benefits beyond just the buying, selling, and holding of cryptocurrencies in Nuapp.
9. What pricing options are available for accessing the report?
Pricing options include single-user, multi-user, and enterprise licenses priced at USD 4750, USD 5250, and USD 8750 respectively.
10. Is the market size provided in terms of value or volume?
The market size is provided in terms of value, measured in Million and volume, measured in K Unit.
11. Are there any specific market keywords associated with the report?
Yes, the market keyword associated with the report is "Blockchain in Fintech Industry," which aids in identifying and referencing the specific market segment covered.
12. How do I determine which pricing option suits my needs best?
The pricing options vary based on user requirements and access needs. Individual users may opt for single-user licenses, while businesses requiring broader access may choose multi-user or enterprise licenses for cost-effective access to the report.
13. Are there any additional resources or data provided in the Blockchain in Fintech Industry report?
While the report offers comprehensive insights, it's advisable to review the specific contents or supplementary materials provided to ascertain if additional resources or data are available.
14. How can I stay updated on further developments or reports in the Blockchain in Fintech Industry?
To stay informed about further developments, trends, and reports in the Blockchain in Fintech Industry, consider subscribing to industry newsletters, following relevant companies and organizations, or regularly checking reputable industry news sources and publications.
Methodology
Step 1 - Identification of Relevant Samples Size from Population Database


Step 2 - Approaches for Defining Global Market Size (Value, Volume* & Price*)

Note*: In applicable scenarios
Step 3 - Data Sources
Primary Research
- Web Analytics
- Survey Reports
- Research Institute
- Latest Research Reports
- Opinion Leaders
Secondary Research
- Annual Reports
- White Paper
- Latest Press Release
- Industry Association
- Paid Database
- Investor Presentations

Step 4 - Data Triangulation
Involves using different sources of information in order to increase the validity of a study
These sources are likely to be stakeholders in a program - participants, other researchers, program staff, other community members, and so on.
Then we put all data in single framework & apply various statistical tools to find out the dynamic on the market.
During the analysis stage, feedback from the stakeholder groups would be compared to determine areas of agreement as well as areas of divergence
