

Key Insights
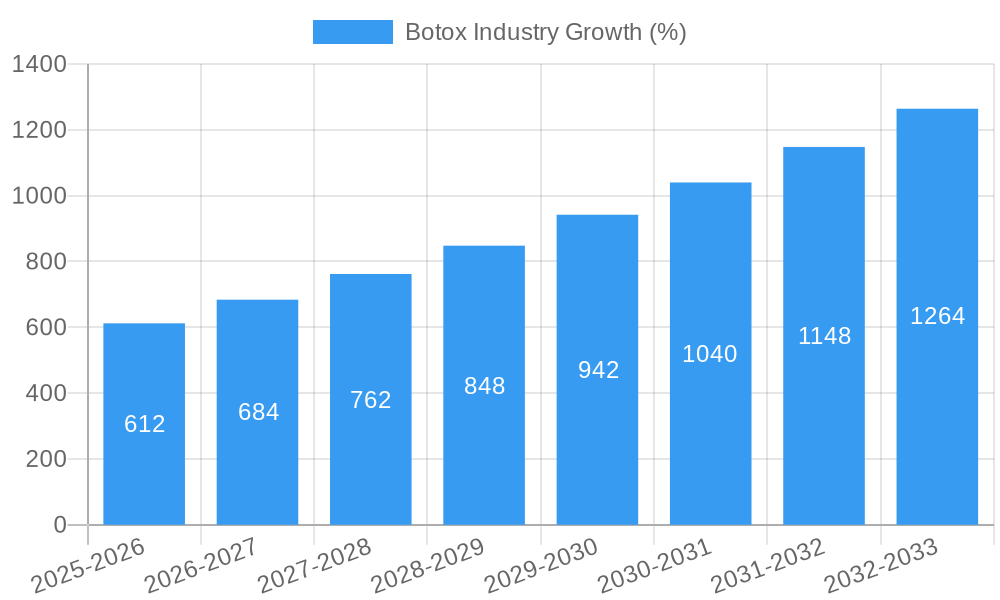
The global Botox market, valued at $6.49 billion in 2025, is projected to experience robust growth, driven by a Compound Annual Growth Rate (CAGR) of 9.20% from 2025 to 2033. This expansion is fueled by several key factors. Increasing awareness of aesthetic treatments and a rising demand for minimally invasive cosmetic procedures are primary drivers. The aging global population, coupled with a growing preference for non-surgical rejuvenation options, further contributes to market growth. Technological advancements leading to improved formulations and delivery methods, along with increased accessibility to Botox treatments in various settings—spas, clinics, and hospitals—are also significant contributors. While the market is largely dominated by established players like AbbVie Inc (Allergan), Galderma, and Merz Pharma, the presence of several emerging companies indicates a competitive landscape with potential for innovation and new product introductions. Specific applications within the cosmetics sector, such as wrinkle reduction and treatment of excessive sweating, continue to be major revenue generators. The non-cosmetic applications, including therapeutic uses like migraine treatment and muscle spasm relief, are also demonstrating significant potential for growth, further broadening the market appeal and reach.
The geographic distribution of the Botox market reveals regional variations in growth trajectories. North America currently holds a substantial market share, driven by high disposable incomes and the early adoption of aesthetic treatments. However, rapidly developing economies in Asia-Pacific, particularly in China and India, are emerging as significant growth hotspots. This is attributed to rising middle-class populations, increasing healthcare expenditure, and growing awareness of aesthetic enhancement options. Europe and other regions are expected to contribute steadily to the overall market expansion, but at a slightly lower rate than the faster-growing regions. Competition within the market is likely to intensify as existing companies continue to innovate and new entrants challenge the established order. Maintaining a robust marketing and distribution network across various regions will be critical for future market success.
Botox Industry Market Report: 2019-2033
This comprehensive report provides an in-depth analysis of the global Botox industry, encompassing market dynamics, growth trends, competitive landscape, and future outlook. The study period covers 2019-2033, with 2025 as the base year and forecast period spanning 2025-2033. The report leverages extensive primary and secondary research to offer actionable insights for industry professionals, investors, and stakeholders. The total market size is projected to reach xx Million units by 2033.

Botox Industry Market Dynamics & Structure
The global Botox market is characterized by a moderately concentrated landscape, with key players like AbbVie Inc (Allergan), Galderma, and Merz Pharma holding significant market share. Technological innovation, primarily focused on improved efficacy, longer duration of effect, and reduced side effects, is a key driver. Stringent regulatory frameworks governing the production and use of botulinum toxins influence market access and expansion. Competitive pressures stem from the emergence of biosimilar products and the development of alternative aesthetic treatments. The end-user demographic is predominantly female, aged 35-65, with growing interest across various age groups. M&A activity in the sector has been moderate, with xx deals recorded between 2019 and 2024. This consolidation reflects the quest for enhanced market position and expansion into new therapeutic areas.
- Market Concentration: Moderately concentrated, with top 3 players holding approximately xx% market share in 2024.
- Innovation Drivers: Improved efficacy, longer duration, reduced side effects, novel delivery systems.
- Regulatory Landscape: Stringent approvals and post-market surveillance requirements vary by region.
- Competitive Substitutes: Fillers, other injectables, surgical procedures.
- End-User Demographics: Predominantly female, aged 35-65, expanding to younger and older demographics.
- M&A Trends: Moderate activity (xx deals, 2019-2024), driven by consolidation and expansion.
Botox Industry Growth Trends & Insights
The global Botox market experienced robust growth between 2019 and 2024, driven by increasing demand for cosmetic procedures, rising disposable incomes in emerging economies, and heightened awareness of aesthetic enhancements. The market size expanded from xx Million units in 2019 to xx Million units in 2024, exhibiting a CAGR of xx%. This growth is expected to continue, though at a moderated pace, reaching xx Million units by 2033, with a projected CAGR of xx% during the forecast period. Technological advancements, such as improved formulations and delivery methods, further fuel market expansion. Changing consumer preferences, including a growing preference for minimally invasive procedures and a wider acceptance of aesthetic interventions, significantly contribute to market growth. Market penetration remains relatively low in several emerging markets, indicating significant untapped potential.
Dominant Regions, Countries, or Segments in Botox Industry
North America (primarily the United States) currently dominates the Botox market, accounting for approximately xx% of global sales in 2024, followed by Europe and Asia-Pacific. This dominance is attributed to high disposable incomes, established aesthetic treatment markets, and high awareness levels. Within the application segments, cosmetic applications represent the largest share (xx%), followed by non-cosmetic applications (xx%). Clinics and hospitals are the primary end-users (xx%), exceeding the contribution from spas and beauty centers.
- North America: High disposable incomes, established aesthetic market, high awareness.
- Europe: Growing demand, increasing acceptance of cosmetic procedures.
- Asia-Pacific: Rapidly growing market, increasing disposable incomes, rising awareness.
- Cosmetic Applications: Largest segment driven by increasing demand for anti-aging treatments and aesthetic enhancements.
- Clinics and Hospitals: Preferred end-users due to expertise, safety, and efficacy of treatments.
Botox Industry Product Landscape
The Botox product landscape is characterized by a range of formulations with varying potencies and durations of effect. Innovations focus on improving efficacy, reducing side effects, and extending the duration of action. Companies are also exploring new delivery methods, including pre-filled syringes and customized treatment protocols. Unique selling propositions often revolve around specific formulations, superior efficacy, and minimal downtime.
Key Drivers, Barriers & Challenges in Botox Industry
Key Drivers:
- Increasing demand for minimally invasive cosmetic procedures.
- Rising disposable incomes and changing lifestyle preferences in developing countries.
- Technological advancements leading to improved efficacy and safety.
- Favorable regulatory environment in key markets.
Key Challenges & Restraints:
- Intense competition from existing and emerging players, including biosimilar products.
- High cost of treatment limiting accessibility in some regions.
- Safety concerns and potential side effects, requiring stringent regulatory oversight.
- Supply chain disruptions impacting product availability and pricing.
Emerging Opportunities in Botox Industry
- Expansion into untapped markets in developing countries.
- Development of innovative formulations with extended duration and reduced side effects.
- Exploration of new therapeutic applications beyond cosmetic uses.
- Personalized treatment approaches based on individual patient needs.
Growth Accelerators in the Botox Industry
Technological breakthroughs in botulinum toxin formulations, strategic partnerships to expand market reach, and the development of innovative delivery systems are key catalysts for long-term growth in the Botox industry. Further expansion into new therapeutic applications, combined with targeted marketing and educational campaigns, will contribute to sustained market expansion and increased market penetration.
Key Players Shaping the Botox Industry Market
- AbbVie Inc (Allergan)
- Galderma
- Medytox
- Revance Therapeutics Inc (Revance Aesthetics)
- Evolus Inc
- Hughs
- Merz Pharma GmbH & Co KGaA
- Daewoong Pharmaceuticals
- Eisai
- Ipsen Biopharmaceuticals Inc
- HUGEL
- USWM LLC
Notable Milestones in Botox Industry Sector
- October 2023: Huadong Medicine Aesthetics Investment (HongKong) Limited (Sinclair) formed a global license agreement with ATGC Co. Ltd to manufacture and commercialize ATGC-110 (botulinum toxin) globally.
- March 2024: Hugel America Inc. announced that the United States Food and Drugs Administration (US FDA) had approved Letybo (Neurotoxin) for the management of moderate-to-severe glabellar (frown) lines in adults.
In-Depth Botox Industry Market Outlook
The future of the Botox industry is promising, driven by sustained demand for cosmetic and therapeutic applications, ongoing technological advancements, and expansion into new geographic markets. Strategic partnerships, innovative product development, and effective marketing strategies will be crucial for companies to capitalize on the significant growth potential in this dynamic sector. The market is poised for continued expansion, particularly in emerging markets with rising disposable incomes and increasing awareness of aesthetic enhancements.
Botox Industry Segmentation
-
1. Application
-
1.1. Cosmetic Applications
- 1.1.1. Glabellar Lines
- 1.1.2. Lateral Canthal Lines (Crow's Feet)
- 1.1.3. Forehead Lines
- 1.1.4. Other Cosmetic Applications
-
1.2. Non-cosmetic Applications
- 1.2.1. Dystonia
- 1.2.2. Chronic Migraine
- 1.2.3. Ophthalmologic Disorders
- 1.2.4. Other Non-cosmetic Applications
-
1.1. Cosmetic Applications
-
2. End User
- 2.1. Spas and Beauty Centers
- 2.2. Clinics and Hospitals
Botox Industry Segmentation By Geography
-
1. North America
- 1.1. United States
- 1.2. Canada
- 1.3. Mexico
-
2. Europe
- 2.1. Germany
- 2.2. United Kingdom
- 2.3. France
- 2.4. Italy
- 2.5. Spain
- 2.6. Rest of Europe
-
3. Asia Pacific
- 3.1. China
- 3.2. Japan
- 3.3. India
- 3.4. Australia
- 3.5. South Korea
- 3.6. Rest of Asia Pacific
-
4. Middle East and Africa
- 4.1. GCC
- 4.2. South Africa
- 4.3. Rest of Middle East and Africa
-
5. South America
- 5.1. Brazil
- 5.2. Argentina
- 5.3. Rest of South America

Botox Industry REPORT HIGHLIGHTS
| Aspects | Details |
|---|---|
| Study Period | 2019-2033 |
| Base Year | 2024 |
| Estimated Year | 2025 |
| Forecast Period | 2025-2033 |
| Historical Period | 2019-2024 |
| Growth Rate | CAGR of 9.20% from 2019-2033 |
| Segmentation |
|
Table of Contents
- 1. Introduction
- 1.1. Research Scope
- 1.2. Market Segmentation
- 1.3. Research Methodology
- 1.4. Definitions and Assumptions
- 2. Executive Summary
- 2.1. Introduction
- 3. Market Dynamics
- 3.1. Introduction
- 3.2. Market Drivers
- 3.2.1. Increasing Demand for Aesthetic Procedures; Growing Research and Development Initiatives to Expand the Therapeutic Applications of Botulinum Toxin
- 3.3. Market Restrains
- 3.3.1. Adverse Effects Associated with Botulinum Toxin; Lack of Reimbursement Policies Supporting Cosmetic Procedures
- 3.4. Market Trends
- 3.4.1. Glabellar Lines Segment is Expected to Hold Significant Share in the Market Over the Forecast Period
- 4. Market Factor Analysis
- 4.1. Porters Five Forces
- 4.2. Supply/Value Chain
- 4.3. PESTEL analysis
- 4.4. Market Entropy
- 4.5. Patent/Trademark Analysis
- 5. Global Botox Industry Analysis, Insights and Forecast, 2019-2031
- 5.1. Market Analysis, Insights and Forecast - by Application
- 5.1.1. Cosmetic Applications
- 5.1.1.1. Glabellar Lines
- 5.1.1.2. Lateral Canthal Lines (Crow's Feet)
- 5.1.1.3. Forehead Lines
- 5.1.1.4. Other Cosmetic Applications
- 5.1.2. Non-cosmetic Applications
- 5.1.2.1. Dystonia
- 5.1.2.2. Chronic Migraine
- 5.1.2.3. Ophthalmologic Disorders
- 5.1.2.4. Other Non-cosmetic Applications
- 5.1.1. Cosmetic Applications
- 5.2. Market Analysis, Insights and Forecast - by End User
- 5.2.1. Spas and Beauty Centers
- 5.2.2. Clinics and Hospitals
- 5.3. Market Analysis, Insights and Forecast - by Region
- 5.3.1. North America
- 5.3.2. Europe
- 5.3.3. Asia Pacific
- 5.3.4. Middle East and Africa
- 5.3.5. South America
- 5.1. Market Analysis, Insights and Forecast - by Application
- 6. North America Botox Industry Analysis, Insights and Forecast, 2019-2031
- 6.1. Market Analysis, Insights and Forecast - by Application
- 6.1.1. Cosmetic Applications
- 6.1.1.1. Glabellar Lines
- 6.1.1.2. Lateral Canthal Lines (Crow's Feet)
- 6.1.1.3. Forehead Lines
- 6.1.1.4. Other Cosmetic Applications
- 6.1.2. Non-cosmetic Applications
- 6.1.2.1. Dystonia
- 6.1.2.2. Chronic Migraine
- 6.1.2.3. Ophthalmologic Disorders
- 6.1.2.4. Other Non-cosmetic Applications
- 6.1.1. Cosmetic Applications
- 6.2. Market Analysis, Insights and Forecast - by End User
- 6.2.1. Spas and Beauty Centers
- 6.2.2. Clinics and Hospitals
- 6.1. Market Analysis, Insights and Forecast - by Application
- 7. Europe Botox Industry Analysis, Insights and Forecast, 2019-2031
- 7.1. Market Analysis, Insights and Forecast - by Application
- 7.1.1. Cosmetic Applications
- 7.1.1.1. Glabellar Lines
- 7.1.1.2. Lateral Canthal Lines (Crow's Feet)
- 7.1.1.3. Forehead Lines
- 7.1.1.4. Other Cosmetic Applications
- 7.1.2. Non-cosmetic Applications
- 7.1.2.1. Dystonia
- 7.1.2.2. Chronic Migraine
- 7.1.2.3. Ophthalmologic Disorders
- 7.1.2.4. Other Non-cosmetic Applications
- 7.1.1. Cosmetic Applications
- 7.2. Market Analysis, Insights and Forecast - by End User
- 7.2.1. Spas and Beauty Centers
- 7.2.2. Clinics and Hospitals
- 7.1. Market Analysis, Insights and Forecast - by Application
- 8. Asia Pacific Botox Industry Analysis, Insights and Forecast, 2019-2031
- 8.1. Market Analysis, Insights and Forecast - by Application
- 8.1.1. Cosmetic Applications
- 8.1.1.1. Glabellar Lines
- 8.1.1.2. Lateral Canthal Lines (Crow's Feet)
- 8.1.1.3. Forehead Lines
- 8.1.1.4. Other Cosmetic Applications
- 8.1.2. Non-cosmetic Applications
- 8.1.2.1. Dystonia
- 8.1.2.2. Chronic Migraine
- 8.1.2.3. Ophthalmologic Disorders
- 8.1.2.4. Other Non-cosmetic Applications
- 8.1.1. Cosmetic Applications
- 8.2. Market Analysis, Insights and Forecast - by End User
- 8.2.1. Spas and Beauty Centers
- 8.2.2. Clinics and Hospitals
- 8.1. Market Analysis, Insights and Forecast - by Application
- 9. Middle East and Africa Botox Industry Analysis, Insights and Forecast, 2019-2031
- 9.1. Market Analysis, Insights and Forecast - by Application
- 9.1.1. Cosmetic Applications
- 9.1.1.1. Glabellar Lines
- 9.1.1.2. Lateral Canthal Lines (Crow's Feet)
- 9.1.1.3. Forehead Lines
- 9.1.1.4. Other Cosmetic Applications
- 9.1.2. Non-cosmetic Applications
- 9.1.2.1. Dystonia
- 9.1.2.2. Chronic Migraine
- 9.1.2.3. Ophthalmologic Disorders
- 9.1.2.4. Other Non-cosmetic Applications
- 9.1.1. Cosmetic Applications
- 9.2. Market Analysis, Insights and Forecast - by End User
- 9.2.1. Spas and Beauty Centers
- 9.2.2. Clinics and Hospitals
- 9.1. Market Analysis, Insights and Forecast - by Application
- 10. South America Botox Industry Analysis, Insights and Forecast, 2019-2031
- 10.1. Market Analysis, Insights and Forecast - by Application
- 10.1.1. Cosmetic Applications
- 10.1.1.1. Glabellar Lines
- 10.1.1.2. Lateral Canthal Lines (Crow's Feet)
- 10.1.1.3. Forehead Lines
- 10.1.1.4. Other Cosmetic Applications
- 10.1.2. Non-cosmetic Applications
- 10.1.2.1. Dystonia
- 10.1.2.2. Chronic Migraine
- 10.1.2.3. Ophthalmologic Disorders
- 10.1.2.4. Other Non-cosmetic Applications
- 10.1.1. Cosmetic Applications
- 10.2. Market Analysis, Insights and Forecast - by End User
- 10.2.1. Spas and Beauty Centers
- 10.2.2. Clinics and Hospitals
- 10.1. Market Analysis, Insights and Forecast - by Application
- 11. North America Botox Industry Analysis, Insights and Forecast, 2019-2031
- 11.1. Market Analysis, Insights and Forecast - By Country/Sub-region
- 11.1.1 United States
- 11.1.2 Canada
- 11.1.3 Mexico
- 12. Europe Botox Industry Analysis, Insights and Forecast, 2019-2031
- 12.1. Market Analysis, Insights and Forecast - By Country/Sub-region
- 12.1.1 Germany
- 12.1.2 United Kingdom
- 12.1.3 France
- 12.1.4 Italy
- 12.1.5 Spain
- 12.1.6 Rest of Europe
- 13. Asia Pacific Botox Industry Analysis, Insights and Forecast, 2019-2031
- 13.1. Market Analysis, Insights and Forecast - By Country/Sub-region
- 13.1.1 China
- 13.1.2 Japan
- 13.1.3 India
- 13.1.4 Australia
- 13.1.5 South Korea
- 13.1.6 Rest of Asia Pacific
- 14. Middle East and Africa Botox Industry Analysis, Insights and Forecast, 2019-2031
- 14.1. Market Analysis, Insights and Forecast - By Country/Sub-region
- 14.1.1 GCC
- 14.1.2 South Africa
- 14.1.3 Rest of Middle East and Africa
- 15. South America Botox Industry Analysis, Insights and Forecast, 2019-2031
- 15.1. Market Analysis, Insights and Forecast - By Country/Sub-region
- 15.1.1 Brazil
- 15.1.2 Argentina
- 15.1.3 Rest of South America
- 16. Competitive Analysis
- 16.1. Global Market Share Analysis 2024
- 16.2. Company Profiles
- 16.2.1 AbbVie Inc (Allergan)
- 16.2.1.1. Overview
- 16.2.1.2. Products
- 16.2.1.3. SWOT Analysis
- 16.2.1.4. Recent Developments
- 16.2.1.5. Financials (Based on Availability)
- 16.2.2 Galderma
- 16.2.2.1. Overview
- 16.2.2.2. Products
- 16.2.2.3. SWOT Analysis
- 16.2.2.4. Recent Developments
- 16.2.2.5. Financials (Based on Availability)
- 16.2.3 Medytox
- 16.2.3.1. Overview
- 16.2.3.2. Products
- 16.2.3.3. SWOT Analysis
- 16.2.3.4. Recent Developments
- 16.2.3.5. Financials (Based on Availability)
- 16.2.4 Revance Therapeutics Inc (Revance Aesthetics)
- 16.2.4.1. Overview
- 16.2.4.2. Products
- 16.2.4.3. SWOT Analysis
- 16.2.4.4. Recent Developments
- 16.2.4.5. Financials (Based on Availability)
- 16.2.5 Evolus Inc
- 16.2.5.1. Overview
- 16.2.5.2. Products
- 16.2.5.3. SWOT Analysis
- 16.2.5.4. Recent Developments
- 16.2.5.5. Financials (Based on Availability)
- 16.2.6 Hughs
- 16.2.6.1. Overview
- 16.2.6.2. Products
- 16.2.6.3. SWOT Analysis
- 16.2.6.4. Recent Developments
- 16.2.6.5. Financials (Based on Availability)
- 16.2.7 Merz Pharma GmbH & Co KGaA
- 16.2.7.1. Overview
- 16.2.7.2. Products
- 16.2.7.3. SWOT Analysis
- 16.2.7.4. Recent Developments
- 16.2.7.5. Financials (Based on Availability)
- 16.2.8 Daewoong Pharmaceuticals
- 16.2.8.1. Overview
- 16.2.8.2. Products
- 16.2.8.3. SWOT Analysis
- 16.2.8.4. Recent Developments
- 16.2.8.5. Financials (Based on Availability)
- 16.2.9 Eisai
- 16.2.9.1. Overview
- 16.2.9.2. Products
- 16.2.9.3. SWOT Analysis
- 16.2.9.4. Recent Developments
- 16.2.9.5. Financials (Based on Availability)
- 16.2.10 Ipsen Biopharmaceuticals Inc
- 16.2.10.1. Overview
- 16.2.10.2. Products
- 16.2.10.3. SWOT Analysis
- 16.2.10.4. Recent Developments
- 16.2.10.5. Financials (Based on Availability)
- 16.2.11 HUGEL
- 16.2.11.1. Overview
- 16.2.11.2. Products
- 16.2.11.3. SWOT Analysis
- 16.2.11.4. Recent Developments
- 16.2.11.5. Financials (Based on Availability)
- 16.2.12 USWM LLC
- 16.2.12.1. Overview
- 16.2.12.2. Products
- 16.2.12.3. SWOT Analysis
- 16.2.12.4. Recent Developments
- 16.2.12.5. Financials (Based on Availability)
- 16.2.1 AbbVie Inc (Allergan)
List of Figures
- Figure 1: Global Botox Industry Revenue Breakdown (Million, %) by Region 2024 & 2032
- Figure 2: Global Botox Industry Volume Breakdown (K Unit, %) by Region 2024 & 2032
- Figure 3: North America Botox Industry Revenue (Million), by Country 2024 & 2032
- Figure 4: North America Botox Industry Volume (K Unit), by Country 2024 & 2032
- Figure 5: North America Botox Industry Revenue Share (%), by Country 2024 & 2032
- Figure 6: North America Botox Industry Volume Share (%), by Country 2024 & 2032
- Figure 7: Europe Botox Industry Revenue (Million), by Country 2024 & 2032
- Figure 8: Europe Botox Industry Volume (K Unit), by Country 2024 & 2032
- Figure 9: Europe Botox Industry Revenue Share (%), by Country 2024 & 2032
- Figure 10: Europe Botox Industry Volume Share (%), by Country 2024 & 2032
- Figure 11: Asia Pacific Botox Industry Revenue (Million), by Country 2024 & 2032
- Figure 12: Asia Pacific Botox Industry Volume (K Unit), by Country 2024 & 2032
- Figure 13: Asia Pacific Botox Industry Revenue Share (%), by Country 2024 & 2032
- Figure 14: Asia Pacific Botox Industry Volume Share (%), by Country 2024 & 2032
- Figure 15: Middle East and Africa Botox Industry Revenue (Million), by Country 2024 & 2032
- Figure 16: Middle East and Africa Botox Industry Volume (K Unit), by Country 2024 & 2032
- Figure 17: Middle East and Africa Botox Industry Revenue Share (%), by Country 2024 & 2032
- Figure 18: Middle East and Africa Botox Industry Volume Share (%), by Country 2024 & 2032
- Figure 19: South America Botox Industry Revenue (Million), by Country 2024 & 2032
- Figure 20: South America Botox Industry Volume (K Unit), by Country 2024 & 2032
- Figure 21: South America Botox Industry Revenue Share (%), by Country 2024 & 2032
- Figure 22: South America Botox Industry Volume Share (%), by Country 2024 & 2032
- Figure 23: North America Botox Industry Revenue (Million), by Application 2024 & 2032
- Figure 24: North America Botox Industry Volume (K Unit), by Application 2024 & 2032
- Figure 25: North America Botox Industry Revenue Share (%), by Application 2024 & 2032
- Figure 26: North America Botox Industry Volume Share (%), by Application 2024 & 2032
- Figure 27: North America Botox Industry Revenue (Million), by End User 2024 & 2032
- Figure 28: North America Botox Industry Volume (K Unit), by End User 2024 & 2032
- Figure 29: North America Botox Industry Revenue Share (%), by End User 2024 & 2032
- Figure 30: North America Botox Industry Volume Share (%), by End User 2024 & 2032
- Figure 31: North America Botox Industry Revenue (Million), by Country 2024 & 2032
- Figure 32: North America Botox Industry Volume (K Unit), by Country 2024 & 2032
- Figure 33: North America Botox Industry Revenue Share (%), by Country 2024 & 2032
- Figure 34: North America Botox Industry Volume Share (%), by Country 2024 & 2032
- Figure 35: Europe Botox Industry Revenue (Million), by Application 2024 & 2032
- Figure 36: Europe Botox Industry Volume (K Unit), by Application 2024 & 2032
- Figure 37: Europe Botox Industry Revenue Share (%), by Application 2024 & 2032
- Figure 38: Europe Botox Industry Volume Share (%), by Application 2024 & 2032
- Figure 39: Europe Botox Industry Revenue (Million), by End User 2024 & 2032
- Figure 40: Europe Botox Industry Volume (K Unit), by End User 2024 & 2032
- Figure 41: Europe Botox Industry Revenue Share (%), by End User 2024 & 2032
- Figure 42: Europe Botox Industry Volume Share (%), by End User 2024 & 2032
- Figure 43: Europe Botox Industry Revenue (Million), by Country 2024 & 2032
- Figure 44: Europe Botox Industry Volume (K Unit), by Country 2024 & 2032
- Figure 45: Europe Botox Industry Revenue Share (%), by Country 2024 & 2032
- Figure 46: Europe Botox Industry Volume Share (%), by Country 2024 & 2032
- Figure 47: Asia Pacific Botox Industry Revenue (Million), by Application 2024 & 2032
- Figure 48: Asia Pacific Botox Industry Volume (K Unit), by Application 2024 & 2032
- Figure 49: Asia Pacific Botox Industry Revenue Share (%), by Application 2024 & 2032
- Figure 50: Asia Pacific Botox Industry Volume Share (%), by Application 2024 & 2032
- Figure 51: Asia Pacific Botox Industry Revenue (Million), by End User 2024 & 2032
- Figure 52: Asia Pacific Botox Industry Volume (K Unit), by End User 2024 & 2032
- Figure 53: Asia Pacific Botox Industry Revenue Share (%), by End User 2024 & 2032
- Figure 54: Asia Pacific Botox Industry Volume Share (%), by End User 2024 & 2032
- Figure 55: Asia Pacific Botox Industry Revenue (Million), by Country 2024 & 2032
- Figure 56: Asia Pacific Botox Industry Volume (K Unit), by Country 2024 & 2032
- Figure 57: Asia Pacific Botox Industry Revenue Share (%), by Country 2024 & 2032
- Figure 58: Asia Pacific Botox Industry Volume Share (%), by Country 2024 & 2032
- Figure 59: Middle East and Africa Botox Industry Revenue (Million), by Application 2024 & 2032
- Figure 60: Middle East and Africa Botox Industry Volume (K Unit), by Application 2024 & 2032
- Figure 61: Middle East and Africa Botox Industry Revenue Share (%), by Application 2024 & 2032
- Figure 62: Middle East and Africa Botox Industry Volume Share (%), by Application 2024 & 2032
- Figure 63: Middle East and Africa Botox Industry Revenue (Million), by End User 2024 & 2032
- Figure 64: Middle East and Africa Botox Industry Volume (K Unit), by End User 2024 & 2032
- Figure 65: Middle East and Africa Botox Industry Revenue Share (%), by End User 2024 & 2032
- Figure 66: Middle East and Africa Botox Industry Volume Share (%), by End User 2024 & 2032
- Figure 67: Middle East and Africa Botox Industry Revenue (Million), by Country 2024 & 2032
- Figure 68: Middle East and Africa Botox Industry Volume (K Unit), by Country 2024 & 2032
- Figure 69: Middle East and Africa Botox Industry Revenue Share (%), by Country 2024 & 2032
- Figure 70: Middle East and Africa Botox Industry Volume Share (%), by Country 2024 & 2032
- Figure 71: South America Botox Industry Revenue (Million), by Application 2024 & 2032
- Figure 72: South America Botox Industry Volume (K Unit), by Application 2024 & 2032
- Figure 73: South America Botox Industry Revenue Share (%), by Application 2024 & 2032
- Figure 74: South America Botox Industry Volume Share (%), by Application 2024 & 2032
- Figure 75: South America Botox Industry Revenue (Million), by End User 2024 & 2032
- Figure 76: South America Botox Industry Volume (K Unit), by End User 2024 & 2032
- Figure 77: South America Botox Industry Revenue Share (%), by End User 2024 & 2032
- Figure 78: South America Botox Industry Volume Share (%), by End User 2024 & 2032
- Figure 79: South America Botox Industry Revenue (Million), by Country 2024 & 2032
- Figure 80: South America Botox Industry Volume (K Unit), by Country 2024 & 2032
- Figure 81: South America Botox Industry Revenue Share (%), by Country 2024 & 2032
- Figure 82: South America Botox Industry Volume Share (%), by Country 2024 & 2032
List of Tables
- Table 1: Global Botox Industry Revenue Million Forecast, by Region 2019 & 2032
- Table 2: Global Botox Industry Volume K Unit Forecast, by Region 2019 & 2032
- Table 3: Global Botox Industry Revenue Million Forecast, by Application 2019 & 2032
- Table 4: Global Botox Industry Volume K Unit Forecast, by Application 2019 & 2032
- Table 5: Global Botox Industry Revenue Million Forecast, by End User 2019 & 2032
- Table 6: Global Botox Industry Volume K Unit Forecast, by End User 2019 & 2032
- Table 7: Global Botox Industry Revenue Million Forecast, by Region 2019 & 2032
- Table 8: Global Botox Industry Volume K Unit Forecast, by Region 2019 & 2032
- Table 9: Global Botox Industry Revenue Million Forecast, by Country 2019 & 2032
- Table 10: Global Botox Industry Volume K Unit Forecast, by Country 2019 & 2032
- Table 11: United States Botox Industry Revenue (Million) Forecast, by Application 2019 & 2032
- Table 12: United States Botox Industry Volume (K Unit) Forecast, by Application 2019 & 2032
- Table 13: Canada Botox Industry Revenue (Million) Forecast, by Application 2019 & 2032
- Table 14: Canada Botox Industry Volume (K Unit) Forecast, by Application 2019 & 2032
- Table 15: Mexico Botox Industry Revenue (Million) Forecast, by Application 2019 & 2032
- Table 16: Mexico Botox Industry Volume (K Unit) Forecast, by Application 2019 & 2032
- Table 17: Global Botox Industry Revenue Million Forecast, by Country 2019 & 2032
- Table 18: Global Botox Industry Volume K Unit Forecast, by Country 2019 & 2032
- Table 19: Germany Botox Industry Revenue (Million) Forecast, by Application 2019 & 2032
- Table 20: Germany Botox Industry Volume (K Unit) Forecast, by Application 2019 & 2032
- Table 21: United Kingdom Botox Industry Revenue (Million) Forecast, by Application 2019 & 2032
- Table 22: United Kingdom Botox Industry Volume (K Unit) Forecast, by Application 2019 & 2032
- Table 23: France Botox Industry Revenue (Million) Forecast, by Application 2019 & 2032
- Table 24: France Botox Industry Volume (K Unit) Forecast, by Application 2019 & 2032
- Table 25: Italy Botox Industry Revenue (Million) Forecast, by Application 2019 & 2032
- Table 26: Italy Botox Industry Volume (K Unit) Forecast, by Application 2019 & 2032
- Table 27: Spain Botox Industry Revenue (Million) Forecast, by Application 2019 & 2032
- Table 28: Spain Botox Industry Volume (K Unit) Forecast, by Application 2019 & 2032
- Table 29: Rest of Europe Botox Industry Revenue (Million) Forecast, by Application 2019 & 2032
- Table 30: Rest of Europe Botox Industry Volume (K Unit) Forecast, by Application 2019 & 2032
- Table 31: Global Botox Industry Revenue Million Forecast, by Country 2019 & 2032
- Table 32: Global Botox Industry Volume K Unit Forecast, by Country 2019 & 2032
- Table 33: China Botox Industry Revenue (Million) Forecast, by Application 2019 & 2032
- Table 34: China Botox Industry Volume (K Unit) Forecast, by Application 2019 & 2032
- Table 35: Japan Botox Industry Revenue (Million) Forecast, by Application 2019 & 2032
- Table 36: Japan Botox Industry Volume (K Unit) Forecast, by Application 2019 & 2032
- Table 37: India Botox Industry Revenue (Million) Forecast, by Application 2019 & 2032
- Table 38: India Botox Industry Volume (K Unit) Forecast, by Application 2019 & 2032
- Table 39: Australia Botox Industry Revenue (Million) Forecast, by Application 2019 & 2032
- Table 40: Australia Botox Industry Volume (K Unit) Forecast, by Application 2019 & 2032
- Table 41: South Korea Botox Industry Revenue (Million) Forecast, by Application 2019 & 2032
- Table 42: South Korea Botox Industry Volume (K Unit) Forecast, by Application 2019 & 2032
- Table 43: Rest of Asia Pacific Botox Industry Revenue (Million) Forecast, by Application 2019 & 2032
- Table 44: Rest of Asia Pacific Botox Industry Volume (K Unit) Forecast, by Application 2019 & 2032
- Table 45: Global Botox Industry Revenue Million Forecast, by Country 2019 & 2032
- Table 46: Global Botox Industry Volume K Unit Forecast, by Country 2019 & 2032
- Table 47: GCC Botox Industry Revenue (Million) Forecast, by Application 2019 & 2032
- Table 48: GCC Botox Industry Volume (K Unit) Forecast, by Application 2019 & 2032
- Table 49: South Africa Botox Industry Revenue (Million) Forecast, by Application 2019 & 2032
- Table 50: South Africa Botox Industry Volume (K Unit) Forecast, by Application 2019 & 2032
- Table 51: Rest of Middle East and Africa Botox Industry Revenue (Million) Forecast, by Application 2019 & 2032
- Table 52: Rest of Middle East and Africa Botox Industry Volume (K Unit) Forecast, by Application 2019 & 2032
- Table 53: Global Botox Industry Revenue Million Forecast, by Country 2019 & 2032
- Table 54: Global Botox Industry Volume K Unit Forecast, by Country 2019 & 2032
- Table 55: Brazil Botox Industry Revenue (Million) Forecast, by Application 2019 & 2032
- Table 56: Brazil Botox Industry Volume (K Unit) Forecast, by Application 2019 & 2032
- Table 57: Argentina Botox Industry Revenue (Million) Forecast, by Application 2019 & 2032
- Table 58: Argentina Botox Industry Volume (K Unit) Forecast, by Application 2019 & 2032
- Table 59: Rest of South America Botox Industry Revenue (Million) Forecast, by Application 2019 & 2032
- Table 60: Rest of South America Botox Industry Volume (K Unit) Forecast, by Application 2019 & 2032
- Table 61: Global Botox Industry Revenue Million Forecast, by Application 2019 & 2032
- Table 62: Global Botox Industry Volume K Unit Forecast, by Application 2019 & 2032
- Table 63: Global Botox Industry Revenue Million Forecast, by End User 2019 & 2032
- Table 64: Global Botox Industry Volume K Unit Forecast, by End User 2019 & 2032
- Table 65: Global Botox Industry Revenue Million Forecast, by Country 2019 & 2032
- Table 66: Global Botox Industry Volume K Unit Forecast, by Country 2019 & 2032
- Table 67: United States Botox Industry Revenue (Million) Forecast, by Application 2019 & 2032
- Table 68: United States Botox Industry Volume (K Unit) Forecast, by Application 2019 & 2032
- Table 69: Canada Botox Industry Revenue (Million) Forecast, by Application 2019 & 2032
- Table 70: Canada Botox Industry Volume (K Unit) Forecast, by Application 2019 & 2032
- Table 71: Mexico Botox Industry Revenue (Million) Forecast, by Application 2019 & 2032
- Table 72: Mexico Botox Industry Volume (K Unit) Forecast, by Application 2019 & 2032
- Table 73: Global Botox Industry Revenue Million Forecast, by Application 2019 & 2032
- Table 74: Global Botox Industry Volume K Unit Forecast, by Application 2019 & 2032
- Table 75: Global Botox Industry Revenue Million Forecast, by End User 2019 & 2032
- Table 76: Global Botox Industry Volume K Unit Forecast, by End User 2019 & 2032
- Table 77: Global Botox Industry Revenue Million Forecast, by Country 2019 & 2032
- Table 78: Global Botox Industry Volume K Unit Forecast, by Country 2019 & 2032
- Table 79: Germany Botox Industry Revenue (Million) Forecast, by Application 2019 & 2032
- Table 80: Germany Botox Industry Volume (K Unit) Forecast, by Application 2019 & 2032
- Table 81: United Kingdom Botox Industry Revenue (Million) Forecast, by Application 2019 & 2032
- Table 82: United Kingdom Botox Industry Volume (K Unit) Forecast, by Application 2019 & 2032
- Table 83: France Botox Industry Revenue (Million) Forecast, by Application 2019 & 2032
- Table 84: France Botox Industry Volume (K Unit) Forecast, by Application 2019 & 2032
- Table 85: Italy Botox Industry Revenue (Million) Forecast, by Application 2019 & 2032
- Table 86: Italy Botox Industry Volume (K Unit) Forecast, by Application 2019 & 2032
- Table 87: Spain Botox Industry Revenue (Million) Forecast, by Application 2019 & 2032
- Table 88: Spain Botox Industry Volume (K Unit) Forecast, by Application 2019 & 2032
- Table 89: Rest of Europe Botox Industry Revenue (Million) Forecast, by Application 2019 & 2032
- Table 90: Rest of Europe Botox Industry Volume (K Unit) Forecast, by Application 2019 & 2032
- Table 91: Global Botox Industry Revenue Million Forecast, by Application 2019 & 2032
- Table 92: Global Botox Industry Volume K Unit Forecast, by Application 2019 & 2032
- Table 93: Global Botox Industry Revenue Million Forecast, by End User 2019 & 2032
- Table 94: Global Botox Industry Volume K Unit Forecast, by End User 2019 & 2032
- Table 95: Global Botox Industry Revenue Million Forecast, by Country 2019 & 2032
- Table 96: Global Botox Industry Volume K Unit Forecast, by Country 2019 & 2032
- Table 97: China Botox Industry Revenue (Million) Forecast, by Application 2019 & 2032
- Table 98: China Botox Industry Volume (K Unit) Forecast, by Application 2019 & 2032
- Table 99: Japan Botox Industry Revenue (Million) Forecast, by Application 2019 & 2032
- Table 100: Japan Botox Industry Volume (K Unit) Forecast, by Application 2019 & 2032
- Table 101: India Botox Industry Revenue (Million) Forecast, by Application 2019 & 2032
- Table 102: India Botox Industry Volume (K Unit) Forecast, by Application 2019 & 2032
- Table 103: Australia Botox Industry Revenue (Million) Forecast, by Application 2019 & 2032
- Table 104: Australia Botox Industry Volume (K Unit) Forecast, by Application 2019 & 2032
- Table 105: South Korea Botox Industry Revenue (Million) Forecast, by Application 2019 & 2032
- Table 106: South Korea Botox Industry Volume (K Unit) Forecast, by Application 2019 & 2032
- Table 107: Rest of Asia Pacific Botox Industry Revenue (Million) Forecast, by Application 2019 & 2032
- Table 108: Rest of Asia Pacific Botox Industry Volume (K Unit) Forecast, by Application 2019 & 2032
- Table 109: Global Botox Industry Revenue Million Forecast, by Application 2019 & 2032
- Table 110: Global Botox Industry Volume K Unit Forecast, by Application 2019 & 2032
- Table 111: Global Botox Industry Revenue Million Forecast, by End User 2019 & 2032
- Table 112: Global Botox Industry Volume K Unit Forecast, by End User 2019 & 2032
- Table 113: Global Botox Industry Revenue Million Forecast, by Country 2019 & 2032
- Table 114: Global Botox Industry Volume K Unit Forecast, by Country 2019 & 2032
- Table 115: GCC Botox Industry Revenue (Million) Forecast, by Application 2019 & 2032
- Table 116: GCC Botox Industry Volume (K Unit) Forecast, by Application 2019 & 2032
- Table 117: South Africa Botox Industry Revenue (Million) Forecast, by Application 2019 & 2032
- Table 118: South Africa Botox Industry Volume (K Unit) Forecast, by Application 2019 & 2032
- Table 119: Rest of Middle East and Africa Botox Industry Revenue (Million) Forecast, by Application 2019 & 2032
- Table 120: Rest of Middle East and Africa Botox Industry Volume (K Unit) Forecast, by Application 2019 & 2032
- Table 121: Global Botox Industry Revenue Million Forecast, by Application 2019 & 2032
- Table 122: Global Botox Industry Volume K Unit Forecast, by Application 2019 & 2032
- Table 123: Global Botox Industry Revenue Million Forecast, by End User 2019 & 2032
- Table 124: Global Botox Industry Volume K Unit Forecast, by End User 2019 & 2032
- Table 125: Global Botox Industry Revenue Million Forecast, by Country 2019 & 2032
- Table 126: Global Botox Industry Volume K Unit Forecast, by Country 2019 & 2032
- Table 127: Brazil Botox Industry Revenue (Million) Forecast, by Application 2019 & 2032
- Table 128: Brazil Botox Industry Volume (K Unit) Forecast, by Application 2019 & 2032
- Table 129: Argentina Botox Industry Revenue (Million) Forecast, by Application 2019 & 2032
- Table 130: Argentina Botox Industry Volume (K Unit) Forecast, by Application 2019 & 2032
- Table 131: Rest of South America Botox Industry Revenue (Million) Forecast, by Application 2019 & 2032
- Table 132: Rest of South America Botox Industry Volume (K Unit) Forecast, by Application 2019 & 2032
Frequently Asked Questions
1. What is the projected Compound Annual Growth Rate (CAGR) of the Botox Industry?
The projected CAGR is approximately 9.20%.
2. Which companies are prominent players in the Botox Industry?
Key companies in the market include AbbVie Inc (Allergan), Galderma, Medytox, Revance Therapeutics Inc (Revance Aesthetics), Evolus Inc, Hughs, Merz Pharma GmbH & Co KGaA, Daewoong Pharmaceuticals, Eisai, Ipsen Biopharmaceuticals Inc, HUGEL, USWM LLC.
3. What are the main segments of the Botox Industry?
The market segments include Application, End User.
4. Can you provide details about the market size?
The market size is estimated to be USD 6.49 Million as of 2022.
5. What are some drivers contributing to market growth?
Increasing Demand for Aesthetic Procedures; Growing Research and Development Initiatives to Expand the Therapeutic Applications of Botulinum Toxin.
6. What are the notable trends driving market growth?
Glabellar Lines Segment is Expected to Hold Significant Share in the Market Over the Forecast Period.
7. Are there any restraints impacting market growth?
Adverse Effects Associated with Botulinum Toxin; Lack of Reimbursement Policies Supporting Cosmetic Procedures.
8. Can you provide examples of recent developments in the market?
March 2024: Hugel America Inc. announced that the United States Food and Drugs Administration (US FDA) had approved Letybo (Neurotoxin) for the management of moderate-to-severe glabellar (frown) lines in adults.
9. What pricing options are available for accessing the report?
Pricing options include single-user, multi-user, and enterprise licenses priced at USD 4750, USD 5250, and USD 8750 respectively.
10. Is the market size provided in terms of value or volume?
The market size is provided in terms of value, measured in Million and volume, measured in K Unit.
11. Are there any specific market keywords associated with the report?
Yes, the market keyword associated with the report is "Botox Industry," which aids in identifying and referencing the specific market segment covered.
12. How do I determine which pricing option suits my needs best?
The pricing options vary based on user requirements and access needs. Individual users may opt for single-user licenses, while businesses requiring broader access may choose multi-user or enterprise licenses for cost-effective access to the report.
13. Are there any additional resources or data provided in the Botox Industry report?
While the report offers comprehensive insights, it's advisable to review the specific contents or supplementary materials provided to ascertain if additional resources or data are available.
14. How can I stay updated on further developments or reports in the Botox Industry?
To stay informed about further developments, trends, and reports in the Botox Industry, consider subscribing to industry newsletters, following relevant companies and organizations, or regularly checking reputable industry news sources and publications.
Methodology
Step 1 - Identification of Relevant Samples Size from Population Database


Step 2 - Approaches for Defining Global Market Size (Value, Volume* & Price*)

Note*: In applicable scenarios
Step 3 - Data Sources
Primary Research
- Web Analytics
- Survey Reports
- Research Institute
- Latest Research Reports
- Opinion Leaders
Secondary Research
- Annual Reports
- White Paper
- Latest Press Release
- Industry Association
- Paid Database
- Investor Presentations

Step 4 - Data Triangulation
Involves using different sources of information in order to increase the validity of a study
These sources are likely to be stakeholders in a program - participants, other researchers, program staff, other community members, and so on.
Then we put all data in single framework & apply various statistical tools to find out the dynamic on the market.
During the analysis stage, feedback from the stakeholder groups would be compared to determine areas of agreement as well as areas of divergence
