

Key Insights
The CAR T-cell therapy market is experiencing explosive growth, driven by a confluence of factors. The rising prevalence of blood cancers like leukemia, lymphoma, and multiple myeloma, coupled with the limitations of traditional treatments, is fueling significant demand. Technological advancements leading to improved efficacy and safety profiles of CAR T-cell therapies are further accelerating market expansion. The high cost of treatment remains a significant restraint, limiting accessibility, particularly in developing nations. However, ongoing research into more affordable manufacturing processes and the potential for broader reimbursement coverage are expected to mitigate this challenge over time. The market is segmented by therapy type (Abecma, Breyanzi, Kymriah, Tecartus, Yescarta, and others), application (leukemia, lymphoma, multiple myeloma, and autoimmune disorders), and end-user (hospitals and cancer treatment centers). North America currently dominates the market, owing to robust healthcare infrastructure, high adoption rates, and a strong presence of key players like Gilead Sciences (Kite Pharma), Novartis, and Bristol-Myers Squibb. However, Asia-Pacific is projected to witness significant growth in the coming years due to increasing healthcare expenditure and rising cancer incidence.
The competitive landscape is characterized by intense activity, with established pharmaceutical giants and emerging biotech companies vying for market share. Strategic partnerships, mergers, and acquisitions are commonplace, reflecting the high stakes involved. Companies are focusing on expanding their product pipelines, conducting clinical trials for new indications, and improving the accessibility and affordability of their therapies. Future growth will depend on successful clinical trials expanding the application of CAR T-cell therapy to a broader range of cancers and autoimmune diseases, regulatory approvals for new therapies, and continuous innovation aimed at enhancing safety and efficacy. Continued investment in research and development is crucial for overcoming current challenges and unlocking the full therapeutic potential of CAR T-cell therapy. The market is poised for considerable expansion, with a promising future fueled by ongoing innovation and the unmet needs in the oncology and autoimmune disease treatment landscape.

CAR T-Cell Therapy Market Report: 2019-2033
This comprehensive report provides a detailed analysis of the CAR T-cell therapy market, encompassing market dynamics, growth trends, regional analysis, product landscape, key players, and future outlook. The report covers the period from 2019 to 2033, with a focus on the forecast period of 2025-2033, using 2025 as the base year. This in-depth study is crucial for industry professionals, investors, and researchers seeking to understand and capitalize on the opportunities within this rapidly evolving sector. The total market value is projected to reach xx Million by 2033.
CAR T-Cell Therapy Industry Market Dynamics & Structure
The CAR T-cell therapy market is characterized by a dynamic interplay of technological advancements, regulatory landscapes, and intense competition among key players. Market concentration is currently moderate, with several large pharmaceutical companies dominating, but an increase in smaller biotech firms entering the market signifies potential shifts in market share. The market is significantly driven by technological innovation, focusing on improved efficacy, safety, and accessibility of CAR T-cell therapies. Stringent regulatory frameworks, particularly FDA approvals in the US and EMA approvals in Europe, significantly impact market entry and growth.
- Market Concentration: Moderate, with a trend towards increased competition.
- Technological Innovation Drivers: Improved CAR design, targeted delivery systems, and combination therapies.
- Regulatory Frameworks: FDA and EMA approvals are crucial for market entry.
- Competitive Product Substitutes: Other advanced cell therapies and immunotherapies pose competitive threats.
- End-User Demographics: Primarily focused on patients with hematological malignancies, expanding into solid tumors.
- M&A Trends: High level of mergers and acquisitions (xx deals in the last 5 years), driven by the desire to expand product portfolios and secure technological advantages.
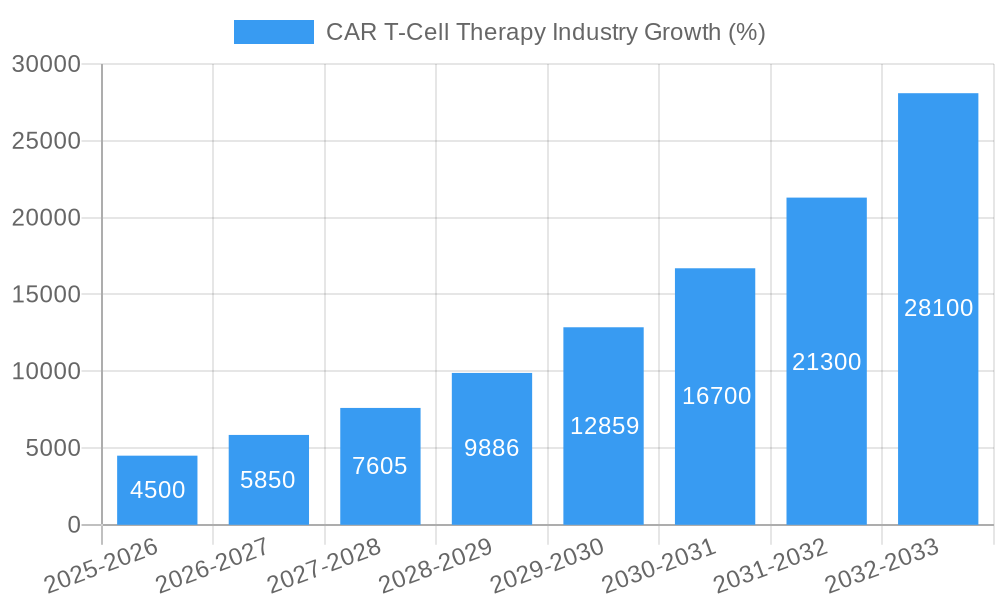
CAR T-Cell Therapy Industry Growth Trends & Insights
The CAR T-cell therapy market has witnessed exponential growth driven by increasing prevalence of hematological malignancies like leukemia, lymphoma, and multiple myeloma, along with advancements in manufacturing and delivery methods. The market is expected to exhibit a CAGR of xx% during the forecast period (2025-2033), expanding from an estimated market size of xx Million in 2025 to xx Million by 2033. Adoption rates are increasing steadily as clinical trials demonstrate improved outcomes compared to conventional treatments, especially for patients with relapsed/refractory diseases. Technological advancements, including next-generation CAR T-cell designs and improved manufacturing processes, will further propel market growth.
Dominant Regions, Countries, or Segments in CAR T-Cell Therapy Industry
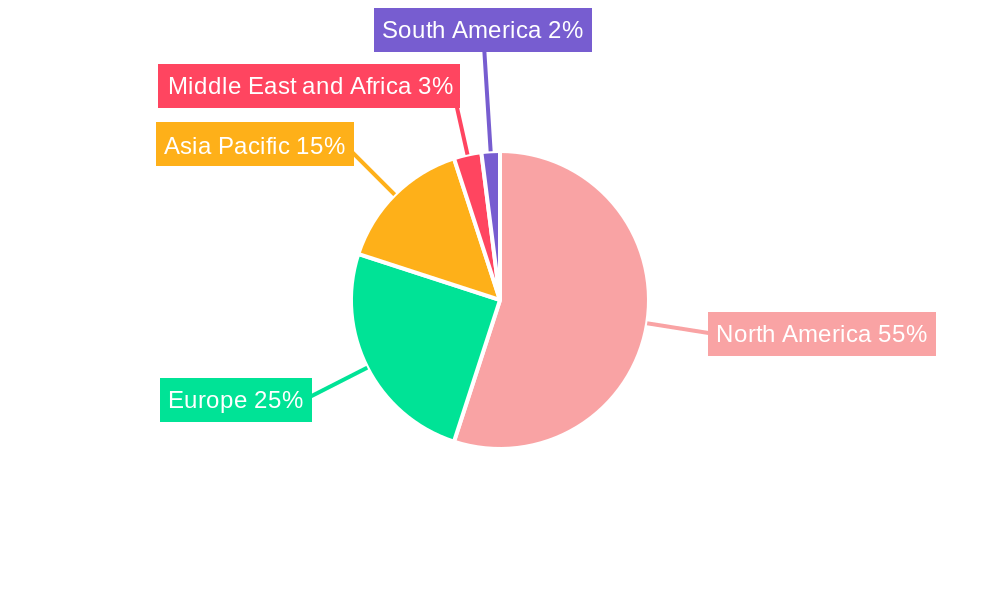
North America currently dominates the global CAR T-cell therapy market, driven by high healthcare expenditure, early adoption of innovative therapies, and a robust regulatory framework. Within North America, the US holds the largest market share. Europe is also a significant market, exhibiting steady growth driven by increasing investments in healthcare infrastructure and expanding reimbursement policies.
- By Type: Yescarta and Kymriah hold significant market share, followed by Breyanzi, Tecartus, and Abecma; "Others" segment represents emerging therapies.
- By Application: Lymphoma and Leukemia represent the largest application segments, due to higher prevalence and successful clinical outcomes. Multiple myeloma is also a rapidly growing segment.
- By End User: Hospitals and cancer care treatment centers represent the primary end-users; “Other End Users” represents research institutions, clinical trials, and other similar entities.
- Key Drivers: High prevalence of target cancers, increasing awareness among physicians and patients, favorable reimbursement policies in major markets.
CAR T-Cell Therapy Industry Product Landscape
The CAR T-cell therapy market comprises a range of approved and investigational products, each with unique characteristics and target indications. These therapies target specific cancer antigens, leading to improved efficacy and reduced side effects. Key innovations include autologous and allogeneic approaches, bispecific CAR T-cells, and engineered T-cells with enhanced persistence and safety profiles. These advancements aim to increase treatment success rates and reduce treatment-related toxicities.
Key Drivers, Barriers & Challenges in CAR T-Cell Therapy Industry
Key Drivers: Technological advancements in CAR design and manufacturing; increasing prevalence of hematological malignancies; favorable regulatory environment; and significant investments by pharmaceutical companies.
Challenges: High treatment cost; limited accessibility due to complex manufacturing process and specialized treatment infrastructure; potential for severe side effects; and competition from other novel cancer therapies. The cost of treatment significantly impacts accessibility, which is also constrained by the complex manufacturing process.
Emerging Opportunities in CAR T-Cell Therapy Industry
Emerging opportunities lie in expanding the application of CAR T-cell therapy to solid tumors and other cancer types. Developing allogeneic CAR T-cells to streamline the treatment process and reduce costs is another significant area of development. Moreover, combining CAR T-cell therapy with other treatments, such as immunotherapy and chemotherapy, offers a promising area for future advancement.
Growth Accelerators in the CAR T-Cell Therapy Industry Industry
Long-term growth will be driven by continuous technological advancements resulting in enhanced efficacy and safety profiles. Strategic partnerships between pharmaceutical companies and biotechnology firms will further facilitate innovation and market penetration. Expansion into emerging markets and increased reimbursement coverage will also significantly contribute to long-term market growth.
Key Players Shaping the CAR T-Cell Therapy Industry Market
- ACROBiosystems
- Sorrento Therapeutics Inc
- Gilead Sciences Inc (Kite Pharma)
- Novartis AG
- Servier Laboratories
- Eli Lilly and Company
- Noile-Immune Biotech Inc
- Celyad Oncology
- Johnson & Johnson
- Sangamo Therapeutics Inc
- Miltenyi Biotec
- Bristol-Myers Squibb Company
Notable Milestones in CAR T-Cell Therapy Industry Sector
- June 2022: Bristol Myers Squibb received FDA approval for Breyanzi (lisocabtagene maraleucel) for large B-cell lymphoma (LBCL).
- April 2022: Kite, a Gilead Company, received FDA approval for Yescarta (axicabtagene ciloleucel) for adult patients with large B-cell lymphoma refractory to or relapsing after first-line chemoimmunotherapy.
In-Depth CAR T-Cell Therapy Industry Market Outlook
The CAR T-cell therapy market exhibits substantial growth potential, driven by technological advancements, strategic partnerships, and expanding applications. Future market expansion will be propelled by increasing clinical evidence of efficacy across different cancer types and the development of safer and more accessible therapies. Strategic collaborations and targeted market expansion in emerging regions will play a crucial role in shaping the future of this innovative therapeutic field.
CAR T-Cell Therapy Industry Segmentation
-
1. Type
- 1.1. Abecma
- 1.2. Breyanzi
- 1.3. Kymriah
- 1.4. Tecartus
- 1.5. Yescarta
- 1.6. Others
-
2. Application
- 2.1. Leukemia
- 2.2. Lymphoma
- 2.3. Multiple Myeloma
- 2.4. Autoimmune Disorders
- 2.5. Other Application
-
3. End User
- 3.1. Hospitals
- 3.2. Cancer Care Treatment Centers
- 3.3. Other End Users
CAR T-Cell Therapy Industry Segmentation By Geography
-
1. North America
- 1.1. United States
- 1.2. Canada
- 1.3. Mexico
-
2. Europe
- 2.1. Germany
- 2.2. United Kingdom
- 2.3. France
- 2.4. Italy
- 2.5. Spain
- 2.6. Rest of Europe
-
3. Asia Pacific
- 3.1. China
- 3.2. Japan
- 3.3. India
- 3.4. Australia
- 3.5. South Korea
- 3.6. Rest of Asia Pacific
-
4. Middle East and Africa
- 4.1. GCC
- 4.2. South Africa
- 4.3. Rest of Middle East and Africa
-
5. South America
- 5.1. Brazil
- 5.2. Argentina
- 5.3. Rest of South America
CAR T-Cell Therapy Industry REPORT HIGHLIGHTS
| Aspects | Details |
|---|---|
| Study Period | 2019-2033 |
| Base Year | 2024 |
| Estimated Year | 2025 |
| Forecast Period | 2025-2033 |
| Historical Period | 2019-2024 |
| Growth Rate | CAGR of 30.00% from 2019-2033 |
| Segmentation |
|
Table of Contents
- 1. Introduction
- 1.1. Research Scope
- 1.2. Market Segmentation
- 1.3. Research Methodology
- 1.4. Definitions and Assumptions
- 2. Executive Summary
- 2.1. Introduction
- 3. Market Dynamics
- 3.1. Introduction
- 3.2. Market Drivers
- 3.2.1. Growing Burden of Cancer Worldwide; Increasing Invesment and Research and Development to Develop CAR T-Cell Therapy
- 3.3. Market Restrains
- 3.3.1. High Cost of Developing CAR T-Cell Therapy
- 3.4. Market Trends
- 3.4.1. Multiple Myeloma is Expected to Observe a Significant Growth Over the Forecast Period
- 4. Market Factor Analysis
- 4.1. Porters Five Forces
- 4.2. Supply/Value Chain
- 4.3. PESTEL analysis
- 4.4. Market Entropy
- 4.5. Patent/Trademark Analysis
- 5. Global CAR T-Cell Therapy Industry Analysis, Insights and Forecast, 2019-2031
- 5.1. Market Analysis, Insights and Forecast - by Type
- 5.1.1. Abecma
- 5.1.2. Breyanzi
- 5.1.3. Kymriah
- 5.1.4. Tecartus
- 5.1.5. Yescarta
- 5.1.6. Others
- 5.2. Market Analysis, Insights and Forecast - by Application
- 5.2.1. Leukemia
- 5.2.2. Lymphoma
- 5.2.3. Multiple Myeloma
- 5.2.4. Autoimmune Disorders
- 5.2.5. Other Application
- 5.3. Market Analysis, Insights and Forecast - by End User
- 5.3.1. Hospitals
- 5.3.2. Cancer Care Treatment Centers
- 5.3.3. Other End Users
- 5.4. Market Analysis, Insights and Forecast - by Region
- 5.4.1. North America
- 5.4.2. Europe
- 5.4.3. Asia Pacific
- 5.4.4. Middle East and Africa
- 5.4.5. South America
- 5.1. Market Analysis, Insights and Forecast - by Type
- 6. North America CAR T-Cell Therapy Industry Analysis, Insights and Forecast, 2019-2031
- 6.1. Market Analysis, Insights and Forecast - by Type
- 6.1.1. Abecma
- 6.1.2. Breyanzi
- 6.1.3. Kymriah
- 6.1.4. Tecartus
- 6.1.5. Yescarta
- 6.1.6. Others
- 6.2. Market Analysis, Insights and Forecast - by Application
- 6.2.1. Leukemia
- 6.2.2. Lymphoma
- 6.2.3. Multiple Myeloma
- 6.2.4. Autoimmune Disorders
- 6.2.5. Other Application
- 6.3. Market Analysis, Insights and Forecast - by End User
- 6.3.1. Hospitals
- 6.3.2. Cancer Care Treatment Centers
- 6.3.3. Other End Users
- 6.1. Market Analysis, Insights and Forecast - by Type
- 7. Europe CAR T-Cell Therapy Industry Analysis, Insights and Forecast, 2019-2031
- 7.1. Market Analysis, Insights and Forecast - by Type
- 7.1.1. Abecma
- 7.1.2. Breyanzi
- 7.1.3. Kymriah
- 7.1.4. Tecartus
- 7.1.5. Yescarta
- 7.1.6. Others
- 7.2. Market Analysis, Insights and Forecast - by Application
- 7.2.1. Leukemia
- 7.2.2. Lymphoma
- 7.2.3. Multiple Myeloma
- 7.2.4. Autoimmune Disorders
- 7.2.5. Other Application
- 7.3. Market Analysis, Insights and Forecast - by End User
- 7.3.1. Hospitals
- 7.3.2. Cancer Care Treatment Centers
- 7.3.3. Other End Users
- 7.1. Market Analysis, Insights and Forecast - by Type
- 8. Asia Pacific CAR T-Cell Therapy Industry Analysis, Insights and Forecast, 2019-2031
- 8.1. Market Analysis, Insights and Forecast - by Type
- 8.1.1. Abecma
- 8.1.2. Breyanzi
- 8.1.3. Kymriah
- 8.1.4. Tecartus
- 8.1.5. Yescarta
- 8.1.6. Others
- 8.2. Market Analysis, Insights and Forecast - by Application
- 8.2.1. Leukemia
- 8.2.2. Lymphoma
- 8.2.3. Multiple Myeloma
- 8.2.4. Autoimmune Disorders
- 8.2.5. Other Application
- 8.3. Market Analysis, Insights and Forecast - by End User
- 8.3.1. Hospitals
- 8.3.2. Cancer Care Treatment Centers
- 8.3.3. Other End Users
- 8.1. Market Analysis, Insights and Forecast - by Type
- 9. Middle East and Africa CAR T-Cell Therapy Industry Analysis, Insights and Forecast, 2019-2031
- 9.1. Market Analysis, Insights and Forecast - by Type
- 9.1.1. Abecma
- 9.1.2. Breyanzi
- 9.1.3. Kymriah
- 9.1.4. Tecartus
- 9.1.5. Yescarta
- 9.1.6. Others
- 9.2. Market Analysis, Insights and Forecast - by Application
- 9.2.1. Leukemia
- 9.2.2. Lymphoma
- 9.2.3. Multiple Myeloma
- 9.2.4. Autoimmune Disorders
- 9.2.5. Other Application
- 9.3. Market Analysis, Insights and Forecast - by End User
- 9.3.1. Hospitals
- 9.3.2. Cancer Care Treatment Centers
- 9.3.3. Other End Users
- 9.1. Market Analysis, Insights and Forecast - by Type
- 10. South America CAR T-Cell Therapy Industry Analysis, Insights and Forecast, 2019-2031
- 10.1. Market Analysis, Insights and Forecast - by Type
- 10.1.1. Abecma
- 10.1.2. Breyanzi
- 10.1.3. Kymriah
- 10.1.4. Tecartus
- 10.1.5. Yescarta
- 10.1.6. Others
- 10.2. Market Analysis, Insights and Forecast - by Application
- 10.2.1. Leukemia
- 10.2.2. Lymphoma
- 10.2.3. Multiple Myeloma
- 10.2.4. Autoimmune Disorders
- 10.2.5. Other Application
- 10.3. Market Analysis, Insights and Forecast - by End User
- 10.3.1. Hospitals
- 10.3.2. Cancer Care Treatment Centers
- 10.3.3. Other End Users
- 10.1. Market Analysis, Insights and Forecast - by Type
- 11. North America CAR T-Cell Therapy Industry Analysis, Insights and Forecast, 2019-2031
- 11.1. Market Analysis, Insights and Forecast - By Country/Sub-region
- 11.1.1 United States
- 11.1.2 Canada
- 11.1.3 Mexico
- 12. Europe CAR T-Cell Therapy Industry Analysis, Insights and Forecast, 2019-2031
- 12.1. Market Analysis, Insights and Forecast - By Country/Sub-region
- 12.1.1 Germany
- 12.1.2 United Kingdom
- 12.1.3 France
- 12.1.4 Italy
- 12.1.5 Spain
- 12.1.6 Rest of Europe
- 13. Asia Pacific CAR T-Cell Therapy Industry Analysis, Insights and Forecast, 2019-2031
- 13.1. Market Analysis, Insights and Forecast - By Country/Sub-region
- 13.1.1 China
- 13.1.2 Japan
- 13.1.3 India
- 13.1.4 Australia
- 13.1.5 South Korea
- 13.1.6 Rest of Asia Pacific
- 14. Middle East and Africa CAR T-Cell Therapy Industry Analysis, Insights and Forecast, 2019-2031
- 14.1. Market Analysis, Insights and Forecast - By Country/Sub-region
- 14.1.1 GCC
- 14.1.2 South Africa
- 14.1.3 Rest of Middle East and Africa
- 15. South America CAR T-Cell Therapy Industry Analysis, Insights and Forecast, 2019-2031
- 15.1. Market Analysis, Insights and Forecast - By Country/Sub-region
- 15.1.1 Brazil
- 15.1.2 Argentina
- 15.1.3 Rest of South America
- 16. Competitive Analysis
- 16.1. Global Market Share Analysis 2024
- 16.2. Company Profiles
- 16.2.1 ACROBiosystems
- 16.2.1.1. Overview
- 16.2.1.2. Products
- 16.2.1.3. SWOT Analysis
- 16.2.1.4. Recent Developments
- 16.2.1.5. Financials (Based on Availability)
- 16.2.2 Sorrento Therapeutics Inc
- 16.2.2.1. Overview
- 16.2.2.2. Products
- 16.2.2.3. SWOT Analysis
- 16.2.2.4. Recent Developments
- 16.2.2.5. Financials (Based on Availability)
- 16.2.3 Gilead Sciences Inc (Kite Pharma)
- 16.2.3.1. Overview
- 16.2.3.2. Products
- 16.2.3.3. SWOT Analysis
- 16.2.3.4. Recent Developments
- 16.2.3.5. Financials (Based on Availability)
- 16.2.4 Novartis AG
- 16.2.4.1. Overview
- 16.2.4.2. Products
- 16.2.4.3. SWOT Analysis
- 16.2.4.4. Recent Developments
- 16.2.4.5. Financials (Based on Availability)
- 16.2.5 Servier Laboratories
- 16.2.5.1. Overview
- 16.2.5.2. Products
- 16.2.5.3. SWOT Analysis
- 16.2.5.4. Recent Developments
- 16.2.5.5. Financials (Based on Availability)
- 16.2.6 Eli Lilly and Company
- 16.2.6.1. Overview
- 16.2.6.2. Products
- 16.2.6.3. SWOT Analysis
- 16.2.6.4. Recent Developments
- 16.2.6.5. Financials (Based on Availability)
- 16.2.7 Noile-Immune Biotech Inc
- 16.2.7.1. Overview
- 16.2.7.2. Products
- 16.2.7.3. SWOT Analysis
- 16.2.7.4. Recent Developments
- 16.2.7.5. Financials (Based on Availability)
- 16.2.8 Celyad Oncology
- 16.2.8.1. Overview
- 16.2.8.2. Products
- 16.2.8.3. SWOT Analysis
- 16.2.8.4. Recent Developments
- 16.2.8.5. Financials (Based on Availability)
- 16.2.9 Johnson & Johnson
- 16.2.9.1. Overview
- 16.2.9.2. Products
- 16.2.9.3. SWOT Analysis
- 16.2.9.4. Recent Developments
- 16.2.9.5. Financials (Based on Availability)
- 16.2.10 Sangamo Therapeutics Inc
- 16.2.10.1. Overview
- 16.2.10.2. Products
- 16.2.10.3. SWOT Analysis
- 16.2.10.4. Recent Developments
- 16.2.10.5. Financials (Based on Availability)
- 16.2.11 Miltenyi Biotec
- 16.2.11.1. Overview
- 16.2.11.2. Products
- 16.2.11.3. SWOT Analysis
- 16.2.11.4. Recent Developments
- 16.2.11.5. Financials (Based on Availability)
- 16.2.12 Bristol-Myers Squibb Company
- 16.2.12.1. Overview
- 16.2.12.2. Products
- 16.2.12.3. SWOT Analysis
- 16.2.12.4. Recent Developments
- 16.2.12.5. Financials (Based on Availability)
- 16.2.1 ACROBiosystems
List of Figures
- Figure 1: Global CAR T-Cell Therapy Industry Revenue Breakdown (Million, %) by Region 2024 & 2032
- Figure 2: Global CAR T-Cell Therapy Industry Volume Breakdown (K Unit, %) by Region 2024 & 2032
- Figure 3: North America CAR T-Cell Therapy Industry Revenue (Million), by Country 2024 & 2032
- Figure 4: North America CAR T-Cell Therapy Industry Volume (K Unit), by Country 2024 & 2032
- Figure 5: North America CAR T-Cell Therapy Industry Revenue Share (%), by Country 2024 & 2032
- Figure 6: North America CAR T-Cell Therapy Industry Volume Share (%), by Country 2024 & 2032
- Figure 7: Europe CAR T-Cell Therapy Industry Revenue (Million), by Country 2024 & 2032
- Figure 8: Europe CAR T-Cell Therapy Industry Volume (K Unit), by Country 2024 & 2032
- Figure 9: Europe CAR T-Cell Therapy Industry Revenue Share (%), by Country 2024 & 2032
- Figure 10: Europe CAR T-Cell Therapy Industry Volume Share (%), by Country 2024 & 2032
- Figure 11: Asia Pacific CAR T-Cell Therapy Industry Revenue (Million), by Country 2024 & 2032
- Figure 12: Asia Pacific CAR T-Cell Therapy Industry Volume (K Unit), by Country 2024 & 2032
- Figure 13: Asia Pacific CAR T-Cell Therapy Industry Revenue Share (%), by Country 2024 & 2032
- Figure 14: Asia Pacific CAR T-Cell Therapy Industry Volume Share (%), by Country 2024 & 2032
- Figure 15: Middle East and Africa CAR T-Cell Therapy Industry Revenue (Million), by Country 2024 & 2032
- Figure 16: Middle East and Africa CAR T-Cell Therapy Industry Volume (K Unit), by Country 2024 & 2032
- Figure 17: Middle East and Africa CAR T-Cell Therapy Industry Revenue Share (%), by Country 2024 & 2032
- Figure 18: Middle East and Africa CAR T-Cell Therapy Industry Volume Share (%), by Country 2024 & 2032
- Figure 19: South America CAR T-Cell Therapy Industry Revenue (Million), by Country 2024 & 2032
- Figure 20: South America CAR T-Cell Therapy Industry Volume (K Unit), by Country 2024 & 2032
- Figure 21: South America CAR T-Cell Therapy Industry Revenue Share (%), by Country 2024 & 2032
- Figure 22: South America CAR T-Cell Therapy Industry Volume Share (%), by Country 2024 & 2032
- Figure 23: North America CAR T-Cell Therapy Industry Revenue (Million), by Type 2024 & 2032
- Figure 24: North America CAR T-Cell Therapy Industry Volume (K Unit), by Type 2024 & 2032
- Figure 25: North America CAR T-Cell Therapy Industry Revenue Share (%), by Type 2024 & 2032
- Figure 26: North America CAR T-Cell Therapy Industry Volume Share (%), by Type 2024 & 2032
- Figure 27: North America CAR T-Cell Therapy Industry Revenue (Million), by Application 2024 & 2032
- Figure 28: North America CAR T-Cell Therapy Industry Volume (K Unit), by Application 2024 & 2032
- Figure 29: North America CAR T-Cell Therapy Industry Revenue Share (%), by Application 2024 & 2032
- Figure 30: North America CAR T-Cell Therapy Industry Volume Share (%), by Application 2024 & 2032
- Figure 31: North America CAR T-Cell Therapy Industry Revenue (Million), by End User 2024 & 2032
- Figure 32: North America CAR T-Cell Therapy Industry Volume (K Unit), by End User 2024 & 2032
- Figure 33: North America CAR T-Cell Therapy Industry Revenue Share (%), by End User 2024 & 2032
- Figure 34: North America CAR T-Cell Therapy Industry Volume Share (%), by End User 2024 & 2032
- Figure 35: North America CAR T-Cell Therapy Industry Revenue (Million), by Country 2024 & 2032
- Figure 36: North America CAR T-Cell Therapy Industry Volume (K Unit), by Country 2024 & 2032
- Figure 37: North America CAR T-Cell Therapy Industry Revenue Share (%), by Country 2024 & 2032
- Figure 38: North America CAR T-Cell Therapy Industry Volume Share (%), by Country 2024 & 2032
- Figure 39: Europe CAR T-Cell Therapy Industry Revenue (Million), by Type 2024 & 2032
- Figure 40: Europe CAR T-Cell Therapy Industry Volume (K Unit), by Type 2024 & 2032
- Figure 41: Europe CAR T-Cell Therapy Industry Revenue Share (%), by Type 2024 & 2032
- Figure 42: Europe CAR T-Cell Therapy Industry Volume Share (%), by Type 2024 & 2032
- Figure 43: Europe CAR T-Cell Therapy Industry Revenue (Million), by Application 2024 & 2032
- Figure 44: Europe CAR T-Cell Therapy Industry Volume (K Unit), by Application 2024 & 2032
- Figure 45: Europe CAR T-Cell Therapy Industry Revenue Share (%), by Application 2024 & 2032
- Figure 46: Europe CAR T-Cell Therapy Industry Volume Share (%), by Application 2024 & 2032
- Figure 47: Europe CAR T-Cell Therapy Industry Revenue (Million), by End User 2024 & 2032
- Figure 48: Europe CAR T-Cell Therapy Industry Volume (K Unit), by End User 2024 & 2032
- Figure 49: Europe CAR T-Cell Therapy Industry Revenue Share (%), by End User 2024 & 2032
- Figure 50: Europe CAR T-Cell Therapy Industry Volume Share (%), by End User 2024 & 2032
- Figure 51: Europe CAR T-Cell Therapy Industry Revenue (Million), by Country 2024 & 2032
- Figure 52: Europe CAR T-Cell Therapy Industry Volume (K Unit), by Country 2024 & 2032
- Figure 53: Europe CAR T-Cell Therapy Industry Revenue Share (%), by Country 2024 & 2032
- Figure 54: Europe CAR T-Cell Therapy Industry Volume Share (%), by Country 2024 & 2032
- Figure 55: Asia Pacific CAR T-Cell Therapy Industry Revenue (Million), by Type 2024 & 2032
- Figure 56: Asia Pacific CAR T-Cell Therapy Industry Volume (K Unit), by Type 2024 & 2032
- Figure 57: Asia Pacific CAR T-Cell Therapy Industry Revenue Share (%), by Type 2024 & 2032
- Figure 58: Asia Pacific CAR T-Cell Therapy Industry Volume Share (%), by Type 2024 & 2032
- Figure 59: Asia Pacific CAR T-Cell Therapy Industry Revenue (Million), by Application 2024 & 2032
- Figure 60: Asia Pacific CAR T-Cell Therapy Industry Volume (K Unit), by Application 2024 & 2032
- Figure 61: Asia Pacific CAR T-Cell Therapy Industry Revenue Share (%), by Application 2024 & 2032
- Figure 62: Asia Pacific CAR T-Cell Therapy Industry Volume Share (%), by Application 2024 & 2032
- Figure 63: Asia Pacific CAR T-Cell Therapy Industry Revenue (Million), by End User 2024 & 2032
- Figure 64: Asia Pacific CAR T-Cell Therapy Industry Volume (K Unit), by End User 2024 & 2032
- Figure 65: Asia Pacific CAR T-Cell Therapy Industry Revenue Share (%), by End User 2024 & 2032
- Figure 66: Asia Pacific CAR T-Cell Therapy Industry Volume Share (%), by End User 2024 & 2032
- Figure 67: Asia Pacific CAR T-Cell Therapy Industry Revenue (Million), by Country 2024 & 2032
- Figure 68: Asia Pacific CAR T-Cell Therapy Industry Volume (K Unit), by Country 2024 & 2032
- Figure 69: Asia Pacific CAR T-Cell Therapy Industry Revenue Share (%), by Country 2024 & 2032
- Figure 70: Asia Pacific CAR T-Cell Therapy Industry Volume Share (%), by Country 2024 & 2032
- Figure 71: Middle East and Africa CAR T-Cell Therapy Industry Revenue (Million), by Type 2024 & 2032
- Figure 72: Middle East and Africa CAR T-Cell Therapy Industry Volume (K Unit), by Type 2024 & 2032
- Figure 73: Middle East and Africa CAR T-Cell Therapy Industry Revenue Share (%), by Type 2024 & 2032
- Figure 74: Middle East and Africa CAR T-Cell Therapy Industry Volume Share (%), by Type 2024 & 2032
- Figure 75: Middle East and Africa CAR T-Cell Therapy Industry Revenue (Million), by Application 2024 & 2032
- Figure 76: Middle East and Africa CAR T-Cell Therapy Industry Volume (K Unit), by Application 2024 & 2032
- Figure 77: Middle East and Africa CAR T-Cell Therapy Industry Revenue Share (%), by Application 2024 & 2032
- Figure 78: Middle East and Africa CAR T-Cell Therapy Industry Volume Share (%), by Application 2024 & 2032
- Figure 79: Middle East and Africa CAR T-Cell Therapy Industry Revenue (Million), by End User 2024 & 2032
- Figure 80: Middle East and Africa CAR T-Cell Therapy Industry Volume (K Unit), by End User 2024 & 2032
- Figure 81: Middle East and Africa CAR T-Cell Therapy Industry Revenue Share (%), by End User 2024 & 2032
- Figure 82: Middle East and Africa CAR T-Cell Therapy Industry Volume Share (%), by End User 2024 & 2032
- Figure 83: Middle East and Africa CAR T-Cell Therapy Industry Revenue (Million), by Country 2024 & 2032
- Figure 84: Middle East and Africa CAR T-Cell Therapy Industry Volume (K Unit), by Country 2024 & 2032
- Figure 85: Middle East and Africa CAR T-Cell Therapy Industry Revenue Share (%), by Country 2024 & 2032
- Figure 86: Middle East and Africa CAR T-Cell Therapy Industry Volume Share (%), by Country 2024 & 2032
- Figure 87: South America CAR T-Cell Therapy Industry Revenue (Million), by Type 2024 & 2032
- Figure 88: South America CAR T-Cell Therapy Industry Volume (K Unit), by Type 2024 & 2032
- Figure 89: South America CAR T-Cell Therapy Industry Revenue Share (%), by Type 2024 & 2032
- Figure 90: South America CAR T-Cell Therapy Industry Volume Share (%), by Type 2024 & 2032
- Figure 91: South America CAR T-Cell Therapy Industry Revenue (Million), by Application 2024 & 2032
- Figure 92: South America CAR T-Cell Therapy Industry Volume (K Unit), by Application 2024 & 2032
- Figure 93: South America CAR T-Cell Therapy Industry Revenue Share (%), by Application 2024 & 2032
- Figure 94: South America CAR T-Cell Therapy Industry Volume Share (%), by Application 2024 & 2032
- Figure 95: South America CAR T-Cell Therapy Industry Revenue (Million), by End User 2024 & 2032
- Figure 96: South America CAR T-Cell Therapy Industry Volume (K Unit), by End User 2024 & 2032
- Figure 97: South America CAR T-Cell Therapy Industry Revenue Share (%), by End User 2024 & 2032
- Figure 98: South America CAR T-Cell Therapy Industry Volume Share (%), by End User 2024 & 2032
- Figure 99: South America CAR T-Cell Therapy Industry Revenue (Million), by Country 2024 & 2032
- Figure 100: South America CAR T-Cell Therapy Industry Volume (K Unit), by Country 2024 & 2032
- Figure 101: South America CAR T-Cell Therapy Industry Revenue Share (%), by Country 2024 & 2032
- Figure 102: South America CAR T-Cell Therapy Industry Volume Share (%), by Country 2024 & 2032
List of Tables
- Table 1: Global CAR T-Cell Therapy Industry Revenue Million Forecast, by Region 2019 & 2032
- Table 2: Global CAR T-Cell Therapy Industry Volume K Unit Forecast, by Region 2019 & 2032
- Table 3: Global CAR T-Cell Therapy Industry Revenue Million Forecast, by Type 2019 & 2032
- Table 4: Global CAR T-Cell Therapy Industry Volume K Unit Forecast, by Type 2019 & 2032
- Table 5: Global CAR T-Cell Therapy Industry Revenue Million Forecast, by Application 2019 & 2032
- Table 6: Global CAR T-Cell Therapy Industry Volume K Unit Forecast, by Application 2019 & 2032
- Table 7: Global CAR T-Cell Therapy Industry Revenue Million Forecast, by End User 2019 & 2032
- Table 8: Global CAR T-Cell Therapy Industry Volume K Unit Forecast, by End User 2019 & 2032
- Table 9: Global CAR T-Cell Therapy Industry Revenue Million Forecast, by Region 2019 & 2032
- Table 10: Global CAR T-Cell Therapy Industry Volume K Unit Forecast, by Region 2019 & 2032
- Table 11: Global CAR T-Cell Therapy Industry Revenue Million Forecast, by Country 2019 & 2032
- Table 12: Global CAR T-Cell Therapy Industry Volume K Unit Forecast, by Country 2019 & 2032
- Table 13: United States CAR T-Cell Therapy Industry Revenue (Million) Forecast, by Application 2019 & 2032
- Table 14: United States CAR T-Cell Therapy Industry Volume (K Unit) Forecast, by Application 2019 & 2032
- Table 15: Canada CAR T-Cell Therapy Industry Revenue (Million) Forecast, by Application 2019 & 2032
- Table 16: Canada CAR T-Cell Therapy Industry Volume (K Unit) Forecast, by Application 2019 & 2032
- Table 17: Mexico CAR T-Cell Therapy Industry Revenue (Million) Forecast, by Application 2019 & 2032
- Table 18: Mexico CAR T-Cell Therapy Industry Volume (K Unit) Forecast, by Application 2019 & 2032
- Table 19: Global CAR T-Cell Therapy Industry Revenue Million Forecast, by Country 2019 & 2032
- Table 20: Global CAR T-Cell Therapy Industry Volume K Unit Forecast, by Country 2019 & 2032
- Table 21: Germany CAR T-Cell Therapy Industry Revenue (Million) Forecast, by Application 2019 & 2032
- Table 22: Germany CAR T-Cell Therapy Industry Volume (K Unit) Forecast, by Application 2019 & 2032
- Table 23: United Kingdom CAR T-Cell Therapy Industry Revenue (Million) Forecast, by Application 2019 & 2032
- Table 24: United Kingdom CAR T-Cell Therapy Industry Volume (K Unit) Forecast, by Application 2019 & 2032
- Table 25: France CAR T-Cell Therapy Industry Revenue (Million) Forecast, by Application 2019 & 2032
- Table 26: France CAR T-Cell Therapy Industry Volume (K Unit) Forecast, by Application 2019 & 2032
- Table 27: Italy CAR T-Cell Therapy Industry Revenue (Million) Forecast, by Application 2019 & 2032
- Table 28: Italy CAR T-Cell Therapy Industry Volume (K Unit) Forecast, by Application 2019 & 2032
- Table 29: Spain CAR T-Cell Therapy Industry Revenue (Million) Forecast, by Application 2019 & 2032
- Table 30: Spain CAR T-Cell Therapy Industry Volume (K Unit) Forecast, by Application 2019 & 2032
- Table 31: Rest of Europe CAR T-Cell Therapy Industry Revenue (Million) Forecast, by Application 2019 & 2032
- Table 32: Rest of Europe CAR T-Cell Therapy Industry Volume (K Unit) Forecast, by Application 2019 & 2032
- Table 33: Global CAR T-Cell Therapy Industry Revenue Million Forecast, by Country 2019 & 2032
- Table 34: Global CAR T-Cell Therapy Industry Volume K Unit Forecast, by Country 2019 & 2032
- Table 35: China CAR T-Cell Therapy Industry Revenue (Million) Forecast, by Application 2019 & 2032
- Table 36: China CAR T-Cell Therapy Industry Volume (K Unit) Forecast, by Application 2019 & 2032
- Table 37: Japan CAR T-Cell Therapy Industry Revenue (Million) Forecast, by Application 2019 & 2032
- Table 38: Japan CAR T-Cell Therapy Industry Volume (K Unit) Forecast, by Application 2019 & 2032
- Table 39: India CAR T-Cell Therapy Industry Revenue (Million) Forecast, by Application 2019 & 2032
- Table 40: India CAR T-Cell Therapy Industry Volume (K Unit) Forecast, by Application 2019 & 2032
- Table 41: Australia CAR T-Cell Therapy Industry Revenue (Million) Forecast, by Application 2019 & 2032
- Table 42: Australia CAR T-Cell Therapy Industry Volume (K Unit) Forecast, by Application 2019 & 2032
- Table 43: South Korea CAR T-Cell Therapy Industry Revenue (Million) Forecast, by Application 2019 & 2032
- Table 44: South Korea CAR T-Cell Therapy Industry Volume (K Unit) Forecast, by Application 2019 & 2032
- Table 45: Rest of Asia Pacific CAR T-Cell Therapy Industry Revenue (Million) Forecast, by Application 2019 & 2032
- Table 46: Rest of Asia Pacific CAR T-Cell Therapy Industry Volume (K Unit) Forecast, by Application 2019 & 2032
- Table 47: Global CAR T-Cell Therapy Industry Revenue Million Forecast, by Country 2019 & 2032
- Table 48: Global CAR T-Cell Therapy Industry Volume K Unit Forecast, by Country 2019 & 2032
- Table 49: GCC CAR T-Cell Therapy Industry Revenue (Million) Forecast, by Application 2019 & 2032
- Table 50: GCC CAR T-Cell Therapy Industry Volume (K Unit) Forecast, by Application 2019 & 2032
- Table 51: South Africa CAR T-Cell Therapy Industry Revenue (Million) Forecast, by Application 2019 & 2032
- Table 52: South Africa CAR T-Cell Therapy Industry Volume (K Unit) Forecast, by Application 2019 & 2032
- Table 53: Rest of Middle East and Africa CAR T-Cell Therapy Industry Revenue (Million) Forecast, by Application 2019 & 2032
- Table 54: Rest of Middle East and Africa CAR T-Cell Therapy Industry Volume (K Unit) Forecast, by Application 2019 & 2032
- Table 55: Global CAR T-Cell Therapy Industry Revenue Million Forecast, by Country 2019 & 2032
- Table 56: Global CAR T-Cell Therapy Industry Volume K Unit Forecast, by Country 2019 & 2032
- Table 57: Brazil CAR T-Cell Therapy Industry Revenue (Million) Forecast, by Application 2019 & 2032
- Table 58: Brazil CAR T-Cell Therapy Industry Volume (K Unit) Forecast, by Application 2019 & 2032
- Table 59: Argentina CAR T-Cell Therapy Industry Revenue (Million) Forecast, by Application 2019 & 2032
- Table 60: Argentina CAR T-Cell Therapy Industry Volume (K Unit) Forecast, by Application 2019 & 2032
- Table 61: Rest of South America CAR T-Cell Therapy Industry Revenue (Million) Forecast, by Application 2019 & 2032
- Table 62: Rest of South America CAR T-Cell Therapy Industry Volume (K Unit) Forecast, by Application 2019 & 2032
- Table 63: Global CAR T-Cell Therapy Industry Revenue Million Forecast, by Type 2019 & 2032
- Table 64: Global CAR T-Cell Therapy Industry Volume K Unit Forecast, by Type 2019 & 2032
- Table 65: Global CAR T-Cell Therapy Industry Revenue Million Forecast, by Application 2019 & 2032
- Table 66: Global CAR T-Cell Therapy Industry Volume K Unit Forecast, by Application 2019 & 2032
- Table 67: Global CAR T-Cell Therapy Industry Revenue Million Forecast, by End User 2019 & 2032
- Table 68: Global CAR T-Cell Therapy Industry Volume K Unit Forecast, by End User 2019 & 2032
- Table 69: Global CAR T-Cell Therapy Industry Revenue Million Forecast, by Country 2019 & 2032
- Table 70: Global CAR T-Cell Therapy Industry Volume K Unit Forecast, by Country 2019 & 2032
- Table 71: United States CAR T-Cell Therapy Industry Revenue (Million) Forecast, by Application 2019 & 2032
- Table 72: United States CAR T-Cell Therapy Industry Volume (K Unit) Forecast, by Application 2019 & 2032
- Table 73: Canada CAR T-Cell Therapy Industry Revenue (Million) Forecast, by Application 2019 & 2032
- Table 74: Canada CAR T-Cell Therapy Industry Volume (K Unit) Forecast, by Application 2019 & 2032
- Table 75: Mexico CAR T-Cell Therapy Industry Revenue (Million) Forecast, by Application 2019 & 2032
- Table 76: Mexico CAR T-Cell Therapy Industry Volume (K Unit) Forecast, by Application 2019 & 2032
- Table 77: Global CAR T-Cell Therapy Industry Revenue Million Forecast, by Type 2019 & 2032
- Table 78: Global CAR T-Cell Therapy Industry Volume K Unit Forecast, by Type 2019 & 2032
- Table 79: Global CAR T-Cell Therapy Industry Revenue Million Forecast, by Application 2019 & 2032
- Table 80: Global CAR T-Cell Therapy Industry Volume K Unit Forecast, by Application 2019 & 2032
- Table 81: Global CAR T-Cell Therapy Industry Revenue Million Forecast, by End User 2019 & 2032
- Table 82: Global CAR T-Cell Therapy Industry Volume K Unit Forecast, by End User 2019 & 2032
- Table 83: Global CAR T-Cell Therapy Industry Revenue Million Forecast, by Country 2019 & 2032
- Table 84: Global CAR T-Cell Therapy Industry Volume K Unit Forecast, by Country 2019 & 2032
- Table 85: Germany CAR T-Cell Therapy Industry Revenue (Million) Forecast, by Application 2019 & 2032
- Table 86: Germany CAR T-Cell Therapy Industry Volume (K Unit) Forecast, by Application 2019 & 2032
- Table 87: United Kingdom CAR T-Cell Therapy Industry Revenue (Million) Forecast, by Application 2019 & 2032
- Table 88: United Kingdom CAR T-Cell Therapy Industry Volume (K Unit) Forecast, by Application 2019 & 2032
- Table 89: France CAR T-Cell Therapy Industry Revenue (Million) Forecast, by Application 2019 & 2032
- Table 90: France CAR T-Cell Therapy Industry Volume (K Unit) Forecast, by Application 2019 & 2032
- Table 91: Italy CAR T-Cell Therapy Industry Revenue (Million) Forecast, by Application 2019 & 2032
- Table 92: Italy CAR T-Cell Therapy Industry Volume (K Unit) Forecast, by Application 2019 & 2032
- Table 93: Spain CAR T-Cell Therapy Industry Revenue (Million) Forecast, by Application 2019 & 2032
- Table 94: Spain CAR T-Cell Therapy Industry Volume (K Unit) Forecast, by Application 2019 & 2032
- Table 95: Rest of Europe CAR T-Cell Therapy Industry Revenue (Million) Forecast, by Application 2019 & 2032
- Table 96: Rest of Europe CAR T-Cell Therapy Industry Volume (K Unit) Forecast, by Application 2019 & 2032
- Table 97: Global CAR T-Cell Therapy Industry Revenue Million Forecast, by Type 2019 & 2032
- Table 98: Global CAR T-Cell Therapy Industry Volume K Unit Forecast, by Type 2019 & 2032
- Table 99: Global CAR T-Cell Therapy Industry Revenue Million Forecast, by Application 2019 & 2032
- Table 100: Global CAR T-Cell Therapy Industry Volume K Unit Forecast, by Application 2019 & 2032
- Table 101: Global CAR T-Cell Therapy Industry Revenue Million Forecast, by End User 2019 & 2032
- Table 102: Global CAR T-Cell Therapy Industry Volume K Unit Forecast, by End User 2019 & 2032
- Table 103: Global CAR T-Cell Therapy Industry Revenue Million Forecast, by Country 2019 & 2032
- Table 104: Global CAR T-Cell Therapy Industry Volume K Unit Forecast, by Country 2019 & 2032
- Table 105: China CAR T-Cell Therapy Industry Revenue (Million) Forecast, by Application 2019 & 2032
- Table 106: China CAR T-Cell Therapy Industry Volume (K Unit) Forecast, by Application 2019 & 2032
- Table 107: Japan CAR T-Cell Therapy Industry Revenue (Million) Forecast, by Application 2019 & 2032
- Table 108: Japan CAR T-Cell Therapy Industry Volume (K Unit) Forecast, by Application 2019 & 2032
- Table 109: India CAR T-Cell Therapy Industry Revenue (Million) Forecast, by Application 2019 & 2032
- Table 110: India CAR T-Cell Therapy Industry Volume (K Unit) Forecast, by Application 2019 & 2032
- Table 111: Australia CAR T-Cell Therapy Industry Revenue (Million) Forecast, by Application 2019 & 2032
- Table 112: Australia CAR T-Cell Therapy Industry Volume (K Unit) Forecast, by Application 2019 & 2032
- Table 113: South Korea CAR T-Cell Therapy Industry Revenue (Million) Forecast, by Application 2019 & 2032
- Table 114: South Korea CAR T-Cell Therapy Industry Volume (K Unit) Forecast, by Application 2019 & 2032
- Table 115: Rest of Asia Pacific CAR T-Cell Therapy Industry Revenue (Million) Forecast, by Application 2019 & 2032
- Table 116: Rest of Asia Pacific CAR T-Cell Therapy Industry Volume (K Unit) Forecast, by Application 2019 & 2032
- Table 117: Global CAR T-Cell Therapy Industry Revenue Million Forecast, by Type 2019 & 2032
- Table 118: Global CAR T-Cell Therapy Industry Volume K Unit Forecast, by Type 2019 & 2032
- Table 119: Global CAR T-Cell Therapy Industry Revenue Million Forecast, by Application 2019 & 2032
- Table 120: Global CAR T-Cell Therapy Industry Volume K Unit Forecast, by Application 2019 & 2032
- Table 121: Global CAR T-Cell Therapy Industry Revenue Million Forecast, by End User 2019 & 2032
- Table 122: Global CAR T-Cell Therapy Industry Volume K Unit Forecast, by End User 2019 & 2032
- Table 123: Global CAR T-Cell Therapy Industry Revenue Million Forecast, by Country 2019 & 2032
- Table 124: Global CAR T-Cell Therapy Industry Volume K Unit Forecast, by Country 2019 & 2032
- Table 125: GCC CAR T-Cell Therapy Industry Revenue (Million) Forecast, by Application 2019 & 2032
- Table 126: GCC CAR T-Cell Therapy Industry Volume (K Unit) Forecast, by Application 2019 & 2032
- Table 127: South Africa CAR T-Cell Therapy Industry Revenue (Million) Forecast, by Application 2019 & 2032
- Table 128: South Africa CAR T-Cell Therapy Industry Volume (K Unit) Forecast, by Application 2019 & 2032
- Table 129: Rest of Middle East and Africa CAR T-Cell Therapy Industry Revenue (Million) Forecast, by Application 2019 & 2032
- Table 130: Rest of Middle East and Africa CAR T-Cell Therapy Industry Volume (K Unit) Forecast, by Application 2019 & 2032
- Table 131: Global CAR T-Cell Therapy Industry Revenue Million Forecast, by Type 2019 & 2032
- Table 132: Global CAR T-Cell Therapy Industry Volume K Unit Forecast, by Type 2019 & 2032
- Table 133: Global CAR T-Cell Therapy Industry Revenue Million Forecast, by Application 2019 & 2032
- Table 134: Global CAR T-Cell Therapy Industry Volume K Unit Forecast, by Application 2019 & 2032
- Table 135: Global CAR T-Cell Therapy Industry Revenue Million Forecast, by End User 2019 & 2032
- Table 136: Global CAR T-Cell Therapy Industry Volume K Unit Forecast, by End User 2019 & 2032
- Table 137: Global CAR T-Cell Therapy Industry Revenue Million Forecast, by Country 2019 & 2032
- Table 138: Global CAR T-Cell Therapy Industry Volume K Unit Forecast, by Country 2019 & 2032
- Table 139: Brazil CAR T-Cell Therapy Industry Revenue (Million) Forecast, by Application 2019 & 2032
- Table 140: Brazil CAR T-Cell Therapy Industry Volume (K Unit) Forecast, by Application 2019 & 2032
- Table 141: Argentina CAR T-Cell Therapy Industry Revenue (Million) Forecast, by Application 2019 & 2032
- Table 142: Argentina CAR T-Cell Therapy Industry Volume (K Unit) Forecast, by Application 2019 & 2032
- Table 143: Rest of South America CAR T-Cell Therapy Industry Revenue (Million) Forecast, by Application 2019 & 2032
- Table 144: Rest of South America CAR T-Cell Therapy Industry Volume (K Unit) Forecast, by Application 2019 & 2032
Frequently Asked Questions
1. What is the projected Compound Annual Growth Rate (CAGR) of the CAR T-Cell Therapy Industry?
The projected CAGR is approximately 30.00%.
2. Which companies are prominent players in the CAR T-Cell Therapy Industry?
Key companies in the market include ACROBiosystems, Sorrento Therapeutics Inc, Gilead Sciences Inc (Kite Pharma), Novartis AG, Servier Laboratories, Eli Lilly and Company, Noile-Immune Biotech Inc, Celyad Oncology, Johnson & Johnson, Sangamo Therapeutics Inc, Miltenyi Biotec, Bristol-Myers Squibb Company.
3. What are the main segments of the CAR T-Cell Therapy Industry?
The market segments include Type, Application, End User.
4. Can you provide details about the market size?
The market size is estimated to be USD XX Million as of 2022.
5. What are some drivers contributing to market growth?
Growing Burden of Cancer Worldwide; Increasing Invesment and Research and Development to Develop CAR T-Cell Therapy.
6. What are the notable trends driving market growth?
Multiple Myeloma is Expected to Observe a Significant Growth Over the Forecast Period.
7. Are there any restraints impacting market growth?
High Cost of Developing CAR T-Cell Therapy.
8. Can you provide examples of recent developments in the market?
June 2022: Bristol Myers Squibb received FDA approval for Breyanzi (lisocabtagene maraleucel), a CD19-directed chimeric antigen receptor (CAR) T-cell therapy, for the treatment of adult patients with large B-cell lymphoma (LBCL).
9. What pricing options are available for accessing the report?
Pricing options include single-user, multi-user, and enterprise licenses priced at USD 4750, USD 5250, and USD 8750 respectively.
10. Is the market size provided in terms of value or volume?
The market size is provided in terms of value, measured in Million and volume, measured in K Unit.
11. Are there any specific market keywords associated with the report?
Yes, the market keyword associated with the report is "CAR T-Cell Therapy Industry," which aids in identifying and referencing the specific market segment covered.
12. How do I determine which pricing option suits my needs best?
The pricing options vary based on user requirements and access needs. Individual users may opt for single-user licenses, while businesses requiring broader access may choose multi-user or enterprise licenses for cost-effective access to the report.
13. Are there any additional resources or data provided in the CAR T-Cell Therapy Industry report?
While the report offers comprehensive insights, it's advisable to review the specific contents or supplementary materials provided to ascertain if additional resources or data are available.
14. How can I stay updated on further developments or reports in the CAR T-Cell Therapy Industry?
To stay informed about further developments, trends, and reports in the CAR T-Cell Therapy Industry, consider subscribing to industry newsletters, following relevant companies and organizations, or regularly checking reputable industry news sources and publications.
Methodology
Step 1 - Identification of Relevant Samples Size from Population Database


Step 2 - Approaches for Defining Global Market Size (Value, Volume* & Price*)

Note*: In applicable scenarios
Step 3 - Data Sources
Primary Research
- Web Analytics
- Survey Reports
- Research Institute
- Latest Research Reports
- Opinion Leaders
Secondary Research
- Annual Reports
- White Paper
- Latest Press Release
- Industry Association
- Paid Database
- Investor Presentations

Step 4 - Data Triangulation
Involves using different sources of information in order to increase the validity of a study
These sources are likely to be stakeholders in a program - participants, other researchers, program staff, other community members, and so on.
Then we put all data in single framework & apply various statistical tools to find out the dynamic on the market.
During the analysis stage, feedback from the stakeholder groups would be compared to determine areas of agreement as well as areas of divergence
