

Key Insights
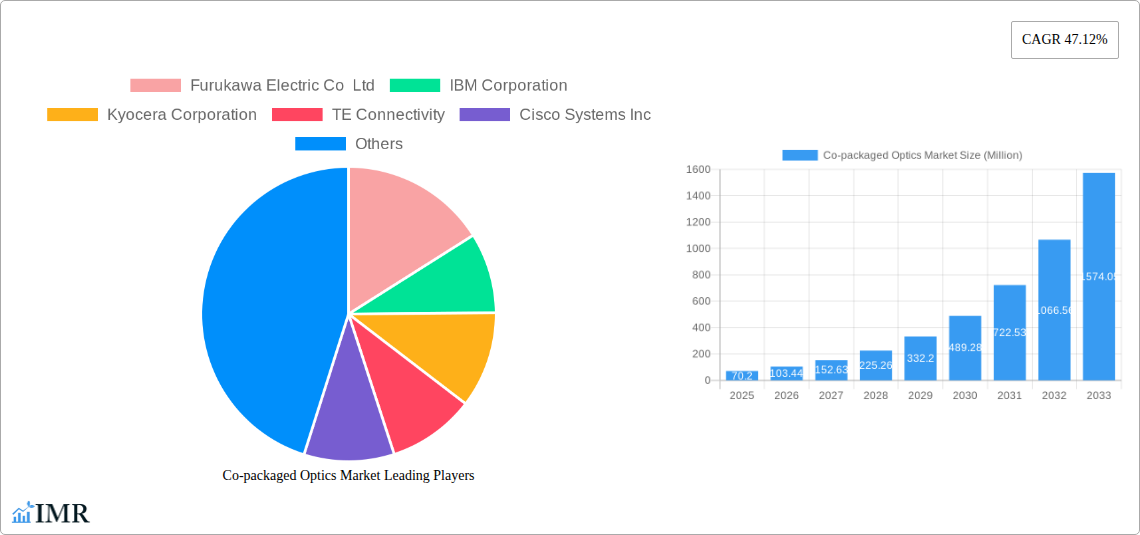
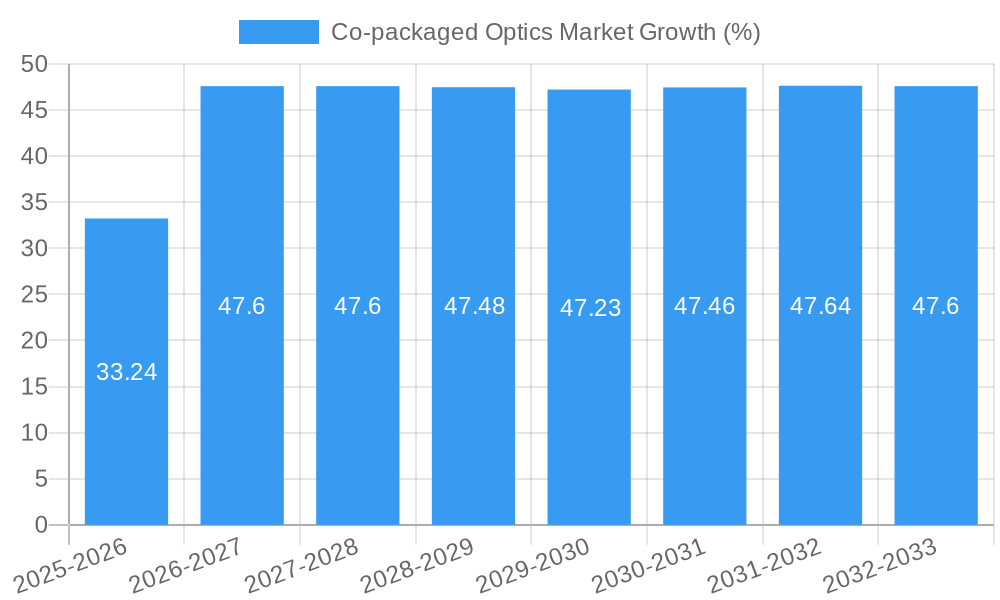
The co-packaged optics (CPO) market is experiencing explosive growth, projected to reach $70.20 million in 2025 and exhibiting a remarkable Compound Annual Growth Rate (CAGR) of 47.12%. This surge is driven by the increasing demand for higher bandwidth and lower latency in data centers, fueled by the proliferation of cloud computing, artificial intelligence, and high-performance computing applications. Key trends include the miniaturization of optical components, the integration of advanced packaging technologies, and the development of more energy-efficient solutions. The market is segmented by data rates (with a significant portion falling into the "less than" category, indicating a broad range of applications), and leading players include established technology giants like Cisco, IBM, and Intel, alongside emerging innovators like Ayar Labs. While the market faces restraints such as high initial investment costs and the complexity of integrating CPO technology into existing infrastructure, the long-term benefits in terms of cost reduction, power efficiency, and performance enhancement are expected to outweigh these challenges, leading to sustained growth. Geographic distribution shows significant market presence across North America, Europe, and Asia Pacific, with China, the US, and Japan expected to be key contributors to market expansion.
The forecast period (2025-2033) promises even more dramatic growth. Extrapolating from the provided CAGR and considering the ongoing technological advancements and increasing demand, the market is poised to witness substantial expansion in the coming years. The continuous miniaturization and integration of optical components will drive down costs while simultaneously increasing performance, making CPO technology increasingly attractive for a wider range of applications beyond high-end data centers. Further market segmentation, focusing on specific applications and data rate categories, will also emerge, allowing for more targeted product development and market penetration by vendors. Strategic partnerships and collaborations between technology companies are expected to play a critical role in accelerating the adoption of CPO technology and shaping the future of high-speed data transmission.
Co-packaged Optics Market Report: 2019-2033
This comprehensive report provides an in-depth analysis of the Co-packaged Optics (CPO) market, encompassing its parent market (Optical Communication) and child markets (Data Center Interconnects, High-Performance Computing). The study period spans 2019-2033, with 2025 as the base and estimated year. The report offers invaluable insights for industry professionals, investors, and stakeholders seeking to understand the dynamics and future potential of this rapidly evolving sector. The market is valued in Million units.
Co-packaged Optics Market Market Dynamics & Structure
The Co-packaged Optics market is characterized by a dynamic interplay of technological innovation, intense competition, and evolving regulatory landscapes. Market concentration is currently moderate, with key players such as Furukawa Electric Co Ltd, IBM Corporation, Kyocera Corporation, TE Connectivity, Cisco Systems Inc, Broadcom Inc, Microsoft Corporation, Ayar Labs Inc, Huawei Technologies Co Ltd, SENKO Advanced Components Inc, Hisense Broadband Multimedia Technology Co Ltd, Sumitomo Electric Industries Lt, Intel Corporation, and POET Technologies vying for market share. The market is driven by the increasing demand for higher bandwidth and lower latency in data centers and high-performance computing applications.
- Technological Innovation: Silicon photonics advancements are key drivers, enabling higher integration and improved performance.
- Regulatory Frameworks: Government initiatives promoting digital infrastructure development influence market growth.
- Competitive Landscape: Intense competition drives innovation and price pressures. M&A activity is expected to remain moderate (xx deals in 2024, xx% increase from 2023).
- Market Share: Top 5 players hold approximately xx% of the market share in 2025.
- Innovation Barriers: High R&D costs and complex manufacturing processes pose challenges for new entrants. Market concentration is expected to remain xx% by 2033.
Co-packaged Optics Market Growth Trends & Insights
The CPO market is experiencing robust growth, driven by the exponential increase in data traffic and the proliferation of AI and high-performance computing applications. The market size is projected to reach xx million units by 2025, exhibiting a CAGR of xx% during the forecast period (2025-2033). Adoption rates are accelerating, particularly in cloud data centers and hyperscale environments. Technological disruptions, such as the emergence of advanced silicon photonics and co-packaging techniques, are further fueling market expansion. Consumer behavior shifts towards cloud-based services and increased reliance on high-bandwidth applications are contributing to the market’s upward trajectory.
Dominant Regions, Countries, or Segments in Co-packaged Optics Market
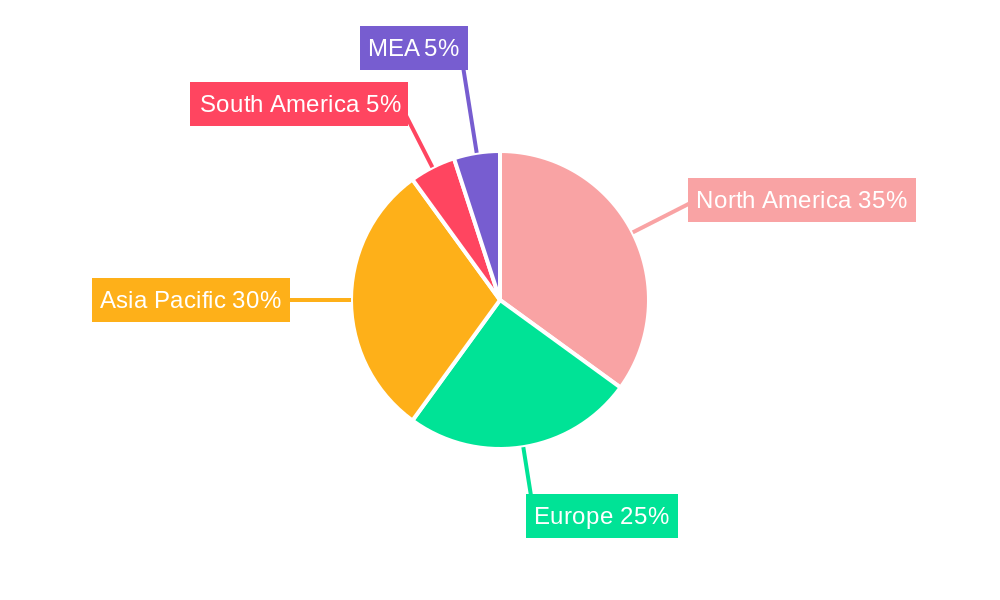
North America currently holds the largest market share in the CPO market, driven by strong demand from the data center and high-performance computing sectors. Within this region, the United States dominates, benefiting from a robust technological ecosystem, significant investments in infrastructure, and the presence of major hyperscale data centers.
- Key Drivers in North America: High adoption of cloud computing, substantial investments in 5G infrastructure, and favorable government policies.
- Market Share: North America accounts for approximately xx% of the global CPO market in 2025.
- Growth Potential: Asia-Pacific is expected to witness significant growth over the forecast period driven by expanding data center infrastructure.
By Data Rates: Less than 400G: This segment currently dominates the market due to its widespread adoption in existing infrastructure. However, growth is expected to slow as higher data rate solutions (e.g. 800G and beyond) gain traction.
Co-packaged Optics Market Product Landscape
The CPO market offers a diverse range of products, including various data rate solutions (e.g., 100G, 200G, 400G, 800G, and beyond). Product innovation focuses on improving bandwidth, reducing power consumption, and enhancing integration density. Key features include increased data rates, improved power efficiency, smaller form factors, and improved reliability. Unique selling propositions often center on integration level, scalability, and cost-effectiveness. Recent advancements in silicon photonics are enabling the development of more compact and energy-efficient CPO modules.
Key Drivers, Barriers & Challenges in Co-packaged Optics Market
Key Drivers:
- Increasing demand for higher bandwidth in data centers.
- Growing adoption of AI and high-performance computing.
- Advancements in silicon photonics technology.
- Government initiatives promoting digital infrastructure development.
Key Challenges:
- High initial investment costs for adoption.
- Complex manufacturing processes.
- Interoperability issues between different vendor solutions.
- Supply chain constraints impacting production and delivery timelines. (Estimated impact on market growth: xx% in 2025)
Emerging Opportunities in Co-packaged Optics Market
Emerging opportunities lie in the development of higher data rate CPO solutions (e.g., 1.6Tbps and beyond), expanded applications in edge computing and 5G networks, and the integration of advanced functionalities such as optical signal processing. Untapped markets in emerging economies also present significant growth potential.
Growth Accelerators in the Co-packaged Optics Market Industry
Technological breakthroughs in silicon photonics, coupled with strategic partnerships between semiconductor manufacturers and optical component suppliers, are key growth accelerators. Furthermore, market expansion strategies targeting high-growth regions and emerging applications are contributing to long-term growth prospects.
Key Players Shaping the Co-packaged Optics Market Market
- Furukawa Electric Co Ltd
- IBM Corporation
- Kyocera Corporation
- TE Connectivity
- Cisco Systems Inc
- Broadcom Inc
- Microsoft Corporation
- Ayar Labs Inc
- Huawei Technologies Co Ltd
- SENKO Advanced Components Inc
- Hisense Broadband Multimedia Technology Co Ltd
- Sumitomo Electric Industries Lt
- Intel Corporation
- POET Technologies
Notable Milestones in Co-packaged Optics Market Sector
- March 2024: Intel developed a 4 Tbps bidirectional fully integrated OCI chiplet based on Intel’s in-house silicon photonics technology. This significantly advances bandwidth capabilities for AI infrastructure.
- September 2023: TSMC's collaboration with Broadcom and Nvidia to develop silicon photonics and CPO highlights the increasing industry focus on meeting the demands of AI-driven data transmission.
In-Depth Co-packaged Optics Market Market Outlook
The Co-packaged Optics market is poised for continued strong growth, driven by unrelenting demand for higher bandwidth and lower latency in data centers and high-performance computing. Strategic partnerships, technological advancements, and expanding applications in emerging markets offer significant opportunities for market players to capture value and drive long-term success. The market is expected to maintain a healthy CAGR throughout the forecast period, surpassing xx million units by 2033.
Co-packaged Optics Market Segmentation
-
1. Data Rates
- 1.1. Less than 1.6 T
- 1.2. 3.2 T
- 1.3. 6.4 T
Co-packaged Optics Market Segmentation By Geography
- 1. North America
- 2. Europe
- 3. Asia
- 4. Australia and New Zealand
- 5. Latin America
- 6. Middle East and Africa
Co-packaged Optics Market REPORT HIGHLIGHTS
| Aspects | Details |
|---|---|
| Study Period | 2019-2033 |
| Base Year | 2024 |
| Estimated Year | 2025 |
| Forecast Period | 2025-2033 |
| Historical Period | 2019-2024 |
| Growth Rate | CAGR of 47.12% from 2019-2033 |
| Segmentation |
|
Table of Contents
- 1. Introduction
- 1.1. Research Scope
- 1.2. Market Segmentation
- 1.3. Research Methodology
- 1.4. Definitions and Assumptions
- 2. Executive Summary
- 2.1. Introduction
- 3. Market Dynamics
- 3.1. Introduction
- 3.2. Market Drivers
- 3.2.1. Increase in Adoption of Smart Devices and Rise in Data Traffic; Growth in the Importance of Mega Data Centers; Growth in High-performance Computing
- 3.3. Market Restrains
- 3.3.1. Increase in Network Complexity; Device Compatibility and Sustainability Issues
- 3.4. Market Trends
- 3.4.1. Growth in High-performance Computing
- 4. Market Factor Analysis
- 4.1. Porters Five Forces
- 4.2. Supply/Value Chain
- 4.3. PESTEL analysis
- 4.4. Market Entropy
- 4.5. Patent/Trademark Analysis
- 5. Global Co-packaged Optics Market Analysis, Insights and Forecast, 2019-2031
- 5.1. Market Analysis, Insights and Forecast - by Data Rates
- 5.1.1. Less than 1.6 T
- 5.1.2. 3.2 T
- 5.1.3. 6.4 T
- 5.2. Market Analysis, Insights and Forecast - by Region
- 5.2.1. North America
- 5.2.2. Europe
- 5.2.3. Asia
- 5.2.4. Australia and New Zealand
- 5.2.5. Latin America
- 5.2.6. Middle East and Africa
- 5.1. Market Analysis, Insights and Forecast - by Data Rates
- 6. North America Co-packaged Optics Market Analysis, Insights and Forecast, 2019-2031
- 6.1. Market Analysis, Insights and Forecast - by Data Rates
- 6.1.1. Less than 1.6 T
- 6.1.2. 3.2 T
- 6.1.3. 6.4 T
- 6.1. Market Analysis, Insights and Forecast - by Data Rates
- 7. Europe Co-packaged Optics Market Analysis, Insights and Forecast, 2019-2031
- 7.1. Market Analysis, Insights and Forecast - by Data Rates
- 7.1.1. Less than 1.6 T
- 7.1.2. 3.2 T
- 7.1.3. 6.4 T
- 7.1. Market Analysis, Insights and Forecast - by Data Rates
- 8. Asia Co-packaged Optics Market Analysis, Insights and Forecast, 2019-2031
- 8.1. Market Analysis, Insights and Forecast - by Data Rates
- 8.1.1. Less than 1.6 T
- 8.1.2. 3.2 T
- 8.1.3. 6.4 T
- 8.1. Market Analysis, Insights and Forecast - by Data Rates
- 9. Australia and New Zealand Co-packaged Optics Market Analysis, Insights and Forecast, 2019-2031
- 9.1. Market Analysis, Insights and Forecast - by Data Rates
- 9.1.1. Less than 1.6 T
- 9.1.2. 3.2 T
- 9.1.3. 6.4 T
- 9.1. Market Analysis, Insights and Forecast - by Data Rates
- 10. Latin America Co-packaged Optics Market Analysis, Insights and Forecast, 2019-2031
- 10.1. Market Analysis, Insights and Forecast - by Data Rates
- 10.1.1. Less than 1.6 T
- 10.1.2. 3.2 T
- 10.1.3. 6.4 T
- 10.1. Market Analysis, Insights and Forecast - by Data Rates
- 11. Middle East and Africa Co-packaged Optics Market Analysis, Insights and Forecast, 2019-2031
- 11.1. Market Analysis, Insights and Forecast - by Data Rates
- 11.1.1. Less than 1.6 T
- 11.1.2. 3.2 T
- 11.1.3. 6.4 T
- 11.1. Market Analysis, Insights and Forecast - by Data Rates
- 12. North America Co-packaged Optics Market Analysis, Insights and Forecast, 2019-2031
- 12.1. Market Analysis, Insights and Forecast - By Country/Sub-region
- 12.1.1 United States
- 12.1.2 Canada
- 12.1.3 Mexico
- 13. Europe Co-packaged Optics Market Analysis, Insights and Forecast, 2019-2031
- 13.1. Market Analysis, Insights and Forecast - By Country/Sub-region
- 13.1.1 Germany
- 13.1.2 United Kingdom
- 13.1.3 France
- 13.1.4 Spain
- 13.1.5 Italy
- 13.1.6 Spain
- 13.1.7 Belgium
- 13.1.8 Netherland
- 13.1.9 Nordics
- 13.1.10 Rest of Europe
- 14. Asia Pacific Co-packaged Optics Market Analysis, Insights and Forecast, 2019-2031
- 14.1. Market Analysis, Insights and Forecast - By Country/Sub-region
- 14.1.1 China
- 14.1.2 Japan
- 14.1.3 India
- 14.1.4 South Korea
- 14.1.5 Southeast Asia
- 14.1.6 Australia
- 14.1.7 Indonesia
- 14.1.8 Phillipes
- 14.1.9 Singapore
- 14.1.10 Thailandc
- 14.1.11 Rest of Asia Pacific
- 15. South America Co-packaged Optics Market Analysis, Insights and Forecast, 2019-2031
- 15.1. Market Analysis, Insights and Forecast - By Country/Sub-region
- 15.1.1 Brazil
- 15.1.2 Argentina
- 15.1.3 Peru
- 15.1.4 Chile
- 15.1.5 Colombia
- 15.1.6 Ecuador
- 15.1.7 Venezuela
- 15.1.8 Rest of South America
- 16. North America Co-packaged Optics Market Analysis, Insights and Forecast, 2019-2031
- 16.1. Market Analysis, Insights and Forecast - By Country/Sub-region
- 16.1.1 United States
- 16.1.2 Canada
- 16.1.3 Mexico
- 17. MEA Co-packaged Optics Market Analysis, Insights and Forecast, 2019-2031
- 17.1. Market Analysis, Insights and Forecast - By Country/Sub-region
- 17.1.1 United Arab Emirates
- 17.1.2 Saudi Arabia
- 17.1.3 South Africa
- 17.1.4 Rest of Middle East and Africa
- 18. Competitive Analysis
- 18.1. Global Market Share Analysis 2024
- 18.2. Company Profiles
- 18.2.1 Furukawa Electric Co Ltd
- 18.2.1.1. Overview
- 18.2.1.2. Products
- 18.2.1.3. SWOT Analysis
- 18.2.1.4. Recent Developments
- 18.2.1.5. Financials (Based on Availability)
- 18.2.2 IBM Corporation
- 18.2.2.1. Overview
- 18.2.2.2. Products
- 18.2.2.3. SWOT Analysis
- 18.2.2.4. Recent Developments
- 18.2.2.5. Financials (Based on Availability)
- 18.2.3 Kyocera Corporation
- 18.2.3.1. Overview
- 18.2.3.2. Products
- 18.2.3.3. SWOT Analysis
- 18.2.3.4. Recent Developments
- 18.2.3.5. Financials (Based on Availability)
- 18.2.4 TE Connectivity
- 18.2.4.1. Overview
- 18.2.4.2. Products
- 18.2.4.3. SWOT Analysis
- 18.2.4.4. Recent Developments
- 18.2.4.5. Financials (Based on Availability)
- 18.2.5 Cisco Systems Inc
- 18.2.5.1. Overview
- 18.2.5.2. Products
- 18.2.5.3. SWOT Analysis
- 18.2.5.4. Recent Developments
- 18.2.5.5. Financials (Based on Availability)
- 18.2.6 Broadcom Inc
- 18.2.6.1. Overview
- 18.2.6.2. Products
- 18.2.6.3. SWOT Analysis
- 18.2.6.4. Recent Developments
- 18.2.6.5. Financials (Based on Availability)
- 18.2.7 Microsoft Corporation
- 18.2.7.1. Overview
- 18.2.7.2. Products
- 18.2.7.3. SWOT Analysis
- 18.2.7.4. Recent Developments
- 18.2.7.5. Financials (Based on Availability)
- 18.2.8 Ayar Labs Inc
- 18.2.8.1. Overview
- 18.2.8.2. Products
- 18.2.8.3. SWOT Analysis
- 18.2.8.4. Recent Developments
- 18.2.8.5. Financials (Based on Availability)
- 18.2.9 Huawei Technologies Co Ltd
- 18.2.9.1. Overview
- 18.2.9.2. Products
- 18.2.9.3. SWOT Analysis
- 18.2.9.4. Recent Developments
- 18.2.9.5. Financials (Based on Availability)
- 18.2.10 SENKO Advanced Components Inc
- 18.2.10.1. Overview
- 18.2.10.2. Products
- 18.2.10.3. SWOT Analysis
- 18.2.10.4. Recent Developments
- 18.2.10.5. Financials (Based on Availability)
- 18.2.11 Hisense Broadband Multimedia Technology Co Ltd
- 18.2.11.1. Overview
- 18.2.11.2. Products
- 18.2.11.3. SWOT Analysis
- 18.2.11.4. Recent Developments
- 18.2.11.5. Financials (Based on Availability)
- 18.2.12 Sumitomo Electric Industries Lt
- 18.2.12.1. Overview
- 18.2.12.2. Products
- 18.2.12.3. SWOT Analysis
- 18.2.12.4. Recent Developments
- 18.2.12.5. Financials (Based on Availability)
- 18.2.13 Intel Corporation
- 18.2.13.1. Overview
- 18.2.13.2. Products
- 18.2.13.3. SWOT Analysis
- 18.2.13.4. Recent Developments
- 18.2.13.5. Financials (Based on Availability)
- 18.2.14 POET Technologies
- 18.2.14.1. Overview
- 18.2.14.2. Products
- 18.2.14.3. SWOT Analysis
- 18.2.14.4. Recent Developments
- 18.2.14.5. Financials (Based on Availability)
- 18.2.1 Furukawa Electric Co Ltd
List of Figures
- Figure 1: Global Co-packaged Optics Market Revenue Breakdown (Million, %) by Region 2024 & 2032
- Figure 2: Global Co-packaged Optics Market Volume Breakdown (K Unit, %) by Region 2024 & 2032
- Figure 3: North America Co-packaged Optics Market Revenue (Million), by Country 2024 & 2032
- Figure 4: North America Co-packaged Optics Market Volume (K Unit), by Country 2024 & 2032
- Figure 5: North America Co-packaged Optics Market Revenue Share (%), by Country 2024 & 2032
- Figure 6: North America Co-packaged Optics Market Volume Share (%), by Country 2024 & 2032
- Figure 7: Europe Co-packaged Optics Market Revenue (Million), by Country 2024 & 2032
- Figure 8: Europe Co-packaged Optics Market Volume (K Unit), by Country 2024 & 2032
- Figure 9: Europe Co-packaged Optics Market Revenue Share (%), by Country 2024 & 2032
- Figure 10: Europe Co-packaged Optics Market Volume Share (%), by Country 2024 & 2032
- Figure 11: Asia Pacific Co-packaged Optics Market Revenue (Million), by Country 2024 & 2032
- Figure 12: Asia Pacific Co-packaged Optics Market Volume (K Unit), by Country 2024 & 2032
- Figure 13: Asia Pacific Co-packaged Optics Market Revenue Share (%), by Country 2024 & 2032
- Figure 14: Asia Pacific Co-packaged Optics Market Volume Share (%), by Country 2024 & 2032
- Figure 15: South America Co-packaged Optics Market Revenue (Million), by Country 2024 & 2032
- Figure 16: South America Co-packaged Optics Market Volume (K Unit), by Country 2024 & 2032
- Figure 17: South America Co-packaged Optics Market Revenue Share (%), by Country 2024 & 2032
- Figure 18: South America Co-packaged Optics Market Volume Share (%), by Country 2024 & 2032
- Figure 19: North America Co-packaged Optics Market Revenue (Million), by Country 2024 & 2032
- Figure 20: North America Co-packaged Optics Market Volume (K Unit), by Country 2024 & 2032
- Figure 21: North America Co-packaged Optics Market Revenue Share (%), by Country 2024 & 2032
- Figure 22: North America Co-packaged Optics Market Volume Share (%), by Country 2024 & 2032
- Figure 23: MEA Co-packaged Optics Market Revenue (Million), by Country 2024 & 2032
- Figure 24: MEA Co-packaged Optics Market Volume (K Unit), by Country 2024 & 2032
- Figure 25: MEA Co-packaged Optics Market Revenue Share (%), by Country 2024 & 2032
- Figure 26: MEA Co-packaged Optics Market Volume Share (%), by Country 2024 & 2032
- Figure 27: North America Co-packaged Optics Market Revenue (Million), by Data Rates 2024 & 2032
- Figure 28: North America Co-packaged Optics Market Volume (K Unit), by Data Rates 2024 & 2032
- Figure 29: North America Co-packaged Optics Market Revenue Share (%), by Data Rates 2024 & 2032
- Figure 30: North America Co-packaged Optics Market Volume Share (%), by Data Rates 2024 & 2032
- Figure 31: North America Co-packaged Optics Market Revenue (Million), by Country 2024 & 2032
- Figure 32: North America Co-packaged Optics Market Volume (K Unit), by Country 2024 & 2032
- Figure 33: North America Co-packaged Optics Market Revenue Share (%), by Country 2024 & 2032
- Figure 34: North America Co-packaged Optics Market Volume Share (%), by Country 2024 & 2032
- Figure 35: Europe Co-packaged Optics Market Revenue (Million), by Data Rates 2024 & 2032
- Figure 36: Europe Co-packaged Optics Market Volume (K Unit), by Data Rates 2024 & 2032
- Figure 37: Europe Co-packaged Optics Market Revenue Share (%), by Data Rates 2024 & 2032
- Figure 38: Europe Co-packaged Optics Market Volume Share (%), by Data Rates 2024 & 2032
- Figure 39: Europe Co-packaged Optics Market Revenue (Million), by Country 2024 & 2032
- Figure 40: Europe Co-packaged Optics Market Volume (K Unit), by Country 2024 & 2032
- Figure 41: Europe Co-packaged Optics Market Revenue Share (%), by Country 2024 & 2032
- Figure 42: Europe Co-packaged Optics Market Volume Share (%), by Country 2024 & 2032
- Figure 43: Asia Co-packaged Optics Market Revenue (Million), by Data Rates 2024 & 2032
- Figure 44: Asia Co-packaged Optics Market Volume (K Unit), by Data Rates 2024 & 2032
- Figure 45: Asia Co-packaged Optics Market Revenue Share (%), by Data Rates 2024 & 2032
- Figure 46: Asia Co-packaged Optics Market Volume Share (%), by Data Rates 2024 & 2032
- Figure 47: Asia Co-packaged Optics Market Revenue (Million), by Country 2024 & 2032
- Figure 48: Asia Co-packaged Optics Market Volume (K Unit), by Country 2024 & 2032
- Figure 49: Asia Co-packaged Optics Market Revenue Share (%), by Country 2024 & 2032
- Figure 50: Asia Co-packaged Optics Market Volume Share (%), by Country 2024 & 2032
- Figure 51: Australia and New Zealand Co-packaged Optics Market Revenue (Million), by Data Rates 2024 & 2032
- Figure 52: Australia and New Zealand Co-packaged Optics Market Volume (K Unit), by Data Rates 2024 & 2032
- Figure 53: Australia and New Zealand Co-packaged Optics Market Revenue Share (%), by Data Rates 2024 & 2032
- Figure 54: Australia and New Zealand Co-packaged Optics Market Volume Share (%), by Data Rates 2024 & 2032
- Figure 55: Australia and New Zealand Co-packaged Optics Market Revenue (Million), by Country 2024 & 2032
- Figure 56: Australia and New Zealand Co-packaged Optics Market Volume (K Unit), by Country 2024 & 2032
- Figure 57: Australia and New Zealand Co-packaged Optics Market Revenue Share (%), by Country 2024 & 2032
- Figure 58: Australia and New Zealand Co-packaged Optics Market Volume Share (%), by Country 2024 & 2032
- Figure 59: Latin America Co-packaged Optics Market Revenue (Million), by Data Rates 2024 & 2032
- Figure 60: Latin America Co-packaged Optics Market Volume (K Unit), by Data Rates 2024 & 2032
- Figure 61: Latin America Co-packaged Optics Market Revenue Share (%), by Data Rates 2024 & 2032
- Figure 62: Latin America Co-packaged Optics Market Volume Share (%), by Data Rates 2024 & 2032
- Figure 63: Latin America Co-packaged Optics Market Revenue (Million), by Country 2024 & 2032
- Figure 64: Latin America Co-packaged Optics Market Volume (K Unit), by Country 2024 & 2032
- Figure 65: Latin America Co-packaged Optics Market Revenue Share (%), by Country 2024 & 2032
- Figure 66: Latin America Co-packaged Optics Market Volume Share (%), by Country 2024 & 2032
- Figure 67: Middle East and Africa Co-packaged Optics Market Revenue (Million), by Data Rates 2024 & 2032
- Figure 68: Middle East and Africa Co-packaged Optics Market Volume (K Unit), by Data Rates 2024 & 2032
- Figure 69: Middle East and Africa Co-packaged Optics Market Revenue Share (%), by Data Rates 2024 & 2032
- Figure 70: Middle East and Africa Co-packaged Optics Market Volume Share (%), by Data Rates 2024 & 2032
- Figure 71: Middle East and Africa Co-packaged Optics Market Revenue (Million), by Country 2024 & 2032
- Figure 72: Middle East and Africa Co-packaged Optics Market Volume (K Unit), by Country 2024 & 2032
- Figure 73: Middle East and Africa Co-packaged Optics Market Revenue Share (%), by Country 2024 & 2032
- Figure 74: Middle East and Africa Co-packaged Optics Market Volume Share (%), by Country 2024 & 2032
List of Tables
- Table 1: Global Co-packaged Optics Market Revenue Million Forecast, by Region 2019 & 2032
- Table 2: Global Co-packaged Optics Market Volume K Unit Forecast, by Region 2019 & 2032
- Table 3: Global Co-packaged Optics Market Revenue Million Forecast, by Data Rates 2019 & 2032
- Table 4: Global Co-packaged Optics Market Volume K Unit Forecast, by Data Rates 2019 & 2032
- Table 5: Global Co-packaged Optics Market Revenue Million Forecast, by Region 2019 & 2032
- Table 6: Global Co-packaged Optics Market Volume K Unit Forecast, by Region 2019 & 2032
- Table 7: Global Co-packaged Optics Market Revenue Million Forecast, by Country 2019 & 2032
- Table 8: Global Co-packaged Optics Market Volume K Unit Forecast, by Country 2019 & 2032
- Table 9: United States Co-packaged Optics Market Revenue (Million) Forecast, by Application 2019 & 2032
- Table 10: United States Co-packaged Optics Market Volume (K Unit) Forecast, by Application 2019 & 2032
- Table 11: Canada Co-packaged Optics Market Revenue (Million) Forecast, by Application 2019 & 2032
- Table 12: Canada Co-packaged Optics Market Volume (K Unit) Forecast, by Application 2019 & 2032
- Table 13: Mexico Co-packaged Optics Market Revenue (Million) Forecast, by Application 2019 & 2032
- Table 14: Mexico Co-packaged Optics Market Volume (K Unit) Forecast, by Application 2019 & 2032
- Table 15: Global Co-packaged Optics Market Revenue Million Forecast, by Country 2019 & 2032
- Table 16: Global Co-packaged Optics Market Volume K Unit Forecast, by Country 2019 & 2032
- Table 17: Germany Co-packaged Optics Market Revenue (Million) Forecast, by Application 2019 & 2032
- Table 18: Germany Co-packaged Optics Market Volume (K Unit) Forecast, by Application 2019 & 2032
- Table 19: United Kingdom Co-packaged Optics Market Revenue (Million) Forecast, by Application 2019 & 2032
- Table 20: United Kingdom Co-packaged Optics Market Volume (K Unit) Forecast, by Application 2019 & 2032
- Table 21: France Co-packaged Optics Market Revenue (Million) Forecast, by Application 2019 & 2032
- Table 22: France Co-packaged Optics Market Volume (K Unit) Forecast, by Application 2019 & 2032
- Table 23: Spain Co-packaged Optics Market Revenue (Million) Forecast, by Application 2019 & 2032
- Table 24: Spain Co-packaged Optics Market Volume (K Unit) Forecast, by Application 2019 & 2032
- Table 25: Italy Co-packaged Optics Market Revenue (Million) Forecast, by Application 2019 & 2032
- Table 26: Italy Co-packaged Optics Market Volume (K Unit) Forecast, by Application 2019 & 2032
- Table 27: Spain Co-packaged Optics Market Revenue (Million) Forecast, by Application 2019 & 2032
- Table 28: Spain Co-packaged Optics Market Volume (K Unit) Forecast, by Application 2019 & 2032
- Table 29: Belgium Co-packaged Optics Market Revenue (Million) Forecast, by Application 2019 & 2032
- Table 30: Belgium Co-packaged Optics Market Volume (K Unit) Forecast, by Application 2019 & 2032
- Table 31: Netherland Co-packaged Optics Market Revenue (Million) Forecast, by Application 2019 & 2032
- Table 32: Netherland Co-packaged Optics Market Volume (K Unit) Forecast, by Application 2019 & 2032
- Table 33: Nordics Co-packaged Optics Market Revenue (Million) Forecast, by Application 2019 & 2032
- Table 34: Nordics Co-packaged Optics Market Volume (K Unit) Forecast, by Application 2019 & 2032
- Table 35: Rest of Europe Co-packaged Optics Market Revenue (Million) Forecast, by Application 2019 & 2032
- Table 36: Rest of Europe Co-packaged Optics Market Volume (K Unit) Forecast, by Application 2019 & 2032
- Table 37: Global Co-packaged Optics Market Revenue Million Forecast, by Country 2019 & 2032
- Table 38: Global Co-packaged Optics Market Volume K Unit Forecast, by Country 2019 & 2032
- Table 39: China Co-packaged Optics Market Revenue (Million) Forecast, by Application 2019 & 2032
- Table 40: China Co-packaged Optics Market Volume (K Unit) Forecast, by Application 2019 & 2032
- Table 41: Japan Co-packaged Optics Market Revenue (Million) Forecast, by Application 2019 & 2032
- Table 42: Japan Co-packaged Optics Market Volume (K Unit) Forecast, by Application 2019 & 2032
- Table 43: India Co-packaged Optics Market Revenue (Million) Forecast, by Application 2019 & 2032
- Table 44: India Co-packaged Optics Market Volume (K Unit) Forecast, by Application 2019 & 2032
- Table 45: South Korea Co-packaged Optics Market Revenue (Million) Forecast, by Application 2019 & 2032
- Table 46: South Korea Co-packaged Optics Market Volume (K Unit) Forecast, by Application 2019 & 2032
- Table 47: Southeast Asia Co-packaged Optics Market Revenue (Million) Forecast, by Application 2019 & 2032
- Table 48: Southeast Asia Co-packaged Optics Market Volume (K Unit) Forecast, by Application 2019 & 2032
- Table 49: Australia Co-packaged Optics Market Revenue (Million) Forecast, by Application 2019 & 2032
- Table 50: Australia Co-packaged Optics Market Volume (K Unit) Forecast, by Application 2019 & 2032
- Table 51: Indonesia Co-packaged Optics Market Revenue (Million) Forecast, by Application 2019 & 2032
- Table 52: Indonesia Co-packaged Optics Market Volume (K Unit) Forecast, by Application 2019 & 2032
- Table 53: Phillipes Co-packaged Optics Market Revenue (Million) Forecast, by Application 2019 & 2032
- Table 54: Phillipes Co-packaged Optics Market Volume (K Unit) Forecast, by Application 2019 & 2032
- Table 55: Singapore Co-packaged Optics Market Revenue (Million) Forecast, by Application 2019 & 2032
- Table 56: Singapore Co-packaged Optics Market Volume (K Unit) Forecast, by Application 2019 & 2032
- Table 57: Thailandc Co-packaged Optics Market Revenue (Million) Forecast, by Application 2019 & 2032
- Table 58: Thailandc Co-packaged Optics Market Volume (K Unit) Forecast, by Application 2019 & 2032
- Table 59: Rest of Asia Pacific Co-packaged Optics Market Revenue (Million) Forecast, by Application 2019 & 2032
- Table 60: Rest of Asia Pacific Co-packaged Optics Market Volume (K Unit) Forecast, by Application 2019 & 2032
- Table 61: Global Co-packaged Optics Market Revenue Million Forecast, by Country 2019 & 2032
- Table 62: Global Co-packaged Optics Market Volume K Unit Forecast, by Country 2019 & 2032
- Table 63: Brazil Co-packaged Optics Market Revenue (Million) Forecast, by Application 2019 & 2032
- Table 64: Brazil Co-packaged Optics Market Volume (K Unit) Forecast, by Application 2019 & 2032
- Table 65: Argentina Co-packaged Optics Market Revenue (Million) Forecast, by Application 2019 & 2032
- Table 66: Argentina Co-packaged Optics Market Volume (K Unit) Forecast, by Application 2019 & 2032
- Table 67: Peru Co-packaged Optics Market Revenue (Million) Forecast, by Application 2019 & 2032
- Table 68: Peru Co-packaged Optics Market Volume (K Unit) Forecast, by Application 2019 & 2032
- Table 69: Chile Co-packaged Optics Market Revenue (Million) Forecast, by Application 2019 & 2032
- Table 70: Chile Co-packaged Optics Market Volume (K Unit) Forecast, by Application 2019 & 2032
- Table 71: Colombia Co-packaged Optics Market Revenue (Million) Forecast, by Application 2019 & 2032
- Table 72: Colombia Co-packaged Optics Market Volume (K Unit) Forecast, by Application 2019 & 2032
- Table 73: Ecuador Co-packaged Optics Market Revenue (Million) Forecast, by Application 2019 & 2032
- Table 74: Ecuador Co-packaged Optics Market Volume (K Unit) Forecast, by Application 2019 & 2032
- Table 75: Venezuela Co-packaged Optics Market Revenue (Million) Forecast, by Application 2019 & 2032
- Table 76: Venezuela Co-packaged Optics Market Volume (K Unit) Forecast, by Application 2019 & 2032
- Table 77: Rest of South America Co-packaged Optics Market Revenue (Million) Forecast, by Application 2019 & 2032
- Table 78: Rest of South America Co-packaged Optics Market Volume (K Unit) Forecast, by Application 2019 & 2032
- Table 79: Global Co-packaged Optics Market Revenue Million Forecast, by Country 2019 & 2032
- Table 80: Global Co-packaged Optics Market Volume K Unit Forecast, by Country 2019 & 2032
- Table 81: United States Co-packaged Optics Market Revenue (Million) Forecast, by Application 2019 & 2032
- Table 82: United States Co-packaged Optics Market Volume (K Unit) Forecast, by Application 2019 & 2032
- Table 83: Canada Co-packaged Optics Market Revenue (Million) Forecast, by Application 2019 & 2032
- Table 84: Canada Co-packaged Optics Market Volume (K Unit) Forecast, by Application 2019 & 2032
- Table 85: Mexico Co-packaged Optics Market Revenue (Million) Forecast, by Application 2019 & 2032
- Table 86: Mexico Co-packaged Optics Market Volume (K Unit) Forecast, by Application 2019 & 2032
- Table 87: Global Co-packaged Optics Market Revenue Million Forecast, by Country 2019 & 2032
- Table 88: Global Co-packaged Optics Market Volume K Unit Forecast, by Country 2019 & 2032
- Table 89: United Arab Emirates Co-packaged Optics Market Revenue (Million) Forecast, by Application 2019 & 2032
- Table 90: United Arab Emirates Co-packaged Optics Market Volume (K Unit) Forecast, by Application 2019 & 2032
- Table 91: Saudi Arabia Co-packaged Optics Market Revenue (Million) Forecast, by Application 2019 & 2032
- Table 92: Saudi Arabia Co-packaged Optics Market Volume (K Unit) Forecast, by Application 2019 & 2032
- Table 93: South Africa Co-packaged Optics Market Revenue (Million) Forecast, by Application 2019 & 2032
- Table 94: South Africa Co-packaged Optics Market Volume (K Unit) Forecast, by Application 2019 & 2032
- Table 95: Rest of Middle East and Africa Co-packaged Optics Market Revenue (Million) Forecast, by Application 2019 & 2032
- Table 96: Rest of Middle East and Africa Co-packaged Optics Market Volume (K Unit) Forecast, by Application 2019 & 2032
- Table 97: Global Co-packaged Optics Market Revenue Million Forecast, by Data Rates 2019 & 2032
- Table 98: Global Co-packaged Optics Market Volume K Unit Forecast, by Data Rates 2019 & 2032
- Table 99: Global Co-packaged Optics Market Revenue Million Forecast, by Country 2019 & 2032
- Table 100: Global Co-packaged Optics Market Volume K Unit Forecast, by Country 2019 & 2032
- Table 101: Global Co-packaged Optics Market Revenue Million Forecast, by Data Rates 2019 & 2032
- Table 102: Global Co-packaged Optics Market Volume K Unit Forecast, by Data Rates 2019 & 2032
- Table 103: Global Co-packaged Optics Market Revenue Million Forecast, by Country 2019 & 2032
- Table 104: Global Co-packaged Optics Market Volume K Unit Forecast, by Country 2019 & 2032
- Table 105: Global Co-packaged Optics Market Revenue Million Forecast, by Data Rates 2019 & 2032
- Table 106: Global Co-packaged Optics Market Volume K Unit Forecast, by Data Rates 2019 & 2032
- Table 107: Global Co-packaged Optics Market Revenue Million Forecast, by Country 2019 & 2032
- Table 108: Global Co-packaged Optics Market Volume K Unit Forecast, by Country 2019 & 2032
- Table 109: Global Co-packaged Optics Market Revenue Million Forecast, by Data Rates 2019 & 2032
- Table 110: Global Co-packaged Optics Market Volume K Unit Forecast, by Data Rates 2019 & 2032
- Table 111: Global Co-packaged Optics Market Revenue Million Forecast, by Country 2019 & 2032
- Table 112: Global Co-packaged Optics Market Volume K Unit Forecast, by Country 2019 & 2032
- Table 113: Global Co-packaged Optics Market Revenue Million Forecast, by Data Rates 2019 & 2032
- Table 114: Global Co-packaged Optics Market Volume K Unit Forecast, by Data Rates 2019 & 2032
- Table 115: Global Co-packaged Optics Market Revenue Million Forecast, by Country 2019 & 2032
- Table 116: Global Co-packaged Optics Market Volume K Unit Forecast, by Country 2019 & 2032
- Table 117: Global Co-packaged Optics Market Revenue Million Forecast, by Data Rates 2019 & 2032
- Table 118: Global Co-packaged Optics Market Volume K Unit Forecast, by Data Rates 2019 & 2032
- Table 119: Global Co-packaged Optics Market Revenue Million Forecast, by Country 2019 & 2032
- Table 120: Global Co-packaged Optics Market Volume K Unit Forecast, by Country 2019 & 2032
Frequently Asked Questions
1. What is the projected Compound Annual Growth Rate (CAGR) of the Co-packaged Optics Market?
The projected CAGR is approximately 47.12%.
2. Which companies are prominent players in the Co-packaged Optics Market?
Key companies in the market include Furukawa Electric Co Ltd, IBM Corporation, Kyocera Corporation, TE Connectivity, Cisco Systems Inc, Broadcom Inc, Microsoft Corporation, Ayar Labs Inc, Huawei Technologies Co Ltd, SENKO Advanced Components Inc, Hisense Broadband Multimedia Technology Co Ltd, Sumitomo Electric Industries Lt, Intel Corporation, POET Technologies.
3. What are the main segments of the Co-packaged Optics Market?
The market segments include Data Rates.
4. Can you provide details about the market size?
The market size is estimated to be USD 70.20 Million as of 2022.
5. What are some drivers contributing to market growth?
Increase in Adoption of Smart Devices and Rise in Data Traffic; Growth in the Importance of Mega Data Centers; Growth in High-performance Computing.
6. What are the notable trends driving market growth?
Growth in High-performance Computing.
7. Are there any restraints impacting market growth?
Increase in Network Complexity; Device Compatibility and Sustainability Issues.
8. Can you provide examples of recent developments in the market?
March 2024: Intel developed a 4 Tbps bidirectional fully integrated OCI chiplet based on Intel’s in-house silicon photonics technology. This chiplet, or tile, contains a single silicon photonics integrated circuit (PIC) with integrated lasers, an electrical IC (EIC), and a path to incorporate a detachable/re-usable optical connector. The purpose of this development is to address the AI infrastructure’s significant need for bandwidth and to enable future scalability.
9. What pricing options are available for accessing the report?
Pricing options include single-user, multi-user, and enterprise licenses priced at USD 4750, USD 5250, and USD 8750 respectively.
10. Is the market size provided in terms of value or volume?
The market size is provided in terms of value, measured in Million and volume, measured in K Unit.
11. Are there any specific market keywords associated with the report?
Yes, the market keyword associated with the report is "Co-packaged Optics Market," which aids in identifying and referencing the specific market segment covered.
12. How do I determine which pricing option suits my needs best?
The pricing options vary based on user requirements and access needs. Individual users may opt for single-user licenses, while businesses requiring broader access may choose multi-user or enterprise licenses for cost-effective access to the report.
13. Are there any additional resources or data provided in the Co-packaged Optics Market report?
While the report offers comprehensive insights, it's advisable to review the specific contents or supplementary materials provided to ascertain if additional resources or data are available.
14. How can I stay updated on further developments or reports in the Co-packaged Optics Market?
To stay informed about further developments, trends, and reports in the Co-packaged Optics Market, consider subscribing to industry newsletters, following relevant companies and organizations, or regularly checking reputable industry news sources and publications.
Methodology
Step 1 - Identification of Relevant Samples Size from Population Database


Step 2 - Approaches for Defining Global Market Size (Value, Volume* & Price*)

Note*: In applicable scenarios
Step 3 - Data Sources
Primary Research
- Web Analytics
- Survey Reports
- Research Institute
- Latest Research Reports
- Opinion Leaders
Secondary Research
- Annual Reports
- White Paper
- Latest Press Release
- Industry Association
- Paid Database
- Investor Presentations

Step 4 - Data Triangulation
Involves using different sources of information in order to increase the validity of a study
These sources are likely to be stakeholders in a program - participants, other researchers, program staff, other community members, and so on.
Then we put all data in single framework & apply various statistical tools to find out the dynamic on the market.
During the analysis stage, feedback from the stakeholder groups would be compared to determine areas of agreement as well as areas of divergence
