

Key Insights
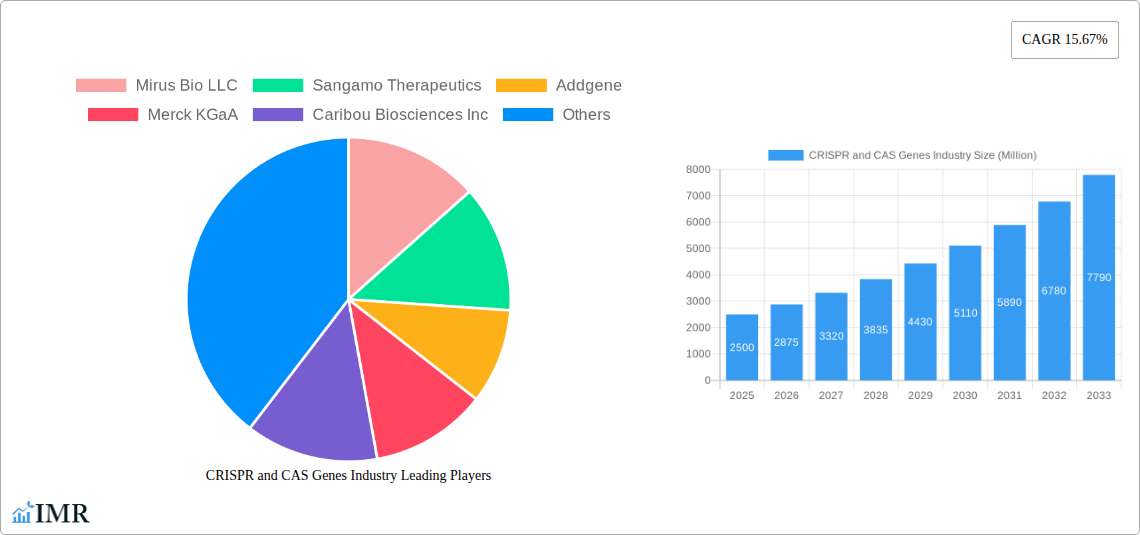
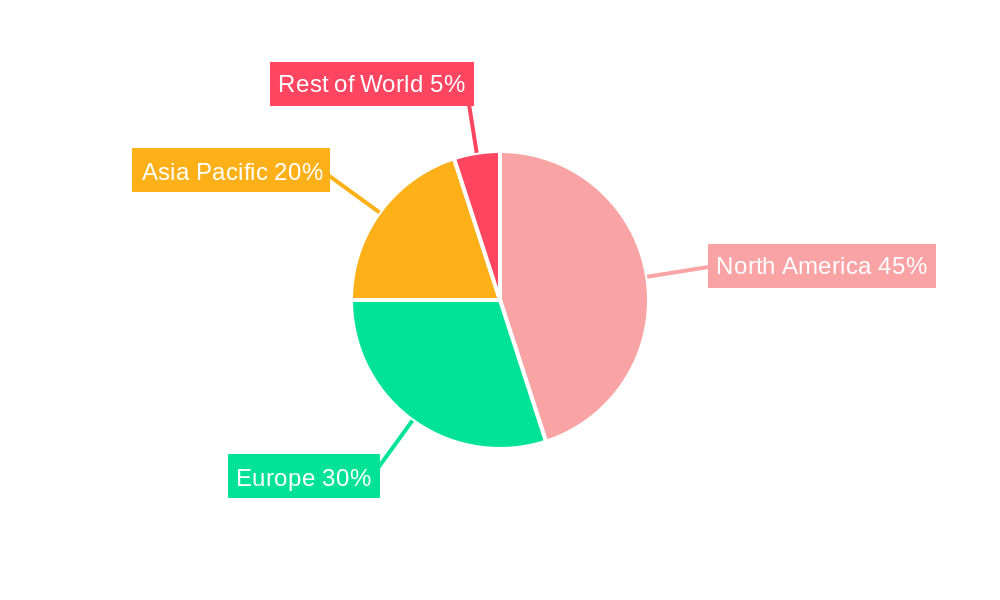
The CRISPR and CAS genes industry is experiencing robust growth, driven by the increasing adoption of CRISPR-Cas technology in various applications. The market's Compound Annual Growth Rate (CAGR) of 15.67% from 2019-2024 suggests a significant upward trajectory, projected to continue in the forecast period (2025-2033). Key drivers include the technology's precision in gene editing, its versatility across diverse research and therapeutic areas (genome engineering, disease modeling, functional genomics), and the decreasing cost of CRISPR-Cas systems. Emerging trends such as the development of next-generation CRISPR systems with improved specificity and efficiency, along with expanding applications in areas like cell therapy and agricultural biotechnology, further fuel market expansion. While challenges exist, such as potential off-target effects and regulatory hurdles, the overall market outlook remains exceptionally positive. The segmentation by product (vector-based Cas, DNA-free Cas) reflects the ongoing innovation and optimization within the technology itself, with DNA-free Cas systems gaining traction due to their enhanced safety profile. Geographically, North America currently holds a dominant market share, owing to a strong research infrastructure and significant investments in biotech. However, the Asia-Pacific region is expected to exhibit high growth potential, fueled by increasing research activities and growing healthcare spending in countries like China and India.
The major players in this dynamic market, including companies like Mirus Bio LLC, Sangamo Therapeutics, and Editas Medicine, are engaged in intense research and development activities, aiming to improve the technology and expand its applications. Strategic partnerships, collaborations, and mergers & acquisitions are common strategies being employed to accelerate innovation and gain a competitive edge. The continuous development of novel CRISPR-based therapeutics and diagnostic tools, coupled with increasing funding for research and development, are likely to propel the CRISPR and CAS genes industry to achieve significant market size expansion by 2033. The market's considerable growth potential attracts further investment, solidifying its position as a leading technology platform for genetic engineering and related therapeutic approaches.
CRISPR and CAS Genes Industry: Market Report 2019-2033
This comprehensive report provides an in-depth analysis of the CRISPR and CAS Genes industry, encompassing market dynamics, growth trends, regional insights, product landscapes, and key players. The study period covers 2019-2033, with a base year of 2025 and a forecast period of 2025-2033. The report leverages both quantitative and qualitative data to offer a complete picture of this rapidly evolving sector, vital for industry professionals, investors, and researchers. Market values are presented in millions of USD.
CRISPR and CAS Genes Industry Market Dynamics & Structure
The CRISPR and CAS genes market is characterized by intense competition among established players and emerging biotech firms. Market concentration is moderate, with several key players holding significant shares, yet a fragmented landscape exists due to the constant emergence of innovative companies and technologies. Technological innovation, particularly in the development of more precise and efficient CRISPR-Cas systems, is the primary growth driver. Regulatory frameworks, varying across regions, pose challenges and opportunities for market expansion. Substitute technologies are limited, enhancing the overall market appeal, though emerging gene editing technologies present a competitive pressure. End-users encompass academic research institutions, pharmaceutical companies, and biotechnology firms, with a rising trend toward therapeutic applications. M&A activity is robust, reflecting the strategic importance of CRISPR technology and the consolidation within the industry.
- Market Concentration: Moderate (xx%)
- Technological Innovation: High, driven by advancements in Cas proteins and delivery systems.
- Regulatory Landscape: Varied by region, with ongoing evolution of guidelines.
- Competitive Substitutes: Limited, but emerging gene editing technologies pose a challenge.
- End-User Demographics: Primarily research institutions, pharmaceutical, and biotech companies.
- M&A Activity: Significant, with xx deals recorded between 2019-2024.
CRISPR and CAS Genes Industry Growth Trends & Insights
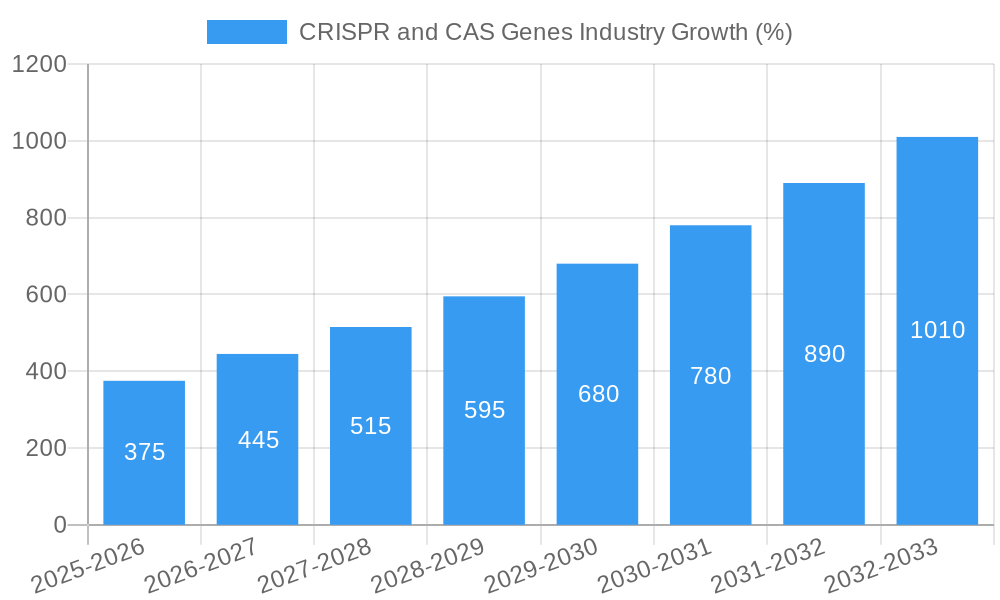
The CRISPR and CAS genes market experienced robust growth during the historical period (2019-2024), driven by increasing adoption in research and therapeutic applications. The market size is projected to reach xx million in 2025 and continue its expansion at a CAGR of xx% during the forecast period (2025-2033), reaching xx million by 2033. This growth is fueled by technological advancements, including the development of improved Cas enzymes, higher efficiency delivery systems, and expanded applications in gene therapy. Increased investment in research and development, coupled with successful clinical trials, significantly contributes to market expansion. Consumer behavior shifts towards personalized medicine and gene-based therapies further propel market growth. Market penetration remains relatively low currently, but is poised for significant expansion in the coming years, particularly within the therapeutic sector.
Dominant Regions, Countries, or Segments in CRISPR and CAS Genes Industry
North America currently dominates the CRISPR and CAS genes market, driven by robust R&D investment, a well-established biotechnology sector, and supportive regulatory environments. Europe is expected to demonstrate significant growth, followed by Asia-Pacific, fueled by increasing research funding and the expanding healthcare infrastructure.
By Product: The Vector-based Cas segment currently holds a larger market share (xx%), due to established methods and infrastructure. However, the DNA-free Cas segment is exhibiting faster growth (xx% CAGR), driven by safety and efficacy improvements.
By Application: Genome engineering dominates the market, representing xx% of the total, owing to its widespread use in basic and applied research. Disease models and functional genomics are also significant segments, exhibiting healthy growth rates.
- North America: Strong R&D investment, established biotech sector, supportive regulations.
- Europe: Increasing research funding, growing healthcare infrastructure.
- Asia-Pacific: Emerging market, significant growth potential.
- Vector-based Cas: Larger market share, established technology.
- DNA-free Cas: High growth potential, safety and efficacy advantages.
- Genome Engineering: Largest application segment, widespread use in research.
CRISPR and CAS Genes Industry Product Landscape
The CRISPR and CAS genes market features a diverse range of products, including various Cas enzymes (Cas9, Cas12a, Cas13), delivery systems (viral and non-viral), and associated reagents. Product innovation focuses on enhancing specificity, reducing off-target effects, and improving delivery efficiency. Advanced Cas variants with improved properties and novel delivery methods are key aspects driving market growth. Unique selling propositions frequently center around enhanced specificity, improved efficacy, and simpler workflows.
Key Drivers, Barriers & Challenges in CRISPR and CAS Genes Industry
Key Drivers: Technological advancements like novel Cas enzymes and delivery systems, increasing research funding, growing demand for gene therapies, supportive regulatory policies in some regions.
Key Barriers & Challenges: High cost of development and manufacturing, stringent regulatory approval processes, potential for off-target effects, ethical concerns surrounding gene editing, and competition from emerging gene-editing technologies. These challenges translate to market entry barriers and impact overall market growth. For instance, regulatory hurdles can delay product launches, impacting revenues by an estimated xx million annually.
Emerging Opportunities in CRISPR and CAS Genes Industry
Emerging opportunities lie in expanding applications beyond research, particularly in gene therapies for various diseases. Untapped markets in developing countries offer significant potential for market expansion. Innovative applications, such as in agriculture and industrial biotechnology, present further opportunities for growth. Personalized medicine using CRISPR-based diagnostics and therapies is another rapidly emerging opportunity.
Growth Accelerators in the CRISPR and CAS Genes Industry Industry
Long-term growth is driven by continuous technological breakthroughs, resulting in more precise and efficient gene editing tools. Strategic partnerships between pharmaceutical companies and biotechnology firms are critical, streamlining the development and commercialization of gene therapies. Market expansion into new therapeutic areas and geographical regions will further accelerate market growth.
Key Players Shaping the CRISPR and CAS Genes Industry Market
- Mirus Bio LLC
- Sangamo Therapeutics
- Addgene
- Merck KGaA
- Caribou Biosciences Inc
- PerkinElmer Inc (Horizon Discovery Ltd )
- Takara Bio Inc
- Intellia Therpeutics
- Inscripta Inc
- OriGene Technologies Inc
- Thermo Fisher Scientific
- Editas Medicine
- CRISPR THERAPEUTICS
Notable Milestones in CRISPR and CAS Genes Industry Sector
- December 2022: A University of California researcher launched a clinical trial (CRISPR_SCD001) evaluating CRISPR/Cas9 edited red blood cells for treating severe sickle cell disease. This significantly advances the therapeutic application of CRISPR technology.
- November 2022: MIT researchers developed PASTE, a new CRISPR-based tool for inserting large DNA sequences, opening new avenues for gene therapy. This represents a significant technological leap with broad implications.
In-Depth CRISPR and CAS Genes Industry Market Outlook
The CRISPR and CAS genes industry is poised for sustained and significant growth, driven by ongoing technological advancements, increased R&D investments, and the expanding applications in gene therapy. Strategic collaborations and market expansions into new geographical regions will further fuel market expansion. The future holds significant potential for CRISPR technology to revolutionize healthcare and various other industries. The market is expected to witness considerable consolidation, with larger players acquiring smaller companies to expand their product portfolios and market reach.
CRISPR and CAS Genes Industry Segmentation
-
1. Product
- 1.1. Vector-based Cas
- 1.2. DNA-free Cas
-
2. Application
- 2.1. Genome Engineering
- 2.2. Disease Models
- 2.3. Functional Genomics
- 2.4. Other Applications
CRISPR and CAS Genes Industry Segmentation By Geography
-
1. North America
- 1.1. United States
- 1.2. Canada
- 1.3. Mexico
-
2. Europe
- 2.1. Germany
- 2.2. United Kingdom
- 2.3. France
- 2.4. Italy
- 2.5. Spain
- 2.6. Rest of Europe
-
3. Asia Pacific
- 3.1. China
- 3.2. Japan
- 3.3. India
- 3.4. Australia
- 3.5. South Korea
- 3.6. Rest of Asia Pacific
-
4. Middle East and Africa
- 4.1. GCC
- 4.2. South Africa
- 4.3. Rest of Middle East and Africa
-
5. South America
- 5.1. Brazil
- 5.2. Argentina
- 5.3. Rest of South America
CRISPR and CAS Genes Industry REPORT HIGHLIGHTS
| Aspects | Details |
|---|---|
| Study Period | 2019-2033 |
| Base Year | 2024 |
| Estimated Year | 2025 |
| Forecast Period | 2025-2033 |
| Historical Period | 2019-2024 |
| Growth Rate | CAGR of 15.67% from 2019-2033 |
| Segmentation |
|
Table of Contents
- 1. Introduction
- 1.1. Research Scope
- 1.2. Market Segmentation
- 1.3. Research Methodology
- 1.4. Definitions and Assumptions
- 2. Executive Summary
- 2.1. Introduction
- 3. Market Dynamics
- 3.1. Introduction
- 3.2. Market Drivers
- 3.2.1. Increasing Investment by Biotechnology Companies for Novel Therapeutics; Increasing Genomics Research and Development Activities and Funding; High Burden of Cancer and Other Diseases
- 3.3. Market Restrains
- 3.3.1. Off-target Effects Associated with the Implementation of CRISPR; High Cost and Ethical Concerns Associated with CRISPR Technology
- 3.4. Market Trends
- 3.4.1. Genome Engineering Segment is Anticipated to Witness a Growth in the Market Over the Forecast Period
- 4. Market Factor Analysis
- 4.1. Porters Five Forces
- 4.2. Supply/Value Chain
- 4.3. PESTEL analysis
- 4.4. Market Entropy
- 4.5. Patent/Trademark Analysis
- 5. Global CRISPR and CAS Genes Industry Analysis, Insights and Forecast, 2019-2031
- 5.1. Market Analysis, Insights and Forecast - by Product
- 5.1.1. Vector-based Cas
- 5.1.2. DNA-free Cas
- 5.2. Market Analysis, Insights and Forecast - by Application
- 5.2.1. Genome Engineering
- 5.2.2. Disease Models
- 5.2.3. Functional Genomics
- 5.2.4. Other Applications
- 5.3. Market Analysis, Insights and Forecast - by Region
- 5.3.1. North America
- 5.3.2. Europe
- 5.3.3. Asia Pacific
- 5.3.4. Middle East and Africa
- 5.3.5. South America
- 5.1. Market Analysis, Insights and Forecast - by Product
- 6. North America CRISPR and CAS Genes Industry Analysis, Insights and Forecast, 2019-2031
- 6.1. Market Analysis, Insights and Forecast - by Product
- 6.1.1. Vector-based Cas
- 6.1.2. DNA-free Cas
- 6.2. Market Analysis, Insights and Forecast - by Application
- 6.2.1. Genome Engineering
- 6.2.2. Disease Models
- 6.2.3. Functional Genomics
- 6.2.4. Other Applications
- 6.1. Market Analysis, Insights and Forecast - by Product
- 7. Europe CRISPR and CAS Genes Industry Analysis, Insights and Forecast, 2019-2031
- 7.1. Market Analysis, Insights and Forecast - by Product
- 7.1.1. Vector-based Cas
- 7.1.2. DNA-free Cas
- 7.2. Market Analysis, Insights and Forecast - by Application
- 7.2.1. Genome Engineering
- 7.2.2. Disease Models
- 7.2.3. Functional Genomics
- 7.2.4. Other Applications
- 7.1. Market Analysis, Insights and Forecast - by Product
- 8. Asia Pacific CRISPR and CAS Genes Industry Analysis, Insights and Forecast, 2019-2031
- 8.1. Market Analysis, Insights and Forecast - by Product
- 8.1.1. Vector-based Cas
- 8.1.2. DNA-free Cas
- 8.2. Market Analysis, Insights and Forecast - by Application
- 8.2.1. Genome Engineering
- 8.2.2. Disease Models
- 8.2.3. Functional Genomics
- 8.2.4. Other Applications
- 8.1. Market Analysis, Insights and Forecast - by Product
- 9. Middle East and Africa CRISPR and CAS Genes Industry Analysis, Insights and Forecast, 2019-2031
- 9.1. Market Analysis, Insights and Forecast - by Product
- 9.1.1. Vector-based Cas
- 9.1.2. DNA-free Cas
- 9.2. Market Analysis, Insights and Forecast - by Application
- 9.2.1. Genome Engineering
- 9.2.2. Disease Models
- 9.2.3. Functional Genomics
- 9.2.4. Other Applications
- 9.1. Market Analysis, Insights and Forecast - by Product
- 10. South America CRISPR and CAS Genes Industry Analysis, Insights and Forecast, 2019-2031
- 10.1. Market Analysis, Insights and Forecast - by Product
- 10.1.1. Vector-based Cas
- 10.1.2. DNA-free Cas
- 10.2. Market Analysis, Insights and Forecast - by Application
- 10.2.1. Genome Engineering
- 10.2.2. Disease Models
- 10.2.3. Functional Genomics
- 10.2.4. Other Applications
- 10.1. Market Analysis, Insights and Forecast - by Product
- 11. North America CRISPR and CAS Genes Industry Analysis, Insights and Forecast, 2019-2031
- 11.1. Market Analysis, Insights and Forecast - By Country/Sub-region
- 11.1.1 United States
- 11.1.2 Canada
- 11.1.3 Mexico
- 12. Europe CRISPR and CAS Genes Industry Analysis, Insights and Forecast, 2019-2031
- 12.1. Market Analysis, Insights and Forecast - By Country/Sub-region
- 12.1.1 Germany
- 12.1.2 United Kingdom
- 12.1.3 France
- 12.1.4 Italy
- 12.1.5 Spain
- 12.1.6 Rest of Europe
- 13. Asia Pacific CRISPR and CAS Genes Industry Analysis, Insights and Forecast, 2019-2031
- 13.1. Market Analysis, Insights and Forecast - By Country/Sub-region
- 13.1.1 China
- 13.1.2 Japan
- 13.1.3 India
- 13.1.4 Australia
- 13.1.5 South Korea
- 13.1.6 Rest of Asia Pacific
- 14. Middle East and Africa CRISPR and CAS Genes Industry Analysis, Insights and Forecast, 2019-2031
- 14.1. Market Analysis, Insights and Forecast - By Country/Sub-region
- 14.1.1 GCC
- 14.1.2 South Africa
- 14.1.3 Rest of Middle East and Africa
- 15. South America CRISPR and CAS Genes Industry Analysis, Insights and Forecast, 2019-2031
- 15.1. Market Analysis, Insights and Forecast - By Country/Sub-region
- 15.1.1 Brazil
- 15.1.2 Argentina
- 15.1.3 Rest of South America
- 16. Competitive Analysis
- 16.1. Global Market Share Analysis 2024
- 16.2. Company Profiles
- 16.2.1 Mirus Bio LLC
- 16.2.1.1. Overview
- 16.2.1.2. Products
- 16.2.1.3. SWOT Analysis
- 16.2.1.4. Recent Developments
- 16.2.1.5. Financials (Based on Availability)
- 16.2.2 Sangamo Therapeutics
- 16.2.2.1. Overview
- 16.2.2.2. Products
- 16.2.2.3. SWOT Analysis
- 16.2.2.4. Recent Developments
- 16.2.2.5. Financials (Based on Availability)
- 16.2.3 Addgene
- 16.2.3.1. Overview
- 16.2.3.2. Products
- 16.2.3.3. SWOT Analysis
- 16.2.3.4. Recent Developments
- 16.2.3.5. Financials (Based on Availability)
- 16.2.4 Merck KGaA
- 16.2.4.1. Overview
- 16.2.4.2. Products
- 16.2.4.3. SWOT Analysis
- 16.2.4.4. Recent Developments
- 16.2.4.5. Financials (Based on Availability)
- 16.2.5 Caribou Biosciences Inc
- 16.2.5.1. Overview
- 16.2.5.2. Products
- 16.2.5.3. SWOT Analysis
- 16.2.5.4. Recent Developments
- 16.2.5.5. Financials (Based on Availability)
- 16.2.6 PerkinElmer Inc (Horizon Discovery Ltd )
- 16.2.6.1. Overview
- 16.2.6.2. Products
- 16.2.6.3. SWOT Analysis
- 16.2.6.4. Recent Developments
- 16.2.6.5. Financials (Based on Availability)
- 16.2.7 Takara Bio Inc
- 16.2.7.1. Overview
- 16.2.7.2. Products
- 16.2.7.3. SWOT Analysis
- 16.2.7.4. Recent Developments
- 16.2.7.5. Financials (Based on Availability)
- 16.2.8 Intellia Therpeutics
- 16.2.8.1. Overview
- 16.2.8.2. Products
- 16.2.8.3. SWOT Analysis
- 16.2.8.4. Recent Developments
- 16.2.8.5. Financials (Based on Availability)
- 16.2.9 Inscripta Inc
- 16.2.9.1. Overview
- 16.2.9.2. Products
- 16.2.9.3. SWOT Analysis
- 16.2.9.4. Recent Developments
- 16.2.9.5. Financials (Based on Availability)
- 16.2.10 OriGene Technologies Inc
- 16.2.10.1. Overview
- 16.2.10.2. Products
- 16.2.10.3. SWOT Analysis
- 16.2.10.4. Recent Developments
- 16.2.10.5. Financials (Based on Availability)
- 16.2.11 Thermo Fisher Scientific
- 16.2.11.1. Overview
- 16.2.11.2. Products
- 16.2.11.3. SWOT Analysis
- 16.2.11.4. Recent Developments
- 16.2.11.5. Financials (Based on Availability)
- 16.2.12 Editas Medicine
- 16.2.12.1. Overview
- 16.2.12.2. Products
- 16.2.12.3. SWOT Analysis
- 16.2.12.4. Recent Developments
- 16.2.12.5. Financials (Based on Availability)
- 16.2.13 CRISPR THERAPEUTICS
- 16.2.13.1. Overview
- 16.2.13.2. Products
- 16.2.13.3. SWOT Analysis
- 16.2.13.4. Recent Developments
- 16.2.13.5. Financials (Based on Availability)
- 16.2.1 Mirus Bio LLC
List of Figures
- Figure 1: Global CRISPR and CAS Genes Industry Revenue Breakdown (Million, %) by Region 2024 & 2032
- Figure 2: Global CRISPR and CAS Genes Industry Volume Breakdown (K Unit, %) by Region 2024 & 2032
- Figure 3: North America CRISPR and CAS Genes Industry Revenue (Million), by Country 2024 & 2032
- Figure 4: North America CRISPR and CAS Genes Industry Volume (K Unit), by Country 2024 & 2032
- Figure 5: North America CRISPR and CAS Genes Industry Revenue Share (%), by Country 2024 & 2032
- Figure 6: North America CRISPR and CAS Genes Industry Volume Share (%), by Country 2024 & 2032
- Figure 7: Europe CRISPR and CAS Genes Industry Revenue (Million), by Country 2024 & 2032
- Figure 8: Europe CRISPR and CAS Genes Industry Volume (K Unit), by Country 2024 & 2032
- Figure 9: Europe CRISPR and CAS Genes Industry Revenue Share (%), by Country 2024 & 2032
- Figure 10: Europe CRISPR and CAS Genes Industry Volume Share (%), by Country 2024 & 2032
- Figure 11: Asia Pacific CRISPR and CAS Genes Industry Revenue (Million), by Country 2024 & 2032
- Figure 12: Asia Pacific CRISPR and CAS Genes Industry Volume (K Unit), by Country 2024 & 2032
- Figure 13: Asia Pacific CRISPR and CAS Genes Industry Revenue Share (%), by Country 2024 & 2032
- Figure 14: Asia Pacific CRISPR and CAS Genes Industry Volume Share (%), by Country 2024 & 2032
- Figure 15: Middle East and Africa CRISPR and CAS Genes Industry Revenue (Million), by Country 2024 & 2032
- Figure 16: Middle East and Africa CRISPR and CAS Genes Industry Volume (K Unit), by Country 2024 & 2032
- Figure 17: Middle East and Africa CRISPR and CAS Genes Industry Revenue Share (%), by Country 2024 & 2032
- Figure 18: Middle East and Africa CRISPR and CAS Genes Industry Volume Share (%), by Country 2024 & 2032
- Figure 19: South America CRISPR and CAS Genes Industry Revenue (Million), by Country 2024 & 2032
- Figure 20: South America CRISPR and CAS Genes Industry Volume (K Unit), by Country 2024 & 2032
- Figure 21: South America CRISPR and CAS Genes Industry Revenue Share (%), by Country 2024 & 2032
- Figure 22: South America CRISPR and CAS Genes Industry Volume Share (%), by Country 2024 & 2032
- Figure 23: North America CRISPR and CAS Genes Industry Revenue (Million), by Product 2024 & 2032
- Figure 24: North America CRISPR and CAS Genes Industry Volume (K Unit), by Product 2024 & 2032
- Figure 25: North America CRISPR and CAS Genes Industry Revenue Share (%), by Product 2024 & 2032
- Figure 26: North America CRISPR and CAS Genes Industry Volume Share (%), by Product 2024 & 2032
- Figure 27: North America CRISPR and CAS Genes Industry Revenue (Million), by Application 2024 & 2032
- Figure 28: North America CRISPR and CAS Genes Industry Volume (K Unit), by Application 2024 & 2032
- Figure 29: North America CRISPR and CAS Genes Industry Revenue Share (%), by Application 2024 & 2032
- Figure 30: North America CRISPR and CAS Genes Industry Volume Share (%), by Application 2024 & 2032
- Figure 31: North America CRISPR and CAS Genes Industry Revenue (Million), by Country 2024 & 2032
- Figure 32: North America CRISPR and CAS Genes Industry Volume (K Unit), by Country 2024 & 2032
- Figure 33: North America CRISPR and CAS Genes Industry Revenue Share (%), by Country 2024 & 2032
- Figure 34: North America CRISPR and CAS Genes Industry Volume Share (%), by Country 2024 & 2032
- Figure 35: Europe CRISPR and CAS Genes Industry Revenue (Million), by Product 2024 & 2032
- Figure 36: Europe CRISPR and CAS Genes Industry Volume (K Unit), by Product 2024 & 2032
- Figure 37: Europe CRISPR and CAS Genes Industry Revenue Share (%), by Product 2024 & 2032
- Figure 38: Europe CRISPR and CAS Genes Industry Volume Share (%), by Product 2024 & 2032
- Figure 39: Europe CRISPR and CAS Genes Industry Revenue (Million), by Application 2024 & 2032
- Figure 40: Europe CRISPR and CAS Genes Industry Volume (K Unit), by Application 2024 & 2032
- Figure 41: Europe CRISPR and CAS Genes Industry Revenue Share (%), by Application 2024 & 2032
- Figure 42: Europe CRISPR and CAS Genes Industry Volume Share (%), by Application 2024 & 2032
- Figure 43: Europe CRISPR and CAS Genes Industry Revenue (Million), by Country 2024 & 2032
- Figure 44: Europe CRISPR and CAS Genes Industry Volume (K Unit), by Country 2024 & 2032
- Figure 45: Europe CRISPR and CAS Genes Industry Revenue Share (%), by Country 2024 & 2032
- Figure 46: Europe CRISPR and CAS Genes Industry Volume Share (%), by Country 2024 & 2032
- Figure 47: Asia Pacific CRISPR and CAS Genes Industry Revenue (Million), by Product 2024 & 2032
- Figure 48: Asia Pacific CRISPR and CAS Genes Industry Volume (K Unit), by Product 2024 & 2032
- Figure 49: Asia Pacific CRISPR and CAS Genes Industry Revenue Share (%), by Product 2024 & 2032
- Figure 50: Asia Pacific CRISPR and CAS Genes Industry Volume Share (%), by Product 2024 & 2032
- Figure 51: Asia Pacific CRISPR and CAS Genes Industry Revenue (Million), by Application 2024 & 2032
- Figure 52: Asia Pacific CRISPR and CAS Genes Industry Volume (K Unit), by Application 2024 & 2032
- Figure 53: Asia Pacific CRISPR and CAS Genes Industry Revenue Share (%), by Application 2024 & 2032
- Figure 54: Asia Pacific CRISPR and CAS Genes Industry Volume Share (%), by Application 2024 & 2032
- Figure 55: Asia Pacific CRISPR and CAS Genes Industry Revenue (Million), by Country 2024 & 2032
- Figure 56: Asia Pacific CRISPR and CAS Genes Industry Volume (K Unit), by Country 2024 & 2032
- Figure 57: Asia Pacific CRISPR and CAS Genes Industry Revenue Share (%), by Country 2024 & 2032
- Figure 58: Asia Pacific CRISPR and CAS Genes Industry Volume Share (%), by Country 2024 & 2032
- Figure 59: Middle East and Africa CRISPR and CAS Genes Industry Revenue (Million), by Product 2024 & 2032
- Figure 60: Middle East and Africa CRISPR and CAS Genes Industry Volume (K Unit), by Product 2024 & 2032
- Figure 61: Middle East and Africa CRISPR and CAS Genes Industry Revenue Share (%), by Product 2024 & 2032
- Figure 62: Middle East and Africa CRISPR and CAS Genes Industry Volume Share (%), by Product 2024 & 2032
- Figure 63: Middle East and Africa CRISPR and CAS Genes Industry Revenue (Million), by Application 2024 & 2032
- Figure 64: Middle East and Africa CRISPR and CAS Genes Industry Volume (K Unit), by Application 2024 & 2032
- Figure 65: Middle East and Africa CRISPR and CAS Genes Industry Revenue Share (%), by Application 2024 & 2032
- Figure 66: Middle East and Africa CRISPR and CAS Genes Industry Volume Share (%), by Application 2024 & 2032
- Figure 67: Middle East and Africa CRISPR and CAS Genes Industry Revenue (Million), by Country 2024 & 2032
- Figure 68: Middle East and Africa CRISPR and CAS Genes Industry Volume (K Unit), by Country 2024 & 2032
- Figure 69: Middle East and Africa CRISPR and CAS Genes Industry Revenue Share (%), by Country 2024 & 2032
- Figure 70: Middle East and Africa CRISPR and CAS Genes Industry Volume Share (%), by Country 2024 & 2032
- Figure 71: South America CRISPR and CAS Genes Industry Revenue (Million), by Product 2024 & 2032
- Figure 72: South America CRISPR and CAS Genes Industry Volume (K Unit), by Product 2024 & 2032
- Figure 73: South America CRISPR and CAS Genes Industry Revenue Share (%), by Product 2024 & 2032
- Figure 74: South America CRISPR and CAS Genes Industry Volume Share (%), by Product 2024 & 2032
- Figure 75: South America CRISPR and CAS Genes Industry Revenue (Million), by Application 2024 & 2032
- Figure 76: South America CRISPR and CAS Genes Industry Volume (K Unit), by Application 2024 & 2032
- Figure 77: South America CRISPR and CAS Genes Industry Revenue Share (%), by Application 2024 & 2032
- Figure 78: South America CRISPR and CAS Genes Industry Volume Share (%), by Application 2024 & 2032
- Figure 79: South America CRISPR and CAS Genes Industry Revenue (Million), by Country 2024 & 2032
- Figure 80: South America CRISPR and CAS Genes Industry Volume (K Unit), by Country 2024 & 2032
- Figure 81: South America CRISPR and CAS Genes Industry Revenue Share (%), by Country 2024 & 2032
- Figure 82: South America CRISPR and CAS Genes Industry Volume Share (%), by Country 2024 & 2032
List of Tables
- Table 1: Global CRISPR and CAS Genes Industry Revenue Million Forecast, by Region 2019 & 2032
- Table 2: Global CRISPR and CAS Genes Industry Volume K Unit Forecast, by Region 2019 & 2032
- Table 3: Global CRISPR and CAS Genes Industry Revenue Million Forecast, by Product 2019 & 2032
- Table 4: Global CRISPR and CAS Genes Industry Volume K Unit Forecast, by Product 2019 & 2032
- Table 5: Global CRISPR and CAS Genes Industry Revenue Million Forecast, by Application 2019 & 2032
- Table 6: Global CRISPR and CAS Genes Industry Volume K Unit Forecast, by Application 2019 & 2032
- Table 7: Global CRISPR and CAS Genes Industry Revenue Million Forecast, by Region 2019 & 2032
- Table 8: Global CRISPR and CAS Genes Industry Volume K Unit Forecast, by Region 2019 & 2032
- Table 9: Global CRISPR and CAS Genes Industry Revenue Million Forecast, by Country 2019 & 2032
- Table 10: Global CRISPR and CAS Genes Industry Volume K Unit Forecast, by Country 2019 & 2032
- Table 11: United States CRISPR and CAS Genes Industry Revenue (Million) Forecast, by Application 2019 & 2032
- Table 12: United States CRISPR and CAS Genes Industry Volume (K Unit) Forecast, by Application 2019 & 2032
- Table 13: Canada CRISPR and CAS Genes Industry Revenue (Million) Forecast, by Application 2019 & 2032
- Table 14: Canada CRISPR and CAS Genes Industry Volume (K Unit) Forecast, by Application 2019 & 2032
- Table 15: Mexico CRISPR and CAS Genes Industry Revenue (Million) Forecast, by Application 2019 & 2032
- Table 16: Mexico CRISPR and CAS Genes Industry Volume (K Unit) Forecast, by Application 2019 & 2032
- Table 17: Global CRISPR and CAS Genes Industry Revenue Million Forecast, by Country 2019 & 2032
- Table 18: Global CRISPR and CAS Genes Industry Volume K Unit Forecast, by Country 2019 & 2032
- Table 19: Germany CRISPR and CAS Genes Industry Revenue (Million) Forecast, by Application 2019 & 2032
- Table 20: Germany CRISPR and CAS Genes Industry Volume (K Unit) Forecast, by Application 2019 & 2032
- Table 21: United Kingdom CRISPR and CAS Genes Industry Revenue (Million) Forecast, by Application 2019 & 2032
- Table 22: United Kingdom CRISPR and CAS Genes Industry Volume (K Unit) Forecast, by Application 2019 & 2032
- Table 23: France CRISPR and CAS Genes Industry Revenue (Million) Forecast, by Application 2019 & 2032
- Table 24: France CRISPR and CAS Genes Industry Volume (K Unit) Forecast, by Application 2019 & 2032
- Table 25: Italy CRISPR and CAS Genes Industry Revenue (Million) Forecast, by Application 2019 & 2032
- Table 26: Italy CRISPR and CAS Genes Industry Volume (K Unit) Forecast, by Application 2019 & 2032
- Table 27: Spain CRISPR and CAS Genes Industry Revenue (Million) Forecast, by Application 2019 & 2032
- Table 28: Spain CRISPR and CAS Genes Industry Volume (K Unit) Forecast, by Application 2019 & 2032
- Table 29: Rest of Europe CRISPR and CAS Genes Industry Revenue (Million) Forecast, by Application 2019 & 2032
- Table 30: Rest of Europe CRISPR and CAS Genes Industry Volume (K Unit) Forecast, by Application 2019 & 2032
- Table 31: Global CRISPR and CAS Genes Industry Revenue Million Forecast, by Country 2019 & 2032
- Table 32: Global CRISPR and CAS Genes Industry Volume K Unit Forecast, by Country 2019 & 2032
- Table 33: China CRISPR and CAS Genes Industry Revenue (Million) Forecast, by Application 2019 & 2032
- Table 34: China CRISPR and CAS Genes Industry Volume (K Unit) Forecast, by Application 2019 & 2032
- Table 35: Japan CRISPR and CAS Genes Industry Revenue (Million) Forecast, by Application 2019 & 2032
- Table 36: Japan CRISPR and CAS Genes Industry Volume (K Unit) Forecast, by Application 2019 & 2032
- Table 37: India CRISPR and CAS Genes Industry Revenue (Million) Forecast, by Application 2019 & 2032
- Table 38: India CRISPR and CAS Genes Industry Volume (K Unit) Forecast, by Application 2019 & 2032
- Table 39: Australia CRISPR and CAS Genes Industry Revenue (Million) Forecast, by Application 2019 & 2032
- Table 40: Australia CRISPR and CAS Genes Industry Volume (K Unit) Forecast, by Application 2019 & 2032
- Table 41: South Korea CRISPR and CAS Genes Industry Revenue (Million) Forecast, by Application 2019 & 2032
- Table 42: South Korea CRISPR and CAS Genes Industry Volume (K Unit) Forecast, by Application 2019 & 2032
- Table 43: Rest of Asia Pacific CRISPR and CAS Genes Industry Revenue (Million) Forecast, by Application 2019 & 2032
- Table 44: Rest of Asia Pacific CRISPR and CAS Genes Industry Volume (K Unit) Forecast, by Application 2019 & 2032
- Table 45: Global CRISPR and CAS Genes Industry Revenue Million Forecast, by Country 2019 & 2032
- Table 46: Global CRISPR and CAS Genes Industry Volume K Unit Forecast, by Country 2019 & 2032
- Table 47: GCC CRISPR and CAS Genes Industry Revenue (Million) Forecast, by Application 2019 & 2032
- Table 48: GCC CRISPR and CAS Genes Industry Volume (K Unit) Forecast, by Application 2019 & 2032
- Table 49: South Africa CRISPR and CAS Genes Industry Revenue (Million) Forecast, by Application 2019 & 2032
- Table 50: South Africa CRISPR and CAS Genes Industry Volume (K Unit) Forecast, by Application 2019 & 2032
- Table 51: Rest of Middle East and Africa CRISPR and CAS Genes Industry Revenue (Million) Forecast, by Application 2019 & 2032
- Table 52: Rest of Middle East and Africa CRISPR and CAS Genes Industry Volume (K Unit) Forecast, by Application 2019 & 2032
- Table 53: Global CRISPR and CAS Genes Industry Revenue Million Forecast, by Country 2019 & 2032
- Table 54: Global CRISPR and CAS Genes Industry Volume K Unit Forecast, by Country 2019 & 2032
- Table 55: Brazil CRISPR and CAS Genes Industry Revenue (Million) Forecast, by Application 2019 & 2032
- Table 56: Brazil CRISPR and CAS Genes Industry Volume (K Unit) Forecast, by Application 2019 & 2032
- Table 57: Argentina CRISPR and CAS Genes Industry Revenue (Million) Forecast, by Application 2019 & 2032
- Table 58: Argentina CRISPR and CAS Genes Industry Volume (K Unit) Forecast, by Application 2019 & 2032
- Table 59: Rest of South America CRISPR and CAS Genes Industry Revenue (Million) Forecast, by Application 2019 & 2032
- Table 60: Rest of South America CRISPR and CAS Genes Industry Volume (K Unit) Forecast, by Application 2019 & 2032
- Table 61: Global CRISPR and CAS Genes Industry Revenue Million Forecast, by Product 2019 & 2032
- Table 62: Global CRISPR and CAS Genes Industry Volume K Unit Forecast, by Product 2019 & 2032
- Table 63: Global CRISPR and CAS Genes Industry Revenue Million Forecast, by Application 2019 & 2032
- Table 64: Global CRISPR and CAS Genes Industry Volume K Unit Forecast, by Application 2019 & 2032
- Table 65: Global CRISPR and CAS Genes Industry Revenue Million Forecast, by Country 2019 & 2032
- Table 66: Global CRISPR and CAS Genes Industry Volume K Unit Forecast, by Country 2019 & 2032
- Table 67: United States CRISPR and CAS Genes Industry Revenue (Million) Forecast, by Application 2019 & 2032
- Table 68: United States CRISPR and CAS Genes Industry Volume (K Unit) Forecast, by Application 2019 & 2032
- Table 69: Canada CRISPR and CAS Genes Industry Revenue (Million) Forecast, by Application 2019 & 2032
- Table 70: Canada CRISPR and CAS Genes Industry Volume (K Unit) Forecast, by Application 2019 & 2032
- Table 71: Mexico CRISPR and CAS Genes Industry Revenue (Million) Forecast, by Application 2019 & 2032
- Table 72: Mexico CRISPR and CAS Genes Industry Volume (K Unit) Forecast, by Application 2019 & 2032
- Table 73: Global CRISPR and CAS Genes Industry Revenue Million Forecast, by Product 2019 & 2032
- Table 74: Global CRISPR and CAS Genes Industry Volume K Unit Forecast, by Product 2019 & 2032
- Table 75: Global CRISPR and CAS Genes Industry Revenue Million Forecast, by Application 2019 & 2032
- Table 76: Global CRISPR and CAS Genes Industry Volume K Unit Forecast, by Application 2019 & 2032
- Table 77: Global CRISPR and CAS Genes Industry Revenue Million Forecast, by Country 2019 & 2032
- Table 78: Global CRISPR and CAS Genes Industry Volume K Unit Forecast, by Country 2019 & 2032
- Table 79: Germany CRISPR and CAS Genes Industry Revenue (Million) Forecast, by Application 2019 & 2032
- Table 80: Germany CRISPR and CAS Genes Industry Volume (K Unit) Forecast, by Application 2019 & 2032
- Table 81: United Kingdom CRISPR and CAS Genes Industry Revenue (Million) Forecast, by Application 2019 & 2032
- Table 82: United Kingdom CRISPR and CAS Genes Industry Volume (K Unit) Forecast, by Application 2019 & 2032
- Table 83: France CRISPR and CAS Genes Industry Revenue (Million) Forecast, by Application 2019 & 2032
- Table 84: France CRISPR and CAS Genes Industry Volume (K Unit) Forecast, by Application 2019 & 2032
- Table 85: Italy CRISPR and CAS Genes Industry Revenue (Million) Forecast, by Application 2019 & 2032
- Table 86: Italy CRISPR and CAS Genes Industry Volume (K Unit) Forecast, by Application 2019 & 2032
- Table 87: Spain CRISPR and CAS Genes Industry Revenue (Million) Forecast, by Application 2019 & 2032
- Table 88: Spain CRISPR and CAS Genes Industry Volume (K Unit) Forecast, by Application 2019 & 2032
- Table 89: Rest of Europe CRISPR and CAS Genes Industry Revenue (Million) Forecast, by Application 2019 & 2032
- Table 90: Rest of Europe CRISPR and CAS Genes Industry Volume (K Unit) Forecast, by Application 2019 & 2032
- Table 91: Global CRISPR and CAS Genes Industry Revenue Million Forecast, by Product 2019 & 2032
- Table 92: Global CRISPR and CAS Genes Industry Volume K Unit Forecast, by Product 2019 & 2032
- Table 93: Global CRISPR and CAS Genes Industry Revenue Million Forecast, by Application 2019 & 2032
- Table 94: Global CRISPR and CAS Genes Industry Volume K Unit Forecast, by Application 2019 & 2032
- Table 95: Global CRISPR and CAS Genes Industry Revenue Million Forecast, by Country 2019 & 2032
- Table 96: Global CRISPR and CAS Genes Industry Volume K Unit Forecast, by Country 2019 & 2032
- Table 97: China CRISPR and CAS Genes Industry Revenue (Million) Forecast, by Application 2019 & 2032
- Table 98: China CRISPR and CAS Genes Industry Volume (K Unit) Forecast, by Application 2019 & 2032
- Table 99: Japan CRISPR and CAS Genes Industry Revenue (Million) Forecast, by Application 2019 & 2032
- Table 100: Japan CRISPR and CAS Genes Industry Volume (K Unit) Forecast, by Application 2019 & 2032
- Table 101: India CRISPR and CAS Genes Industry Revenue (Million) Forecast, by Application 2019 & 2032
- Table 102: India CRISPR and CAS Genes Industry Volume (K Unit) Forecast, by Application 2019 & 2032
- Table 103: Australia CRISPR and CAS Genes Industry Revenue (Million) Forecast, by Application 2019 & 2032
- Table 104: Australia CRISPR and CAS Genes Industry Volume (K Unit) Forecast, by Application 2019 & 2032
- Table 105: South Korea CRISPR and CAS Genes Industry Revenue (Million) Forecast, by Application 2019 & 2032
- Table 106: South Korea CRISPR and CAS Genes Industry Volume (K Unit) Forecast, by Application 2019 & 2032
- Table 107: Rest of Asia Pacific CRISPR and CAS Genes Industry Revenue (Million) Forecast, by Application 2019 & 2032
- Table 108: Rest of Asia Pacific CRISPR and CAS Genes Industry Volume (K Unit) Forecast, by Application 2019 & 2032
- Table 109: Global CRISPR and CAS Genes Industry Revenue Million Forecast, by Product 2019 & 2032
- Table 110: Global CRISPR and CAS Genes Industry Volume K Unit Forecast, by Product 2019 & 2032
- Table 111: Global CRISPR and CAS Genes Industry Revenue Million Forecast, by Application 2019 & 2032
- Table 112: Global CRISPR and CAS Genes Industry Volume K Unit Forecast, by Application 2019 & 2032
- Table 113: Global CRISPR and CAS Genes Industry Revenue Million Forecast, by Country 2019 & 2032
- Table 114: Global CRISPR and CAS Genes Industry Volume K Unit Forecast, by Country 2019 & 2032
- Table 115: GCC CRISPR and CAS Genes Industry Revenue (Million) Forecast, by Application 2019 & 2032
- Table 116: GCC CRISPR and CAS Genes Industry Volume (K Unit) Forecast, by Application 2019 & 2032
- Table 117: South Africa CRISPR and CAS Genes Industry Revenue (Million) Forecast, by Application 2019 & 2032
- Table 118: South Africa CRISPR and CAS Genes Industry Volume (K Unit) Forecast, by Application 2019 & 2032
- Table 119: Rest of Middle East and Africa CRISPR and CAS Genes Industry Revenue (Million) Forecast, by Application 2019 & 2032
- Table 120: Rest of Middle East and Africa CRISPR and CAS Genes Industry Volume (K Unit) Forecast, by Application 2019 & 2032
- Table 121: Global CRISPR and CAS Genes Industry Revenue Million Forecast, by Product 2019 & 2032
- Table 122: Global CRISPR and CAS Genes Industry Volume K Unit Forecast, by Product 2019 & 2032
- Table 123: Global CRISPR and CAS Genes Industry Revenue Million Forecast, by Application 2019 & 2032
- Table 124: Global CRISPR and CAS Genes Industry Volume K Unit Forecast, by Application 2019 & 2032
- Table 125: Global CRISPR and CAS Genes Industry Revenue Million Forecast, by Country 2019 & 2032
- Table 126: Global CRISPR and CAS Genes Industry Volume K Unit Forecast, by Country 2019 & 2032
- Table 127: Brazil CRISPR and CAS Genes Industry Revenue (Million) Forecast, by Application 2019 & 2032
- Table 128: Brazil CRISPR and CAS Genes Industry Volume (K Unit) Forecast, by Application 2019 & 2032
- Table 129: Argentina CRISPR and CAS Genes Industry Revenue (Million) Forecast, by Application 2019 & 2032
- Table 130: Argentina CRISPR and CAS Genes Industry Volume (K Unit) Forecast, by Application 2019 & 2032
- Table 131: Rest of South America CRISPR and CAS Genes Industry Revenue (Million) Forecast, by Application 2019 & 2032
- Table 132: Rest of South America CRISPR and CAS Genes Industry Volume (K Unit) Forecast, by Application 2019 & 2032
Frequently Asked Questions
1. What is the projected Compound Annual Growth Rate (CAGR) of the CRISPR and CAS Genes Industry?
The projected CAGR is approximately 15.67%.
2. Which companies are prominent players in the CRISPR and CAS Genes Industry?
Key companies in the market include Mirus Bio LLC, Sangamo Therapeutics, Addgene, Merck KGaA, Caribou Biosciences Inc, PerkinElmer Inc (Horizon Discovery Ltd ), Takara Bio Inc, Intellia Therpeutics, Inscripta Inc, OriGene Technologies Inc, Thermo Fisher Scientific, Editas Medicine, CRISPR THERAPEUTICS.
3. What are the main segments of the CRISPR and CAS Genes Industry?
The market segments include Product, Application.
4. Can you provide details about the market size?
The market size is estimated to be USD XX Million as of 2022.
5. What are some drivers contributing to market growth?
Increasing Investment by Biotechnology Companies for Novel Therapeutics; Increasing Genomics Research and Development Activities and Funding; High Burden of Cancer and Other Diseases.
6. What are the notable trends driving market growth?
Genome Engineering Segment is Anticipated to Witness a Growth in the Market Over the Forecast Period.
7. Are there any restraints impacting market growth?
Off-target Effects Associated with the Implementation of CRISPR; High Cost and Ethical Concerns Associated with CRISPR Technology.
8. Can you provide examples of recent developments in the market?
December 2022: A researcher from the University of California sponsored a clinical trial under the title "Transplantation of Clustered Regularly Interspaced Short Palindromic Repeats Modified Hematopoietic Progenitor Stem Cells (CRISPR_SCD001) in Patients With Severe Sickle Cell Disease" to evaluate the hematopoietic stem cell transplantation (HSCT) using CRISPR/Cas9 edited red blood cells (known as CRISPR_SCD001 Drug Product).
9. What pricing options are available for accessing the report?
Pricing options include single-user, multi-user, and enterprise licenses priced at USD 4750, USD 5250, and USD 8750 respectively.
10. Is the market size provided in terms of value or volume?
The market size is provided in terms of value, measured in Million and volume, measured in K Unit.
11. Are there any specific market keywords associated with the report?
Yes, the market keyword associated with the report is "CRISPR and CAS Genes Industry," which aids in identifying and referencing the specific market segment covered.
12. How do I determine which pricing option suits my needs best?
The pricing options vary based on user requirements and access needs. Individual users may opt for single-user licenses, while businesses requiring broader access may choose multi-user or enterprise licenses for cost-effective access to the report.
13. Are there any additional resources or data provided in the CRISPR and CAS Genes Industry report?
While the report offers comprehensive insights, it's advisable to review the specific contents or supplementary materials provided to ascertain if additional resources or data are available.
14. How can I stay updated on further developments or reports in the CRISPR and CAS Genes Industry?
To stay informed about further developments, trends, and reports in the CRISPR and CAS Genes Industry, consider subscribing to industry newsletters, following relevant companies and organizations, or regularly checking reputable industry news sources and publications.
Methodology
Step 1 - Identification of Relevant Samples Size from Population Database


Step 2 - Approaches for Defining Global Market Size (Value, Volume* & Price*)

Note*: In applicable scenarios
Step 3 - Data Sources
Primary Research
- Web Analytics
- Survey Reports
- Research Institute
- Latest Research Reports
- Opinion Leaders
Secondary Research
- Annual Reports
- White Paper
- Latest Press Release
- Industry Association
- Paid Database
- Investor Presentations

Step 4 - Data Triangulation
Involves using different sources of information in order to increase the validity of a study
These sources are likely to be stakeholders in a program - participants, other researchers, program staff, other community members, and so on.
Then we put all data in single framework & apply various statistical tools to find out the dynamic on the market.
During the analysis stage, feedback from the stakeholder groups would be compared to determine areas of agreement as well as areas of divergence
