

Key Insights
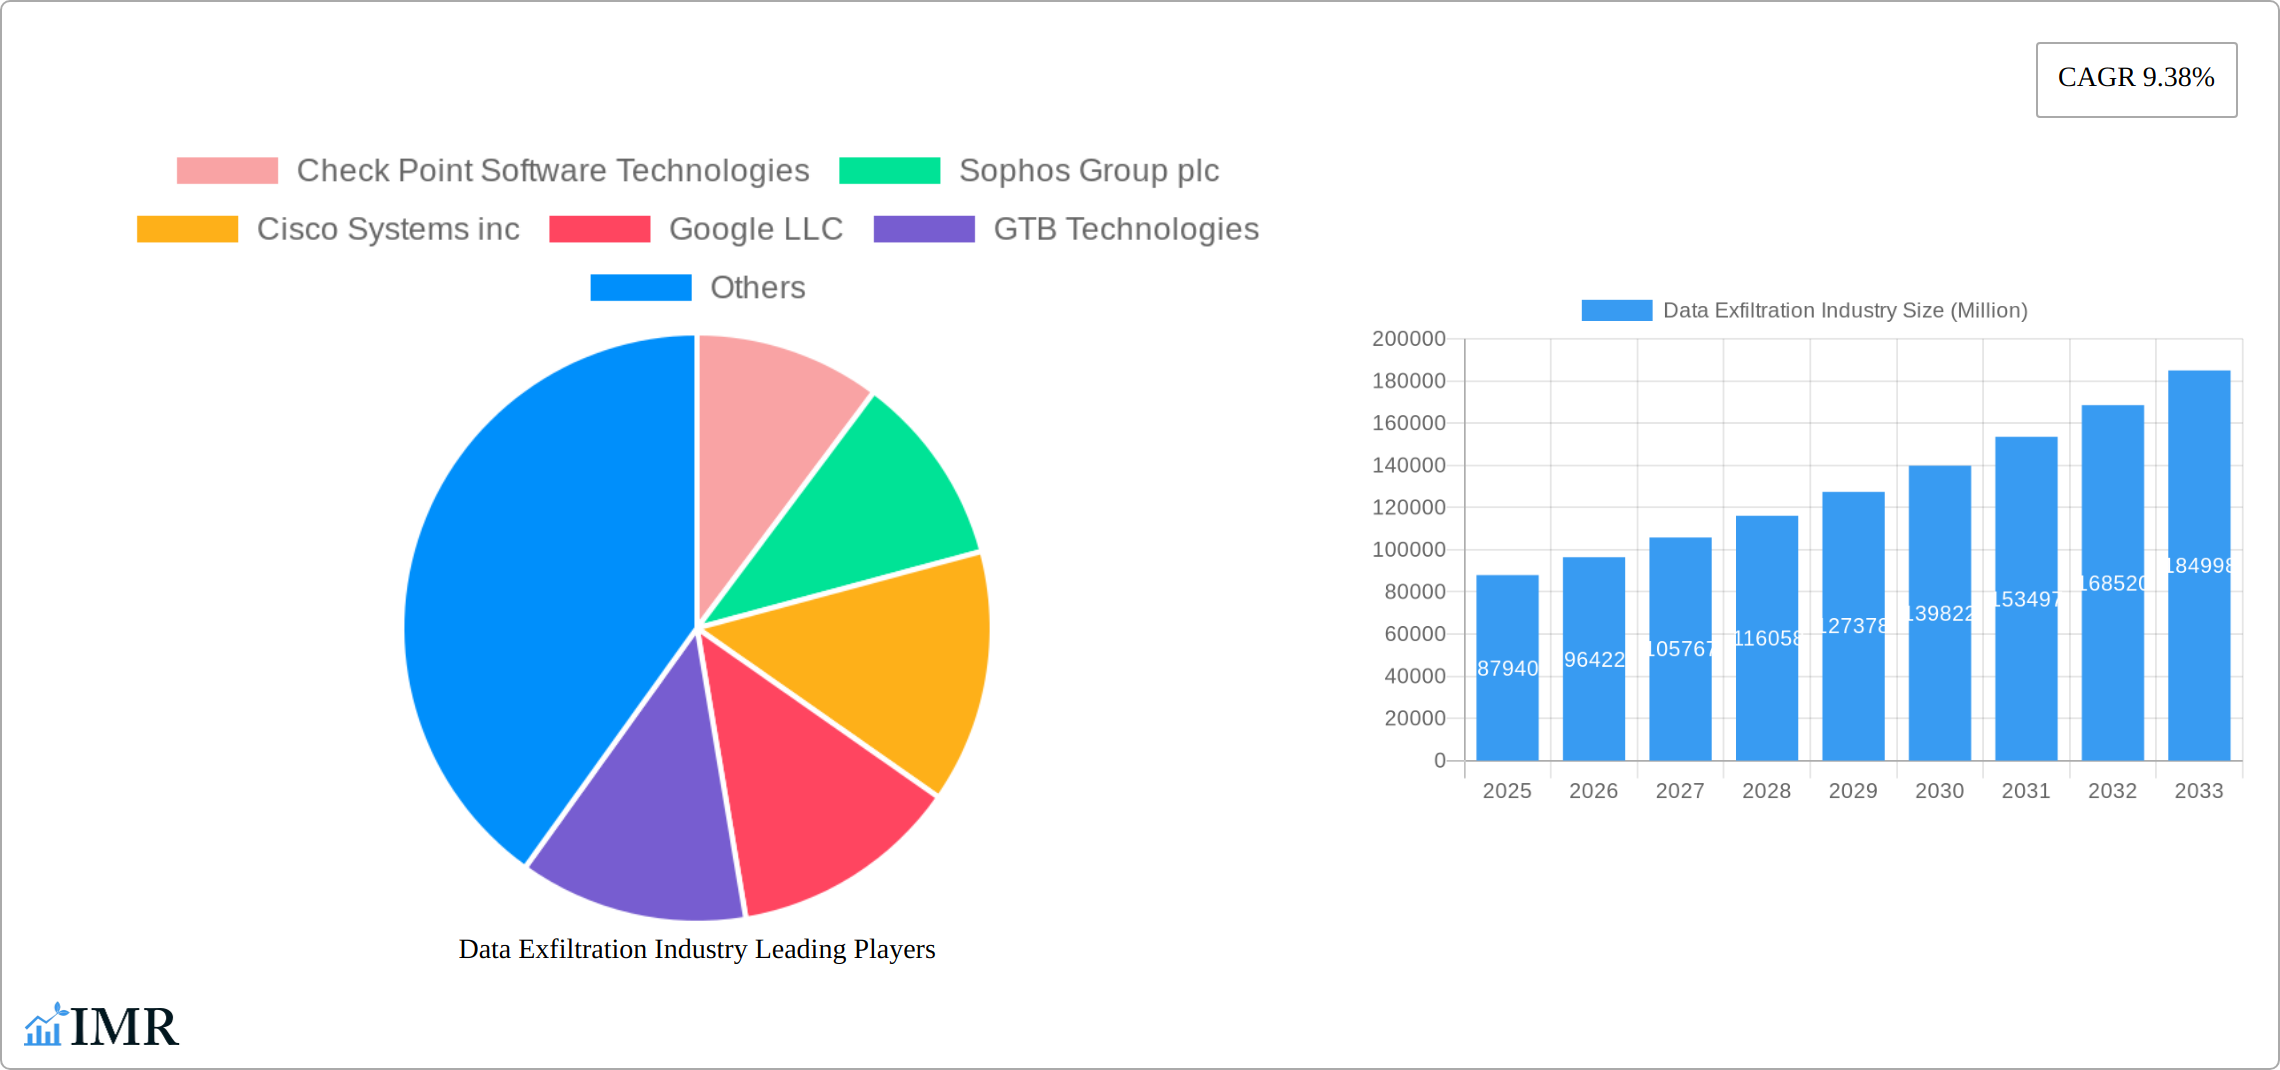
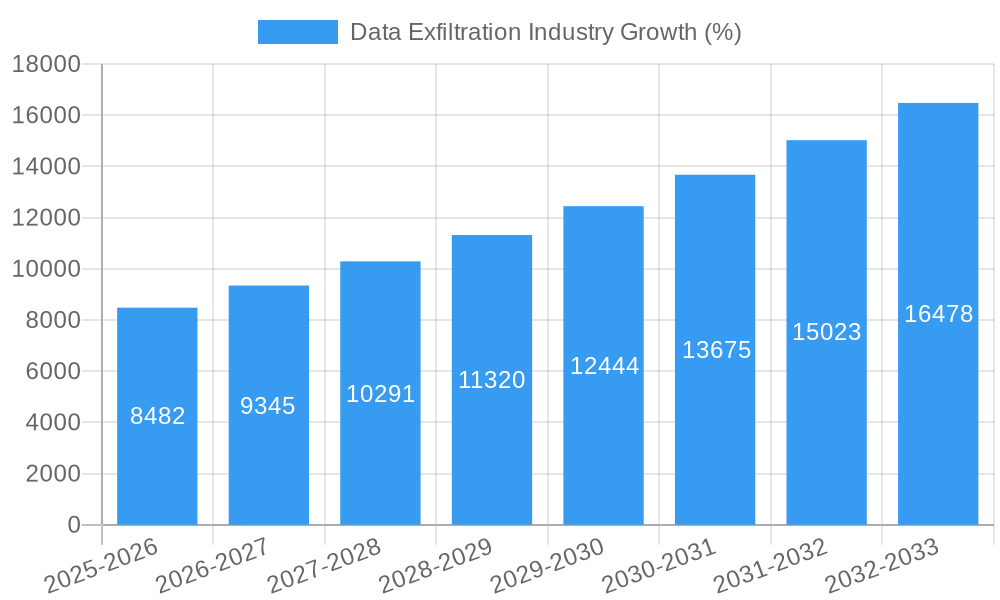
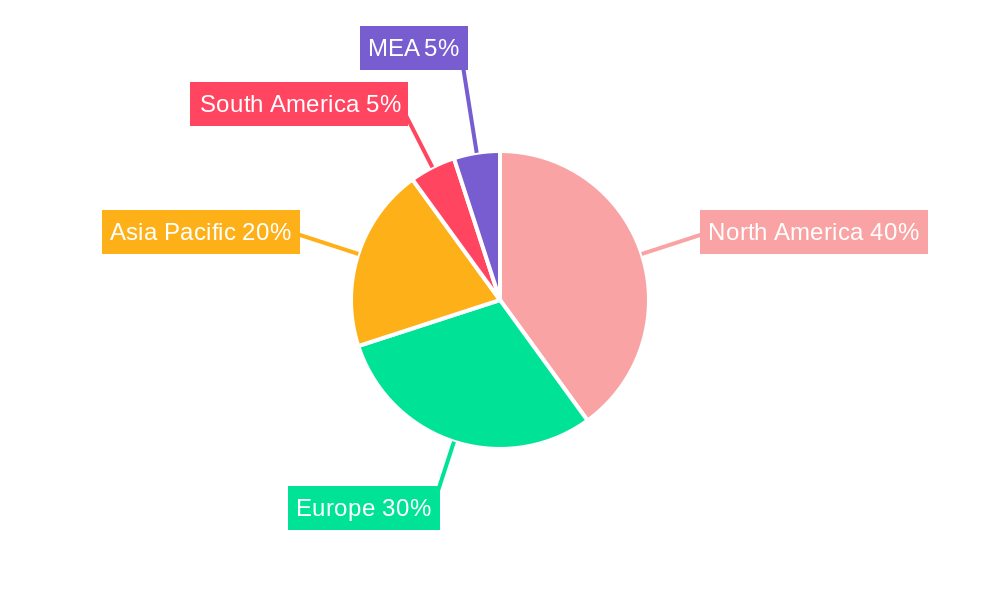
The global data exfiltration prevention market, currently valued at $87.94 billion in 2025, is projected to experience robust growth, exhibiting a Compound Annual Growth Rate (CAGR) of 9.38% from 2025 to 2033. This expansion is fueled by several key factors. The increasing frequency and sophistication of cyberattacks targeting sensitive data across various industries, coupled with stringent data privacy regulations like GDPR and CCPA, are driving significant investments in robust data exfiltration prevention solutions. The growing adoption of cloud computing and remote work models further expands the attack surface, necessitating advanced security measures. Market segmentation reveals strong demand across various sectors, including BFSI (Banking, Financial Services, and Insurance), IT and Telecom, Healthcare, and Government, with large enterprises leading the adoption of comprehensive solutions and services. The solutions segment, encompassing encryption, antivirus, firewalls, intrusion detection systems, and data loss prevention tools, constitutes a significant portion of the market, reflecting the diverse technological approaches required to combat data exfiltration. The services segment, including penetration testing, support and maintenance, and consulting, provides critical expertise in implementing and managing these security solutions effectively. Geographical distribution indicates substantial market presence in North America and Europe, with Asia-Pacific exhibiting significant growth potential due to increasing digitalization and expanding internet penetration.
Competition within the market is intense, with established players like Check Point, Sophos, Cisco, and McAfee alongside newer entrants constantly innovating. The market is characterized by a dynamic interplay of technological advancements, evolving threat landscapes, and regulatory pressures. Future growth will likely be shaped by the adoption of Artificial Intelligence (AI) and Machine Learning (ML) in threat detection and response, the increasing importance of zero trust security architectures, and the growing demand for integrated security solutions that provide comprehensive protection against data breaches. Expansion into emerging markets and the continuous development of advanced security technologies will further drive market expansion over the forecast period. The increasing awareness of the financial and reputational implications of data breaches is a crucial factor contributing to the sustained high demand for effective data exfiltration prevention measures.
This comprehensive report provides an in-depth analysis of the Data Exfiltration Industry, encompassing market dynamics, growth trends, regional dominance, product landscape, key players, and future outlook. The study period covers 2019-2033, with 2025 as the base and estimated year. The report segments the market by organization size (SMEs, Large Enterprises), component (Solutions, Services), and end-user vertical (BFSI, IT & Telecom, Healthcare, Government, Retail, Manufacturing, Others), offering granular insights for informed decision-making. The total market value is projected to reach xx Million by 2033.
Data Exfiltration Industry Market Dynamics & Structure
The Data Exfiltration Industry is characterized by a moderately concentrated market structure, with key players such as Check Point Software Technologies, Sophos Group plc, Cisco Systems Inc., and Palo Alto Networks holding significant market share. The market is witnessing rapid technological innovation, driven by the increasing sophistication of cyberattacks and the growing volume of sensitive data. Stringent regulatory frameworks like GDPR and CCPA are further shaping the landscape, compelling organizations to invest heavily in data protection solutions. The competitive landscape includes product substitutes like cloud-based security solutions and alternative data protection methods. The end-user demographic is expanding, encompassing businesses of all sizes across various industries. The industry has seen significant M&A activity in recent years, with xx deals recorded between 2019 and 2024, representing an average annual deal volume of xx. This consolidation reflects the increasing need for comprehensive security solutions.
- Market Concentration: Moderately concentrated, with top 5 players holding approximately xx% market share in 2024.
- Technological Innovation: Rapid advancements in AI, machine learning, and threat intelligence are driving innovation.
- Regulatory Frameworks: GDPR, CCPA, and other regulations are pushing adoption of robust data protection measures.
- Competitive Substitutes: Cloud-based security and alternative data protection methods pose competitive pressure.
- M&A Trends: Significant consolidation through mergers and acquisitions to expand market reach and capabilities.
- Innovation Barriers: High R&D costs, integration complexities, and the constant evolution of threats.
Data Exfiltration Industry Growth Trends & Insights
The Data Exfiltration Industry is experiencing robust growth, driven by the escalating frequency and severity of data breaches. The market size, valued at xx Million in 2024, is projected to expand at a CAGR of xx% during the forecast period (2025-2033), reaching xx Million by 2033. This growth is fueled by increased adoption of advanced data protection solutions, particularly in large enterprises and across sectors like BFSI and healthcare. Technological disruptions, such as the rise of IoT and cloud computing, are simultaneously expanding the attack surface and generating a demand for sophisticated solutions. Consumer behavior is shifting toward a greater awareness of data privacy and security, further stimulating market demand. Market penetration for advanced solutions like data loss prevention (DLP) and intrusion detection systems (IDS) is expected to grow from xx% in 2024 to xx% by 2033.
Dominant Regions, Countries, or Segments in Data Exfiltration Industry
North America currently dominates the Data Exfiltration Industry, holding the largest market share in 2024 at approximately xx%, driven by strong technological advancements, a high concentration of key players, and stringent data protection regulations. However, the Asia-Pacific region is expected to witness the fastest growth during the forecast period, with a projected CAGR of xx%, fueled by rapid digitalization, increasing adoption of cloud services, and rising government investments in cybersecurity infrastructure. Among market segments, the Large Enterprise segment holds the dominant position due to greater financial resources and higher sensitivity to data breaches. The Solutions component holds a larger market share compared to Services, driven by the increasing demand for advanced data protection technologies. The BFSI sector leads the end-user vertical segment, due to the strict regulations surrounding the protection of financial data.
- North America: Strong regulatory environment, high technology adoption, established player base.
- Asia-Pacific: Rapid digitalization, growing cloud adoption, government investments in cybersecurity.
- Large Enterprises: Higher budgets, greater awareness of risks associated with data exfiltration.
- Solutions Component: Increased demand for sophisticated data protection technologies.
- BFSI Vertical: Stringent regulatory compliance requirements.
Data Exfiltration Industry Product Landscape
The Data Exfiltration Industry offers a diverse range of products, including encryption solutions, antivirus software, firewalls, intrusion detection systems, data loss prevention (DLP) tools, and penetration testing services. Recent innovations focus on AI-powered threat detection, automated response mechanisms, and improved user experience. Key selling propositions include enhanced security, reduced breach risks, simplified management, and compliance with data protection regulations. Technological advancements are driving the development of more effective and efficient data exfiltration prevention techniques.
Key Drivers, Barriers & Challenges in Data Exfiltration Industry
Key Drivers: The increasing frequency and severity of data breaches, stringent data privacy regulations, growth of cloud computing and IoT, and rising awareness of cybersecurity risks are driving market growth.
Key Challenges: High implementation and maintenance costs, integration complexity with existing systems, skills gap in cybersecurity professionals, and the evolving nature of cyber threats pose significant challenges to market expansion. The average cost to remediate a data breach is estimated at xx Million.
Emerging Opportunities in Data Exfiltration Industry
Emerging opportunities include the expansion of data exfiltration solutions into untapped markets such as the automotive and energy sectors, the development of innovative applications like AI-powered threat hunting, the integration of blockchain technologies to enhance data security, and catering to the increasing demand for managed security services.
Growth Accelerators in the Data Exfiltration Industry Industry
Strategic partnerships between technology providers and cybersecurity consulting firms, government initiatives promoting cybersecurity awareness and investments in cybersecurity infrastructure, and technological breakthroughs such as improved encryption algorithms and advanced threat intelligence platforms are key accelerators for long-term market growth.
Key Players Shaping the Data Exfiltration Industry Market
- Check Point Software Technologies
- Sophos Group plc
- Cisco Systems Inc.
- Google LLC
- GTB Technologies
- McAfee LLC
- Zscaler
- 7 2 Investment Analysi
- Fortinet
- HP Inc.
- Juniper Networks
- NortonLifeLock
- Palo Alto Networks
- Barracuda Networks
- HackerOne Inc
Notable Milestones in Data Exfiltration Industry Sector
- August 2022: Code42 Software, Inc. partnered with Nullafi to enhance insider risk management and prevent data exfiltration.
- January 2023: EfficientIP launched a free DNS-based data exfiltration application for ethical hacking and vulnerability assessment.
In-Depth Data Exfiltration Industry Market Outlook
The Data Exfiltration Industry is poised for continued growth, driven by the ever-increasing sophistication of cyber threats and the growing reliance on digital technologies. Strategic investments in R&D, expansion into new markets, and the adoption of innovative technologies like AI and machine learning will be critical for success in this dynamic landscape. The future holds significant opportunities for players who can provide comprehensive, integrated, and user-friendly security solutions that address the evolving needs of businesses across diverse sectors.
Data Exfiltration Industry Segmentation
-
1. Organization Size
- 1.1. Small- and Medium-sized Enterprises (SMEs)
- 1.2. Large Enterprise
-
2. Component
- 2.1. Solution
- 2.2. Services
-
3. End-user Vertical
- 3.1. Banking, Financial Services, and Insurance (BFSI)
- 3.2. IT and Telecom
- 3.3. Healthcare and Life Sciences
- 3.4. Government and Defense
- 3.5. Retail and E-commerce
- 3.6. Manufacturing
- 3.7. Other End-user Verticals
Data Exfiltration Industry Segmentation By Geography
-
1. North America
- 1.1. United States
- 1.2. Canada
-
2. Europe
- 2.1. Germany
- 2.2. United Kingdom
- 2.3. France
- 2.4. Rest of Europe
-
3. Asia Pacific
- 3.1. India
- 3.2. China
- 3.3. Japan
- 3.4. Rest of Asia Pacific
-
4. Latin America
- 4.1. Brazil
- 4.2. Argentina
- 4.3. Rest of Latin America
-
5. Middle East and Africa
- 5.1. United Arab Emirates
- 5.2. Saudi Arabia
- 5.3. Rest of Middle East and Africa
Data Exfiltration Industry REPORT HIGHLIGHTS
| Aspects | Details |
|---|---|
| Study Period | 2019-2033 |
| Base Year | 2024 |
| Estimated Year | 2025 |
| Forecast Period | 2025-2033 |
| Historical Period | 2019-2024 |
| Growth Rate | CAGR of 9.38% from 2019-2033 |
| Segmentation |
|
Table of Contents
- 1. Introduction
- 1.1. Research Scope
- 1.2. Market Segmentation
- 1.3. Research Methodology
- 1.4. Definitions and Assumptions
- 2. Executive Summary
- 2.1. Introduction
- 3. Market Dynamics
- 3.1. Introduction
- 3.2. Market Drivers
- 3.2.1. Exponential Growth in the Volumes of Enterprise Data and the Need for Data Exfiltration Prevention Solutions; Strict Regulatory Requirements for Data Protection; Increasing Incidents of Data Loss in the On-Premises Environment
- 3.3. Market Restrains
- 3.3.1. Compatibility Issues Between On-premises Application and the Cloud Environment
- 3.4. Market Trends
- 3.4.1. Healthcare and Life Sciences End User Segment is Expected to Hold Significant Market Share
- 4. Market Factor Analysis
- 4.1. Porters Five Forces
- 4.2. Supply/Value Chain
- 4.3. PESTEL analysis
- 4.4. Market Entropy
- 4.5. Patent/Trademark Analysis
- 5. Global Data Exfiltration Industry Analysis, Insights and Forecast, 2019-2031
- 5.1. Market Analysis, Insights and Forecast - by Organization Size
- 5.1.1. Small- and Medium-sized Enterprises (SMEs)
- 5.1.2. Large Enterprise
- 5.2. Market Analysis, Insights and Forecast - by Component
- 5.2.1. Solution
- 5.2.2. Services
- 5.3. Market Analysis, Insights and Forecast - by End-user Vertical
- 5.3.1. Banking, Financial Services, and Insurance (BFSI)
- 5.3.2. IT and Telecom
- 5.3.3. Healthcare and Life Sciences
- 5.3.4. Government and Defense
- 5.3.5. Retail and E-commerce
- 5.3.6. Manufacturing
- 5.3.7. Other End-user Verticals
- 5.4. Market Analysis, Insights and Forecast - by Region
- 5.4.1. North America
- 5.4.2. Europe
- 5.4.3. Asia Pacific
- 5.4.4. Latin America
- 5.4.5. Middle East and Africa
- 5.1. Market Analysis, Insights and Forecast - by Organization Size
- 6. North America Data Exfiltration Industry Analysis, Insights and Forecast, 2019-2031
- 6.1. Market Analysis, Insights and Forecast - by Organization Size
- 6.1.1. Small- and Medium-sized Enterprises (SMEs)
- 6.1.2. Large Enterprise
- 6.2. Market Analysis, Insights and Forecast - by Component
- 6.2.1. Solution
- 6.2.2. Services
- 6.3. Market Analysis, Insights and Forecast - by End-user Vertical
- 6.3.1. Banking, Financial Services, and Insurance (BFSI)
- 6.3.2. IT and Telecom
- 6.3.3. Healthcare and Life Sciences
- 6.3.4. Government and Defense
- 6.3.5. Retail and E-commerce
- 6.3.6. Manufacturing
- 6.3.7. Other End-user Verticals
- 6.1. Market Analysis, Insights and Forecast - by Organization Size
- 7. Europe Data Exfiltration Industry Analysis, Insights and Forecast, 2019-2031
- 7.1. Market Analysis, Insights and Forecast - by Organization Size
- 7.1.1. Small- and Medium-sized Enterprises (SMEs)
- 7.1.2. Large Enterprise
- 7.2. Market Analysis, Insights and Forecast - by Component
- 7.2.1. Solution
- 7.2.2. Services
- 7.3. Market Analysis, Insights and Forecast - by End-user Vertical
- 7.3.1. Banking, Financial Services, and Insurance (BFSI)
- 7.3.2. IT and Telecom
- 7.3.3. Healthcare and Life Sciences
- 7.3.4. Government and Defense
- 7.3.5. Retail and E-commerce
- 7.3.6. Manufacturing
- 7.3.7. Other End-user Verticals
- 7.1. Market Analysis, Insights and Forecast - by Organization Size
- 8. Asia Pacific Data Exfiltration Industry Analysis, Insights and Forecast, 2019-2031
- 8.1. Market Analysis, Insights and Forecast - by Organization Size
- 8.1.1. Small- and Medium-sized Enterprises (SMEs)
- 8.1.2. Large Enterprise
- 8.2. Market Analysis, Insights and Forecast - by Component
- 8.2.1. Solution
- 8.2.2. Services
- 8.3. Market Analysis, Insights and Forecast - by End-user Vertical
- 8.3.1. Banking, Financial Services, and Insurance (BFSI)
- 8.3.2. IT and Telecom
- 8.3.3. Healthcare and Life Sciences
- 8.3.4. Government and Defense
- 8.3.5. Retail and E-commerce
- 8.3.6. Manufacturing
- 8.3.7. Other End-user Verticals
- 8.1. Market Analysis, Insights and Forecast - by Organization Size
- 9. Latin America Data Exfiltration Industry Analysis, Insights and Forecast, 2019-2031
- 9.1. Market Analysis, Insights and Forecast - by Organization Size
- 9.1.1. Small- and Medium-sized Enterprises (SMEs)
- 9.1.2. Large Enterprise
- 9.2. Market Analysis, Insights and Forecast - by Component
- 9.2.1. Solution
- 9.2.2. Services
- 9.3. Market Analysis, Insights and Forecast - by End-user Vertical
- 9.3.1. Banking, Financial Services, and Insurance (BFSI)
- 9.3.2. IT and Telecom
- 9.3.3. Healthcare and Life Sciences
- 9.3.4. Government and Defense
- 9.3.5. Retail and E-commerce
- 9.3.6. Manufacturing
- 9.3.7. Other End-user Verticals
- 9.1. Market Analysis, Insights and Forecast - by Organization Size
- 10. Middle East and Africa Data Exfiltration Industry Analysis, Insights and Forecast, 2019-2031
- 10.1. Market Analysis, Insights and Forecast - by Organization Size
- 10.1.1. Small- and Medium-sized Enterprises (SMEs)
- 10.1.2. Large Enterprise
- 10.2. Market Analysis, Insights and Forecast - by Component
- 10.2.1. Solution
- 10.2.2. Services
- 10.3. Market Analysis, Insights and Forecast - by End-user Vertical
- 10.3.1. Banking, Financial Services, and Insurance (BFSI)
- 10.3.2. IT and Telecom
- 10.3.3. Healthcare and Life Sciences
- 10.3.4. Government and Defense
- 10.3.5. Retail and E-commerce
- 10.3.6. Manufacturing
- 10.3.7. Other End-user Verticals
- 10.1. Market Analysis, Insights and Forecast - by Organization Size
- 11. North America Data Exfiltration Industry Analysis, Insights and Forecast, 2019-2031
- 11.1. Market Analysis, Insights and Forecast - By Country/Sub-region
- 11.1.1 United States
- 11.1.2 Canada
- 11.1.3 Mexico
- 12. Europe Data Exfiltration Industry Analysis, Insights and Forecast, 2019-2031
- 12.1. Market Analysis, Insights and Forecast - By Country/Sub-region
- 12.1.1 Germany
- 12.1.2 United Kingdom
- 12.1.3 France
- 12.1.4 Spain
- 12.1.5 Italy
- 12.1.6 Spain
- 12.1.7 Belgium
- 12.1.8 Netherland
- 12.1.9 Nordics
- 12.1.10 Rest of Europe
- 13. Asia Pacific Data Exfiltration Industry Analysis, Insights and Forecast, 2019-2031
- 13.1. Market Analysis, Insights and Forecast - By Country/Sub-region
- 13.1.1 China
- 13.1.2 Japan
- 13.1.3 India
- 13.1.4 South Korea
- 13.1.5 Southeast Asia
- 13.1.6 Australia
- 13.1.7 Indonesia
- 13.1.8 Phillipes
- 13.1.9 Singapore
- 13.1.10 Thailandc
- 13.1.11 Rest of Asia Pacific
- 14. South America Data Exfiltration Industry Analysis, Insights and Forecast, 2019-2031
- 14.1. Market Analysis, Insights and Forecast - By Country/Sub-region
- 14.1.1 Brazil
- 14.1.2 Argentina
- 14.1.3 Peru
- 14.1.4 Chile
- 14.1.5 Colombia
- 14.1.6 Ecuador
- 14.1.7 Venezuela
- 14.1.8 Rest of South America
- 15. North America Data Exfiltration Industry Analysis, Insights and Forecast, 2019-2031
- 15.1. Market Analysis, Insights and Forecast - By Country/Sub-region
- 15.1.1 United States
- 15.1.2 Canada
- 15.1.3 Mexico
- 16. MEA Data Exfiltration Industry Analysis, Insights and Forecast, 2019-2031
- 16.1. Market Analysis, Insights and Forecast - By Country/Sub-region
- 16.1.1 United Arab Emirates
- 16.1.2 Saudi Arabia
- 16.1.3 South Africa
- 16.1.4 Rest of Middle East and Africa
- 17. Competitive Analysis
- 17.1. Global Market Share Analysis 2024
- 17.2. Company Profiles
- 17.2.1 Check Point Software Technologies
- 17.2.1.1. Overview
- 17.2.1.2. Products
- 17.2.1.3. SWOT Analysis
- 17.2.1.4. Recent Developments
- 17.2.1.5. Financials (Based on Availability)
- 17.2.2 Sophos Group plc
- 17.2.2.1. Overview
- 17.2.2.2. Products
- 17.2.2.3. SWOT Analysis
- 17.2.2.4. Recent Developments
- 17.2.2.5. Financials (Based on Availability)
- 17.2.3 Cisco Systems inc
- 17.2.3.1. Overview
- 17.2.3.2. Products
- 17.2.3.3. SWOT Analysis
- 17.2.3.4. Recent Developments
- 17.2.3.5. Financials (Based on Availability)
- 17.2.4 Google LLC
- 17.2.4.1. Overview
- 17.2.4.2. Products
- 17.2.4.3. SWOT Analysis
- 17.2.4.4. Recent Developments
- 17.2.4.5. Financials (Based on Availability)
- 17.2.5 GTB Technologies
- 17.2.5.1. Overview
- 17.2.5.2. Products
- 17.2.5.3. SWOT Analysis
- 17.2.5.4. Recent Developments
- 17.2.5.5. Financials (Based on Availability)
- 17.2.6 McAfee LLC
- 17.2.6.1. Overview
- 17.2.6.2. Products
- 17.2.6.3. SWOT Analysis
- 17.2.6.4. Recent Developments
- 17.2.6.5. Financials (Based on Availability)
- 17.2.7 Zscaler*List Not Exhaustive 7 2 Investment Analysi
- 17.2.7.1. Overview
- 17.2.7.2. Products
- 17.2.7.3. SWOT Analysis
- 17.2.7.4. Recent Developments
- 17.2.7.5. Financials (Based on Availability)
- 17.2.8 Fortinet
- 17.2.8.1. Overview
- 17.2.8.2. Products
- 17.2.8.3. SWOT Analysis
- 17.2.8.4. Recent Developments
- 17.2.8.5. Financials (Based on Availability)
- 17.2.9 HP Inc
- 17.2.9.1. Overview
- 17.2.9.2. Products
- 17.2.9.3. SWOT Analysis
- 17.2.9.4. Recent Developments
- 17.2.9.5. Financials (Based on Availability)
- 17.2.10 Juniper Networks
- 17.2.10.1. Overview
- 17.2.10.2. Products
- 17.2.10.3. SWOT Analysis
- 17.2.10.4. Recent Developments
- 17.2.10.5. Financials (Based on Availability)
- 17.2.11 NortonLifeLock
- 17.2.11.1. Overview
- 17.2.11.2. Products
- 17.2.11.3. SWOT Analysis
- 17.2.11.4. Recent Developments
- 17.2.11.5. Financials (Based on Availability)
- 17.2.12 Palo Alto Networks
- 17.2.12.1. Overview
- 17.2.12.2. Products
- 17.2.12.3. SWOT Analysis
- 17.2.12.4. Recent Developments
- 17.2.12.5. Financials (Based on Availability)
- 17.2.13 Barracuda Networks
- 17.2.13.1. Overview
- 17.2.13.2. Products
- 17.2.13.3. SWOT Analysis
- 17.2.13.4. Recent Developments
- 17.2.13.5. Financials (Based on Availability)
- 17.2.14 Hackerone Inc
- 17.2.14.1. Overview
- 17.2.14.2. Products
- 17.2.14.3. SWOT Analysis
- 17.2.14.4. Recent Developments
- 17.2.14.5. Financials (Based on Availability)
- 17.2.1 Check Point Software Technologies
List of Figures
- Figure 1: Global Data Exfiltration Industry Revenue Breakdown (Million, %) by Region 2024 & 2032
- Figure 2: North America Data Exfiltration Industry Revenue (Million), by Country 2024 & 2032
- Figure 3: North America Data Exfiltration Industry Revenue Share (%), by Country 2024 & 2032
- Figure 4: Europe Data Exfiltration Industry Revenue (Million), by Country 2024 & 2032
- Figure 5: Europe Data Exfiltration Industry Revenue Share (%), by Country 2024 & 2032
- Figure 6: Asia Pacific Data Exfiltration Industry Revenue (Million), by Country 2024 & 2032
- Figure 7: Asia Pacific Data Exfiltration Industry Revenue Share (%), by Country 2024 & 2032
- Figure 8: South America Data Exfiltration Industry Revenue (Million), by Country 2024 & 2032
- Figure 9: South America Data Exfiltration Industry Revenue Share (%), by Country 2024 & 2032
- Figure 10: North America Data Exfiltration Industry Revenue (Million), by Country 2024 & 2032
- Figure 11: North America Data Exfiltration Industry Revenue Share (%), by Country 2024 & 2032
- Figure 12: MEA Data Exfiltration Industry Revenue (Million), by Country 2024 & 2032
- Figure 13: MEA Data Exfiltration Industry Revenue Share (%), by Country 2024 & 2032
- Figure 14: North America Data Exfiltration Industry Revenue (Million), by Organization Size 2024 & 2032
- Figure 15: North America Data Exfiltration Industry Revenue Share (%), by Organization Size 2024 & 2032
- Figure 16: North America Data Exfiltration Industry Revenue (Million), by Component 2024 & 2032
- Figure 17: North America Data Exfiltration Industry Revenue Share (%), by Component 2024 & 2032
- Figure 18: North America Data Exfiltration Industry Revenue (Million), by End-user Vertical 2024 & 2032
- Figure 19: North America Data Exfiltration Industry Revenue Share (%), by End-user Vertical 2024 & 2032
- Figure 20: North America Data Exfiltration Industry Revenue (Million), by Country 2024 & 2032
- Figure 21: North America Data Exfiltration Industry Revenue Share (%), by Country 2024 & 2032
- Figure 22: Europe Data Exfiltration Industry Revenue (Million), by Organization Size 2024 & 2032
- Figure 23: Europe Data Exfiltration Industry Revenue Share (%), by Organization Size 2024 & 2032
- Figure 24: Europe Data Exfiltration Industry Revenue (Million), by Component 2024 & 2032
- Figure 25: Europe Data Exfiltration Industry Revenue Share (%), by Component 2024 & 2032
- Figure 26: Europe Data Exfiltration Industry Revenue (Million), by End-user Vertical 2024 & 2032
- Figure 27: Europe Data Exfiltration Industry Revenue Share (%), by End-user Vertical 2024 & 2032
- Figure 28: Europe Data Exfiltration Industry Revenue (Million), by Country 2024 & 2032
- Figure 29: Europe Data Exfiltration Industry Revenue Share (%), by Country 2024 & 2032
- Figure 30: Asia Pacific Data Exfiltration Industry Revenue (Million), by Organization Size 2024 & 2032
- Figure 31: Asia Pacific Data Exfiltration Industry Revenue Share (%), by Organization Size 2024 & 2032
- Figure 32: Asia Pacific Data Exfiltration Industry Revenue (Million), by Component 2024 & 2032
- Figure 33: Asia Pacific Data Exfiltration Industry Revenue Share (%), by Component 2024 & 2032
- Figure 34: Asia Pacific Data Exfiltration Industry Revenue (Million), by End-user Vertical 2024 & 2032
- Figure 35: Asia Pacific Data Exfiltration Industry Revenue Share (%), by End-user Vertical 2024 & 2032
- Figure 36: Asia Pacific Data Exfiltration Industry Revenue (Million), by Country 2024 & 2032
- Figure 37: Asia Pacific Data Exfiltration Industry Revenue Share (%), by Country 2024 & 2032
- Figure 38: Latin America Data Exfiltration Industry Revenue (Million), by Organization Size 2024 & 2032
- Figure 39: Latin America Data Exfiltration Industry Revenue Share (%), by Organization Size 2024 & 2032
- Figure 40: Latin America Data Exfiltration Industry Revenue (Million), by Component 2024 & 2032
- Figure 41: Latin America Data Exfiltration Industry Revenue Share (%), by Component 2024 & 2032
- Figure 42: Latin America Data Exfiltration Industry Revenue (Million), by End-user Vertical 2024 & 2032
- Figure 43: Latin America Data Exfiltration Industry Revenue Share (%), by End-user Vertical 2024 & 2032
- Figure 44: Latin America Data Exfiltration Industry Revenue (Million), by Country 2024 & 2032
- Figure 45: Latin America Data Exfiltration Industry Revenue Share (%), by Country 2024 & 2032
- Figure 46: Middle East and Africa Data Exfiltration Industry Revenue (Million), by Organization Size 2024 & 2032
- Figure 47: Middle East and Africa Data Exfiltration Industry Revenue Share (%), by Organization Size 2024 & 2032
- Figure 48: Middle East and Africa Data Exfiltration Industry Revenue (Million), by Component 2024 & 2032
- Figure 49: Middle East and Africa Data Exfiltration Industry Revenue Share (%), by Component 2024 & 2032
- Figure 50: Middle East and Africa Data Exfiltration Industry Revenue (Million), by End-user Vertical 2024 & 2032
- Figure 51: Middle East and Africa Data Exfiltration Industry Revenue Share (%), by End-user Vertical 2024 & 2032
- Figure 52: Middle East and Africa Data Exfiltration Industry Revenue (Million), by Country 2024 & 2032
- Figure 53: Middle East and Africa Data Exfiltration Industry Revenue Share (%), by Country 2024 & 2032
List of Tables
- Table 1: Global Data Exfiltration Industry Revenue Million Forecast, by Region 2019 & 2032
- Table 2: Global Data Exfiltration Industry Revenue Million Forecast, by Organization Size 2019 & 2032
- Table 3: Global Data Exfiltration Industry Revenue Million Forecast, by Component 2019 & 2032
- Table 4: Global Data Exfiltration Industry Revenue Million Forecast, by End-user Vertical 2019 & 2032
- Table 5: Global Data Exfiltration Industry Revenue Million Forecast, by Region 2019 & 2032
- Table 6: Global Data Exfiltration Industry Revenue Million Forecast, by Country 2019 & 2032
- Table 7: United States Data Exfiltration Industry Revenue (Million) Forecast, by Application 2019 & 2032
- Table 8: Canada Data Exfiltration Industry Revenue (Million) Forecast, by Application 2019 & 2032
- Table 9: Mexico Data Exfiltration Industry Revenue (Million) Forecast, by Application 2019 & 2032
- Table 10: Global Data Exfiltration Industry Revenue Million Forecast, by Country 2019 & 2032
- Table 11: Germany Data Exfiltration Industry Revenue (Million) Forecast, by Application 2019 & 2032
- Table 12: United Kingdom Data Exfiltration Industry Revenue (Million) Forecast, by Application 2019 & 2032
- Table 13: France Data Exfiltration Industry Revenue (Million) Forecast, by Application 2019 & 2032
- Table 14: Spain Data Exfiltration Industry Revenue (Million) Forecast, by Application 2019 & 2032
- Table 15: Italy Data Exfiltration Industry Revenue (Million) Forecast, by Application 2019 & 2032
- Table 16: Spain Data Exfiltration Industry Revenue (Million) Forecast, by Application 2019 & 2032
- Table 17: Belgium Data Exfiltration Industry Revenue (Million) Forecast, by Application 2019 & 2032
- Table 18: Netherland Data Exfiltration Industry Revenue (Million) Forecast, by Application 2019 & 2032
- Table 19: Nordics Data Exfiltration Industry Revenue (Million) Forecast, by Application 2019 & 2032
- Table 20: Rest of Europe Data Exfiltration Industry Revenue (Million) Forecast, by Application 2019 & 2032
- Table 21: Global Data Exfiltration Industry Revenue Million Forecast, by Country 2019 & 2032
- Table 22: China Data Exfiltration Industry Revenue (Million) Forecast, by Application 2019 & 2032
- Table 23: Japan Data Exfiltration Industry Revenue (Million) Forecast, by Application 2019 & 2032
- Table 24: India Data Exfiltration Industry Revenue (Million) Forecast, by Application 2019 & 2032
- Table 25: South Korea Data Exfiltration Industry Revenue (Million) Forecast, by Application 2019 & 2032
- Table 26: Southeast Asia Data Exfiltration Industry Revenue (Million) Forecast, by Application 2019 & 2032
- Table 27: Australia Data Exfiltration Industry Revenue (Million) Forecast, by Application 2019 & 2032
- Table 28: Indonesia Data Exfiltration Industry Revenue (Million) Forecast, by Application 2019 & 2032
- Table 29: Phillipes Data Exfiltration Industry Revenue (Million) Forecast, by Application 2019 & 2032
- Table 30: Singapore Data Exfiltration Industry Revenue (Million) Forecast, by Application 2019 & 2032
- Table 31: Thailandc Data Exfiltration Industry Revenue (Million) Forecast, by Application 2019 & 2032
- Table 32: Rest of Asia Pacific Data Exfiltration Industry Revenue (Million) Forecast, by Application 2019 & 2032
- Table 33: Global Data Exfiltration Industry Revenue Million Forecast, by Country 2019 & 2032
- Table 34: Brazil Data Exfiltration Industry Revenue (Million) Forecast, by Application 2019 & 2032
- Table 35: Argentina Data Exfiltration Industry Revenue (Million) Forecast, by Application 2019 & 2032
- Table 36: Peru Data Exfiltration Industry Revenue (Million) Forecast, by Application 2019 & 2032
- Table 37: Chile Data Exfiltration Industry Revenue (Million) Forecast, by Application 2019 & 2032
- Table 38: Colombia Data Exfiltration Industry Revenue (Million) Forecast, by Application 2019 & 2032
- Table 39: Ecuador Data Exfiltration Industry Revenue (Million) Forecast, by Application 2019 & 2032
- Table 40: Venezuela Data Exfiltration Industry Revenue (Million) Forecast, by Application 2019 & 2032
- Table 41: Rest of South America Data Exfiltration Industry Revenue (Million) Forecast, by Application 2019 & 2032
- Table 42: Global Data Exfiltration Industry Revenue Million Forecast, by Country 2019 & 2032
- Table 43: United States Data Exfiltration Industry Revenue (Million) Forecast, by Application 2019 & 2032
- Table 44: Canada Data Exfiltration Industry Revenue (Million) Forecast, by Application 2019 & 2032
- Table 45: Mexico Data Exfiltration Industry Revenue (Million) Forecast, by Application 2019 & 2032
- Table 46: Global Data Exfiltration Industry Revenue Million Forecast, by Country 2019 & 2032
- Table 47: United Arab Emirates Data Exfiltration Industry Revenue (Million) Forecast, by Application 2019 & 2032
- Table 48: Saudi Arabia Data Exfiltration Industry Revenue (Million) Forecast, by Application 2019 & 2032
- Table 49: South Africa Data Exfiltration Industry Revenue (Million) Forecast, by Application 2019 & 2032
- Table 50: Rest of Middle East and Africa Data Exfiltration Industry Revenue (Million) Forecast, by Application 2019 & 2032
- Table 51: Global Data Exfiltration Industry Revenue Million Forecast, by Organization Size 2019 & 2032
- Table 52: Global Data Exfiltration Industry Revenue Million Forecast, by Component 2019 & 2032
- Table 53: Global Data Exfiltration Industry Revenue Million Forecast, by End-user Vertical 2019 & 2032
- Table 54: Global Data Exfiltration Industry Revenue Million Forecast, by Country 2019 & 2032
- Table 55: United States Data Exfiltration Industry Revenue (Million) Forecast, by Application 2019 & 2032
- Table 56: Canada Data Exfiltration Industry Revenue (Million) Forecast, by Application 2019 & 2032
- Table 57: Global Data Exfiltration Industry Revenue Million Forecast, by Organization Size 2019 & 2032
- Table 58: Global Data Exfiltration Industry Revenue Million Forecast, by Component 2019 & 2032
- Table 59: Global Data Exfiltration Industry Revenue Million Forecast, by End-user Vertical 2019 & 2032
- Table 60: Global Data Exfiltration Industry Revenue Million Forecast, by Country 2019 & 2032
- Table 61: Germany Data Exfiltration Industry Revenue (Million) Forecast, by Application 2019 & 2032
- Table 62: United Kingdom Data Exfiltration Industry Revenue (Million) Forecast, by Application 2019 & 2032
- Table 63: France Data Exfiltration Industry Revenue (Million) Forecast, by Application 2019 & 2032
- Table 64: Rest of Europe Data Exfiltration Industry Revenue (Million) Forecast, by Application 2019 & 2032
- Table 65: Global Data Exfiltration Industry Revenue Million Forecast, by Organization Size 2019 & 2032
- Table 66: Global Data Exfiltration Industry Revenue Million Forecast, by Component 2019 & 2032
- Table 67: Global Data Exfiltration Industry Revenue Million Forecast, by End-user Vertical 2019 & 2032
- Table 68: Global Data Exfiltration Industry Revenue Million Forecast, by Country 2019 & 2032
- Table 69: India Data Exfiltration Industry Revenue (Million) Forecast, by Application 2019 & 2032
- Table 70: China Data Exfiltration Industry Revenue (Million) Forecast, by Application 2019 & 2032
- Table 71: Japan Data Exfiltration Industry Revenue (Million) Forecast, by Application 2019 & 2032
- Table 72: Rest of Asia Pacific Data Exfiltration Industry Revenue (Million) Forecast, by Application 2019 & 2032
- Table 73: Global Data Exfiltration Industry Revenue Million Forecast, by Organization Size 2019 & 2032
- Table 74: Global Data Exfiltration Industry Revenue Million Forecast, by Component 2019 & 2032
- Table 75: Global Data Exfiltration Industry Revenue Million Forecast, by End-user Vertical 2019 & 2032
- Table 76: Global Data Exfiltration Industry Revenue Million Forecast, by Country 2019 & 2032
- Table 77: Brazil Data Exfiltration Industry Revenue (Million) Forecast, by Application 2019 & 2032
- Table 78: Argentina Data Exfiltration Industry Revenue (Million) Forecast, by Application 2019 & 2032
- Table 79: Rest of Latin America Data Exfiltration Industry Revenue (Million) Forecast, by Application 2019 & 2032
- Table 80: Global Data Exfiltration Industry Revenue Million Forecast, by Organization Size 2019 & 2032
- Table 81: Global Data Exfiltration Industry Revenue Million Forecast, by Component 2019 & 2032
- Table 82: Global Data Exfiltration Industry Revenue Million Forecast, by End-user Vertical 2019 & 2032
- Table 83: Global Data Exfiltration Industry Revenue Million Forecast, by Country 2019 & 2032
- Table 84: United Arab Emirates Data Exfiltration Industry Revenue (Million) Forecast, by Application 2019 & 2032
- Table 85: Saudi Arabia Data Exfiltration Industry Revenue (Million) Forecast, by Application 2019 & 2032
- Table 86: Rest of Middle East and Africa Data Exfiltration Industry Revenue (Million) Forecast, by Application 2019 & 2032
Frequently Asked Questions
1. What is the projected Compound Annual Growth Rate (CAGR) of the Data Exfiltration Industry?
The projected CAGR is approximately 9.38%.
2. Which companies are prominent players in the Data Exfiltration Industry?
Key companies in the market include Check Point Software Technologies, Sophos Group plc, Cisco Systems inc, Google LLC, GTB Technologies, McAfee LLC, Zscaler*List Not Exhaustive 7 2 Investment Analysi, Fortinet, HP Inc, Juniper Networks, NortonLifeLock, Palo Alto Networks, Barracuda Networks, Hackerone Inc.
3. What are the main segments of the Data Exfiltration Industry?
The market segments include Organization Size, Component, End-user Vertical.
4. Can you provide details about the market size?
The market size is estimated to be USD 87.94 Million as of 2022.
5. What are some drivers contributing to market growth?
Exponential Growth in the Volumes of Enterprise Data and the Need for Data Exfiltration Prevention Solutions; Strict Regulatory Requirements for Data Protection; Increasing Incidents of Data Loss in the On-Premises Environment.
6. What are the notable trends driving market growth?
Healthcare and Life Sciences End User Segment is Expected to Hold Significant Market Share.
7. Are there any restraints impacting market growth?
Compatibility Issues Between On-premises Application and the Cloud Environment.
8. Can you provide examples of recent developments in the market?
January 2023: EfficientIP, the DDI security and automation specialist (DNS, DHCP, IPAM), announced the availability of its new DNS-based Data Exfiltration Application to partners and organizations for free. The program is intended to be a hands-on online tool that allows enterprises to conduct their own 'ethical hack' on their DNS system and related security defenses to uncover potential network weaknesses that might lead to a data breach.
9. What pricing options are available for accessing the report?
Pricing options include single-user, multi-user, and enterprise licenses priced at USD 4750, USD 5250, and USD 8750 respectively.
10. Is the market size provided in terms of value or volume?
The market size is provided in terms of value, measured in Million.
11. Are there any specific market keywords associated with the report?
Yes, the market keyword associated with the report is "Data Exfiltration Industry," which aids in identifying and referencing the specific market segment covered.
12. How do I determine which pricing option suits my needs best?
The pricing options vary based on user requirements and access needs. Individual users may opt for single-user licenses, while businesses requiring broader access may choose multi-user or enterprise licenses for cost-effective access to the report.
13. Are there any additional resources or data provided in the Data Exfiltration Industry report?
While the report offers comprehensive insights, it's advisable to review the specific contents or supplementary materials provided to ascertain if additional resources or data are available.
14. How can I stay updated on further developments or reports in the Data Exfiltration Industry?
To stay informed about further developments, trends, and reports in the Data Exfiltration Industry, consider subscribing to industry newsletters, following relevant companies and organizations, or regularly checking reputable industry news sources and publications.
Methodology
Step 1 - Identification of Relevant Samples Size from Population Database


Step 2 - Approaches for Defining Global Market Size (Value, Volume* & Price*)

Note*: In applicable scenarios
Step 3 - Data Sources
Primary Research
- Web Analytics
- Survey Reports
- Research Institute
- Latest Research Reports
- Opinion Leaders
Secondary Research
- Annual Reports
- White Paper
- Latest Press Release
- Industry Association
- Paid Database
- Investor Presentations

Step 4 - Data Triangulation
Involves using different sources of information in order to increase the validity of a study
These sources are likely to be stakeholders in a program - participants, other researchers, program staff, other community members, and so on.
Then we put all data in single framework & apply various statistical tools to find out the dynamic on the market.
During the analysis stage, feedback from the stakeholder groups would be compared to determine areas of agreement as well as areas of divergence
