

Key Insights
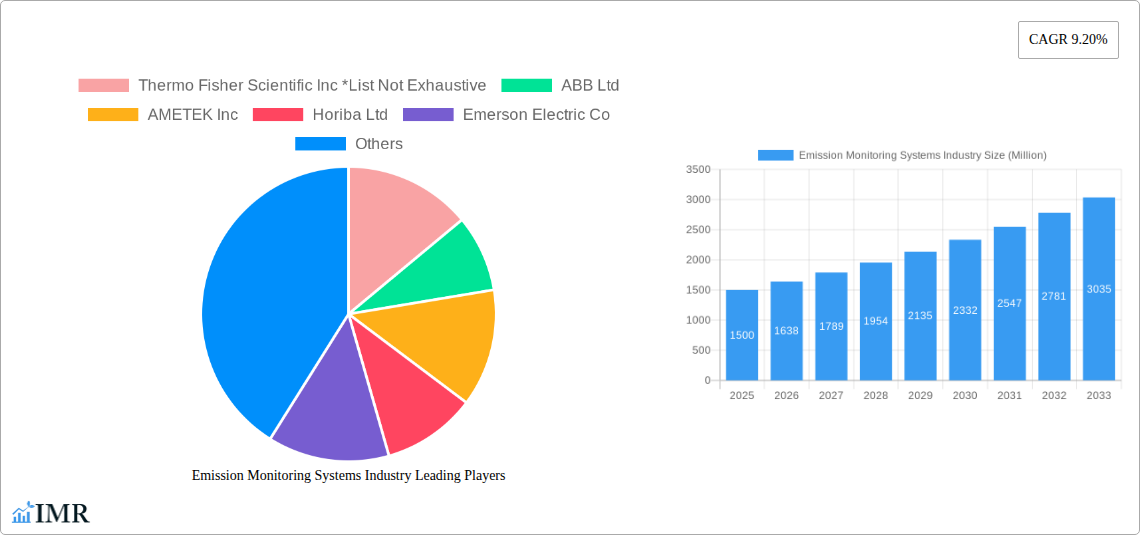
The Emission Monitoring Systems (EMS) market is experiencing robust growth, driven by stringent environmental regulations globally and the increasing need for industrial facilities to minimize their environmental impact. With a current market size estimated at $XX million in 2025 and a compound annual growth rate (CAGR) of 9.20%, the market is projected to reach a significant value by 2033. Key drivers include the escalating demand for cleaner energy sources, amplified focus on reducing greenhouse gas emissions, and the implementation of stricter emission standards across various industries, notably oil & gas, power generation, and chemicals. Technological advancements, such as the integration of advanced sensor technologies and AI-powered data analytics, further contribute to market expansion by enhancing monitoring accuracy and efficiency. The market is segmented by end-user (Oil & Gas, Metal & Mining, Pharmaceutical, Power Generation, Chemicals, Other End Users) and component (Hardware, Software, Services), each exhibiting unique growth trajectories. While the North American and European markets currently dominate, the Asia-Pacific region is anticipated to witness significant growth due to rapid industrialization and increasing environmental awareness. Despite these positive trends, challenges such as high initial investment costs for implementing EMS and the complexity of integrating diverse monitoring systems across large industrial facilities could potentially restrain market growth to some extent. However, the long-term outlook for the EMS market remains optimistic, fueled by sustained governmental support for environmental protection initiatives and increasing corporate social responsibility.
The competitive landscape is characterized by the presence of both established players like Thermo Fisher Scientific, ABB, and Siemens, and specialized technology providers. These companies are constantly innovating to offer advanced solutions and expand their market share. Strategic partnerships, acquisitions, and technological advancements are key strategies employed by market participants to enhance their market position and cater to the evolving needs of their clients. Future growth will likely be influenced by the development of more sustainable and cost-effective monitoring technologies, coupled with the increasing adoption of cloud-based data management and analytics solutions for real-time emission monitoring and reporting. The market's evolution will be closely tied to the trajectory of global environmental regulations and the overall pace of industrial growth across different regions. Furthermore, the ongoing development of standardized emission reporting protocols will likely further facilitate market expansion.
Emission Monitoring Systems Industry Market Report: 2019-2033
This comprehensive report provides an in-depth analysis of the Emission Monitoring Systems market, encompassing market dynamics, growth trends, regional segmentation, product landscape, key players, and future outlook. The study period covers 2019-2033, with a base year of 2025 and a forecast period of 2025-2033. The report analyzes the parent market of Environmental Monitoring and the child market of Emission Monitoring Systems, providing granular insights for informed decision-making. Market size is presented in million units.
Emission Monitoring Systems Industry Market Dynamics & Structure
The Emission Monitoring Systems market is characterized by a moderately concentrated landscape, with key players like Thermo Fisher Scientific Inc, ABB Ltd, AMETEK Inc, Horiba Ltd, Emerson Electric Co, Siemens AG, Sick AG, Rockwell Automation Inc, General Electric Company, and Teledyne Technologies Inc holding significant market share. Market concentration is estimated at xx% in 2025. Technological innovation, driven by stricter environmental regulations and the increasing need for accurate emissions data, is a key growth driver. Regulatory frameworks, such as the EU's Emissions Trading System (ETS) and similar initiatives globally, are compelling businesses to adopt emission monitoring solutions. The market also faces competition from alternative methods of emissions monitoring, though these are often less precise or comprehensive. M&A activity in the sector has been moderate, with xx deals recorded in the past five years, reflecting a strategic consolidation trend amongst industry participants.
- Market Concentration: xx% (2025 Estimate)
- Key Innovation Drivers: Stringent environmental regulations, demand for precise emission data, advancements in sensor technology.
- Regulatory Landscape: EU ETS, other regional emission regulations, evolving international standards.
- Competitive Substitutes: Less precise or less comprehensive alternative monitoring methods.
- M&A Activity: xx deals (2020-2024).
- End-User Demographics: Shifting towards increased adoption across various sectors, particularly Oil & Gas and Power Generation.
Emission Monitoring Systems Industry Growth Trends & Insights
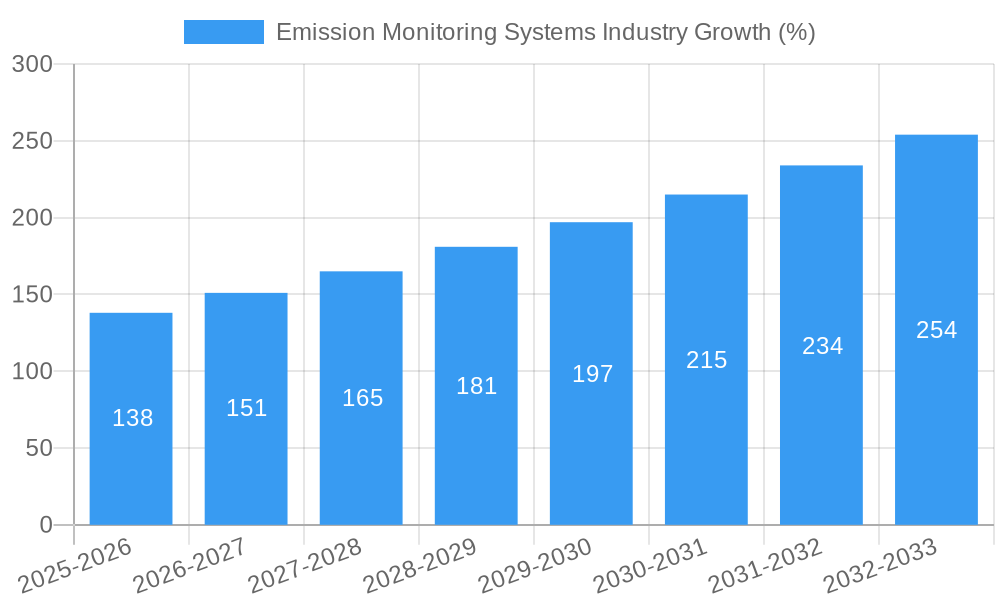
The Emission Monitoring Systems market is experiencing robust growth, driven by increasing environmental awareness, stricter emission regulations, and the growing need for accurate emissions data across diverse industries. The market size expanded from xx million units in 2019 to xx million units in 2024, with a projected CAGR of xx% during the forecast period (2025-2033). This growth is fueled by technological advancements, including the development of more precise and cost-effective sensors and analytical tools. Furthermore, the increasing adoption of digital technologies and data analytics is improving the efficiency and effectiveness of emission monitoring systems, creating new opportunities for growth. Consumer behavior is shifting towards greater environmental consciousness, demanding greater transparency and accountability from businesses regarding their environmental impact.
Market penetration within key end-user sectors is expected to significantly increase, particularly in developing economies, as environmental regulations become more stringent and industrialization accelerates. The adoption rate of advanced emission monitoring technologies is also anticipated to rise as costs decline and technological capabilities improve. Disruptive technologies, such as AI-powered predictive analytics and IoT-enabled remote monitoring, are poised to transform the industry.
Dominant Regions, Countries, or Segments in Emission Monitoring Systems Industry
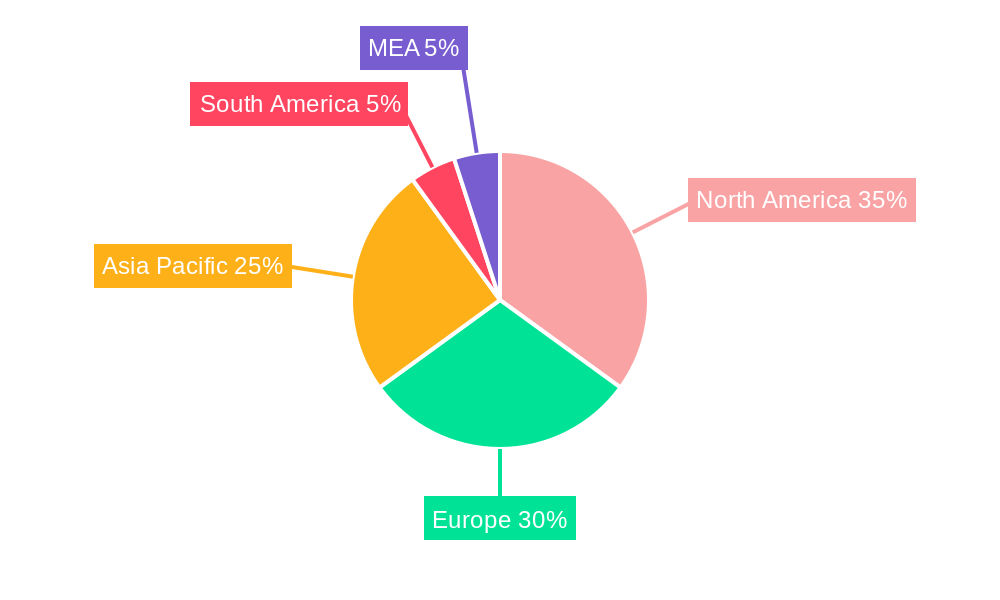
The Oil & Gas and Power Generation sectors are the dominant end-users, accounting for xx% and xx% of the market share, respectively, in 2025. North America and Europe currently represent the largest regional markets, driven by stringent environmental regulations and significant investments in renewable energy infrastructure. However, the Asia-Pacific region is projected to experience the fastest growth during the forecast period, fueled by rapid industrialization and increasing environmental concerns.
- Dominant End-Users: Oil & Gas (xx%), Power Generation (xx%).
- Leading Regions: North America, Europe (High Market Maturity).
- Fastest-Growing Region: Asia-Pacific (High Growth Potential).
- Key Drivers: Stringent environmental regulations, government incentives for emission reduction, increasing investments in renewable energy infrastructure.
Emission Monitoring Systems Industry Product Landscape
The emission monitoring systems market offers a range of products, from standalone hardware devices to sophisticated software platforms that integrate data from multiple sources. Recent innovations have focused on improving sensor accuracy, reducing operational costs, and enhancing data analytics capabilities. This includes the integration of AI and machine learning to provide real-time insights and predictive maintenance capabilities. Key selling propositions include improved accuracy, reduced operational costs, real-time monitoring capabilities, data analytics features, and compliance with industry regulations.
Key Drivers, Barriers & Challenges in Emission Monitoring Systems Industry
Key Drivers:
- Increasingly stringent environmental regulations globally.
- Growing demand for accurate and reliable emissions data.
- Technological advancements, such as IoT and AI-powered analytics.
- Rising investments in renewable energy and sustainable practices.
Challenges & Restraints:
- High initial investment costs for advanced systems.
- Complexity in implementing and integrating systems across diverse operations.
- Data security and privacy concerns.
- Potential supply chain disruptions affecting sensor and component availability.
Emerging Opportunities in Emission Monitoring Systems Industry
Emerging opportunities lie in the development of more sophisticated emission monitoring solutions that can integrate data from multiple sources to provide a holistic view of emissions. The integration of AI and machine learning will play a pivotal role in improving the accuracy and efficiency of emission monitoring systems. Untapped markets include small and medium-sized enterprises (SMEs) and developing economies. Expanding into these markets, offering cost-effective and user-friendly solutions, presents a significant growth potential. The growth of the carbon credit market and the increasing demand for carbon accounting services create lucrative opportunities for emission monitoring companies.
Growth Accelerators in the Emission Monitoring Systems Industry
Long-term growth will be fueled by continuous technological innovation, particularly in the development of more precise, cost-effective, and user-friendly emission monitoring solutions. Strategic partnerships between technology providers and end-users will play a critical role in accelerating market adoption. Expanding into new markets and developing tailored solutions for specific industries are essential for sustained growth.
Key Players Shaping the Emission Monitoring Systems Market
- Thermo Fisher Scientific Inc
- ABB Ltd
- AMETEK Inc
- Horiba Ltd
- Emerson Electric Co
- Siemens AG
- Sick AG
- Rockwell Automation Inc
- General Electric Company
- Teledyne Technologies Inc
Notable Milestones in Emission Monitoring Systems Industry Sector
- March 2022: Google-backed Normative launches a free carbon emissions tracker for small businesses.
- April 2022: ClassNK launches 'ClassNK ZETA,' a GHG emissions management tool for accurate CO2 emission tracking and CII rating simulation.
In-Depth Emission Monitoring Systems Industry Market Outlook
The Emission Monitoring Systems market is poised for sustained growth driven by technological advancements, increasingly stringent regulations, and a rising awareness of environmental sustainability. The market will be shaped by the integration of AI and IoT, the development of cost-effective solutions for SMEs, and the expansion into emerging economies. Strategic partnerships and the development of comprehensive data analytics platforms will create significant opportunities for market leaders. The long-term outlook remains positive, with significant potential for market expansion and innovation.
Emission Monitoring Systems Industry Segmentation
-
1. Component
- 1.1. Hardware
- 1.2. Software
- 1.3. Service
-
2. End User
- 2.1. Oil & Gas
- 2.2. Metal and Mining
- 2.3. Pharmaceutical
- 2.4. Power Generation
- 2.5. Chemicals
- 2.6. Other End Users
Emission Monitoring Systems Industry Segmentation By Geography
- 1. North America
- 2. Europe
- 3. Asia Pacific
- 4. Latin America
- 5. Middle East and Africa
Emission Monitoring Systems Industry REPORT HIGHLIGHTS
| Aspects | Details |
|---|---|
| Study Period | 2019-2033 |
| Base Year | 2024 |
| Estimated Year | 2025 |
| Forecast Period | 2025-2033 |
| Historical Period | 2019-2024 |
| Growth Rate | CAGR of 9.20% from 2019-2033 |
| Segmentation |
|
Table of Contents
- 1. Introduction
- 1.1. Research Scope
- 1.2. Market Segmentation
- 1.3. Research Methodology
- 1.4. Definitions and Assumptions
- 2. Executive Summary
- 2.1. Introduction
- 3. Market Dynamics
- 3.1. Introduction
- 3.2. Market Drivers
- 3.2.1. Stringent Legal and Environmental Regulations; Increasing Health and Safety Issues
- 3.3. Market Restrains
- 3.3.1. High Cost of These Systems for Regular Maintenance
- 3.4. Market Trends
- 3.4.1. Oil & Gas Segment is Expected to Witness Significant Growth
- 4. Market Factor Analysis
- 4.1. Porters Five Forces
- 4.2. Supply/Value Chain
- 4.3. PESTEL analysis
- 4.4. Market Entropy
- 4.5. Patent/Trademark Analysis
- 5. Global Emission Monitoring Systems Industry Analysis, Insights and Forecast, 2019-2031
- 5.1. Market Analysis, Insights and Forecast - by Component
- 5.1.1. Hardware
- 5.1.2. Software
- 5.1.3. Service
- 5.2. Market Analysis, Insights and Forecast - by End User
- 5.2.1. Oil & Gas
- 5.2.2. Metal and Mining
- 5.2.3. Pharmaceutical
- 5.2.4. Power Generation
- 5.2.5. Chemicals
- 5.2.6. Other End Users
- 5.3. Market Analysis, Insights and Forecast - by Region
- 5.3.1. North America
- 5.3.2. Europe
- 5.3.3. Asia Pacific
- 5.3.4. Latin America
- 5.3.5. Middle East and Africa
- 5.1. Market Analysis, Insights and Forecast - by Component
- 6. North America Emission Monitoring Systems Industry Analysis, Insights and Forecast, 2019-2031
- 6.1. Market Analysis, Insights and Forecast - by Component
- 6.1.1. Hardware
- 6.1.2. Software
- 6.1.3. Service
- 6.2. Market Analysis, Insights and Forecast - by End User
- 6.2.1. Oil & Gas
- 6.2.2. Metal and Mining
- 6.2.3. Pharmaceutical
- 6.2.4. Power Generation
- 6.2.5. Chemicals
- 6.2.6. Other End Users
- 6.1. Market Analysis, Insights and Forecast - by Component
- 7. Europe Emission Monitoring Systems Industry Analysis, Insights and Forecast, 2019-2031
- 7.1. Market Analysis, Insights and Forecast - by Component
- 7.1.1. Hardware
- 7.1.2. Software
- 7.1.3. Service
- 7.2. Market Analysis, Insights and Forecast - by End User
- 7.2.1. Oil & Gas
- 7.2.2. Metal and Mining
- 7.2.3. Pharmaceutical
- 7.2.4. Power Generation
- 7.2.5. Chemicals
- 7.2.6. Other End Users
- 7.1. Market Analysis, Insights and Forecast - by Component
- 8. Asia Pacific Emission Monitoring Systems Industry Analysis, Insights and Forecast, 2019-2031
- 8.1. Market Analysis, Insights and Forecast - by Component
- 8.1.1. Hardware
- 8.1.2. Software
- 8.1.3. Service
- 8.2. Market Analysis, Insights and Forecast - by End User
- 8.2.1. Oil & Gas
- 8.2.2. Metal and Mining
- 8.2.3. Pharmaceutical
- 8.2.4. Power Generation
- 8.2.5. Chemicals
- 8.2.6. Other End Users
- 8.1. Market Analysis, Insights and Forecast - by Component
- 9. Latin America Emission Monitoring Systems Industry Analysis, Insights and Forecast, 2019-2031
- 9.1. Market Analysis, Insights and Forecast - by Component
- 9.1.1. Hardware
- 9.1.2. Software
- 9.1.3. Service
- 9.2. Market Analysis, Insights and Forecast - by End User
- 9.2.1. Oil & Gas
- 9.2.2. Metal and Mining
- 9.2.3. Pharmaceutical
- 9.2.4. Power Generation
- 9.2.5. Chemicals
- 9.2.6. Other End Users
- 9.1. Market Analysis, Insights and Forecast - by Component
- 10. Middle East and Africa Emission Monitoring Systems Industry Analysis, Insights and Forecast, 2019-2031
- 10.1. Market Analysis, Insights and Forecast - by Component
- 10.1.1. Hardware
- 10.1.2. Software
- 10.1.3. Service
- 10.2. Market Analysis, Insights and Forecast - by End User
- 10.2.1. Oil & Gas
- 10.2.2. Metal and Mining
- 10.2.3. Pharmaceutical
- 10.2.4. Power Generation
- 10.2.5. Chemicals
- 10.2.6. Other End Users
- 10.1. Market Analysis, Insights and Forecast - by Component
- 11. North America Emission Monitoring Systems Industry Analysis, Insights and Forecast, 2019-2031
- 11.1. Market Analysis, Insights and Forecast - By Country/Sub-region
- 11.1.1 United States
- 11.1.2 Canada
- 11.1.3 Mexico
- 12. Europe Emission Monitoring Systems Industry Analysis, Insights and Forecast, 2019-2031
- 12.1. Market Analysis, Insights and Forecast - By Country/Sub-region
- 12.1.1 Germany
- 12.1.2 United Kingdom
- 12.1.3 France
- 12.1.4 Spain
- 12.1.5 Italy
- 12.1.6 Spain
- 12.1.7 Belgium
- 12.1.8 Netherland
- 12.1.9 Nordics
- 12.1.10 Rest of Europe
- 13. Asia Pacific Emission Monitoring Systems Industry Analysis, Insights and Forecast, 2019-2031
- 13.1. Market Analysis, Insights and Forecast - By Country/Sub-region
- 13.1.1 China
- 13.1.2 Japan
- 13.1.3 India
- 13.1.4 South Korea
- 13.1.5 Southeast Asia
- 13.1.6 Australia
- 13.1.7 Indonesia
- 13.1.8 Phillipes
- 13.1.9 Singapore
- 13.1.10 Thailandc
- 13.1.11 Rest of Asia Pacific
- 14. South America Emission Monitoring Systems Industry Analysis, Insights and Forecast, 2019-2031
- 14.1. Market Analysis, Insights and Forecast - By Country/Sub-region
- 14.1.1 Brazil
- 14.1.2 Argentina
- 14.1.3 Peru
- 14.1.4 Chile
- 14.1.5 Colombia
- 14.1.6 Ecuador
- 14.1.7 Venezuela
- 14.1.8 Rest of South America
- 15. North America Emission Monitoring Systems Industry Analysis, Insights and Forecast, 2019-2031
- 15.1. Market Analysis, Insights and Forecast - By Country/Sub-region
- 15.1.1 United States
- 15.1.2 Canada
- 15.1.3 Mexico
- 16. MEA Emission Monitoring Systems Industry Analysis, Insights and Forecast, 2019-2031
- 16.1. Market Analysis, Insights and Forecast - By Country/Sub-region
- 16.1.1 United Arab Emirates
- 16.1.2 Saudi Arabia
- 16.1.3 South Africa
- 16.1.4 Rest of Middle East and Africa
- 17. Competitive Analysis
- 17.1. Global Market Share Analysis 2024
- 17.2. Company Profiles
- 17.2.1 Thermo Fisher Scientific Inc *List Not Exhaustive
- 17.2.1.1. Overview
- 17.2.1.2. Products
- 17.2.1.3. SWOT Analysis
- 17.2.1.4. Recent Developments
- 17.2.1.5. Financials (Based on Availability)
- 17.2.2 ABB Ltd
- 17.2.2.1. Overview
- 17.2.2.2. Products
- 17.2.2.3. SWOT Analysis
- 17.2.2.4. Recent Developments
- 17.2.2.5. Financials (Based on Availability)
- 17.2.3 AMETEK Inc
- 17.2.3.1. Overview
- 17.2.3.2. Products
- 17.2.3.3. SWOT Analysis
- 17.2.3.4. Recent Developments
- 17.2.3.5. Financials (Based on Availability)
- 17.2.4 Horiba Ltd
- 17.2.4.1. Overview
- 17.2.4.2. Products
- 17.2.4.3. SWOT Analysis
- 17.2.4.4. Recent Developments
- 17.2.4.5. Financials (Based on Availability)
- 17.2.5 Emerson Electric Co
- 17.2.5.1. Overview
- 17.2.5.2. Products
- 17.2.5.3. SWOT Analysis
- 17.2.5.4. Recent Developments
- 17.2.5.5. Financials (Based on Availability)
- 17.2.6 Siemens AG
- 17.2.6.1. Overview
- 17.2.6.2. Products
- 17.2.6.3. SWOT Analysis
- 17.2.6.4. Recent Developments
- 17.2.6.5. Financials (Based on Availability)
- 17.2.7 Sick AG
- 17.2.7.1. Overview
- 17.2.7.2. Products
- 17.2.7.3. SWOT Analysis
- 17.2.7.4. Recent Developments
- 17.2.7.5. Financials (Based on Availability)
- 17.2.8 Rockwell Automation Inc
- 17.2.8.1. Overview
- 17.2.8.2. Products
- 17.2.8.3. SWOT Analysis
- 17.2.8.4. Recent Developments
- 17.2.8.5. Financials (Based on Availability)
- 17.2.9 General Electric Company
- 17.2.9.1. Overview
- 17.2.9.2. Products
- 17.2.9.3. SWOT Analysis
- 17.2.9.4. Recent Developments
- 17.2.9.5. Financials (Based on Availability)
- 17.2.10 Teledyne Technologies Inc
- 17.2.10.1. Overview
- 17.2.10.2. Products
- 17.2.10.3. SWOT Analysis
- 17.2.10.4. Recent Developments
- 17.2.10.5. Financials (Based on Availability)
- 17.2.1 Thermo Fisher Scientific Inc *List Not Exhaustive
List of Figures
- Figure 1: Global Emission Monitoring Systems Industry Revenue Breakdown (Million, %) by Region 2024 & 2032
- Figure 2: North America Emission Monitoring Systems Industry Revenue (Million), by Country 2024 & 2032
- Figure 3: North America Emission Monitoring Systems Industry Revenue Share (%), by Country 2024 & 2032
- Figure 4: Europe Emission Monitoring Systems Industry Revenue (Million), by Country 2024 & 2032
- Figure 5: Europe Emission Monitoring Systems Industry Revenue Share (%), by Country 2024 & 2032
- Figure 6: Asia Pacific Emission Monitoring Systems Industry Revenue (Million), by Country 2024 & 2032
- Figure 7: Asia Pacific Emission Monitoring Systems Industry Revenue Share (%), by Country 2024 & 2032
- Figure 8: South America Emission Monitoring Systems Industry Revenue (Million), by Country 2024 & 2032
- Figure 9: South America Emission Monitoring Systems Industry Revenue Share (%), by Country 2024 & 2032
- Figure 10: North America Emission Monitoring Systems Industry Revenue (Million), by Country 2024 & 2032
- Figure 11: North America Emission Monitoring Systems Industry Revenue Share (%), by Country 2024 & 2032
- Figure 12: MEA Emission Monitoring Systems Industry Revenue (Million), by Country 2024 & 2032
- Figure 13: MEA Emission Monitoring Systems Industry Revenue Share (%), by Country 2024 & 2032
- Figure 14: North America Emission Monitoring Systems Industry Revenue (Million), by Component 2024 & 2032
- Figure 15: North America Emission Monitoring Systems Industry Revenue Share (%), by Component 2024 & 2032
- Figure 16: North America Emission Monitoring Systems Industry Revenue (Million), by End User 2024 & 2032
- Figure 17: North America Emission Monitoring Systems Industry Revenue Share (%), by End User 2024 & 2032
- Figure 18: North America Emission Monitoring Systems Industry Revenue (Million), by Country 2024 & 2032
- Figure 19: North America Emission Monitoring Systems Industry Revenue Share (%), by Country 2024 & 2032
- Figure 20: Europe Emission Monitoring Systems Industry Revenue (Million), by Component 2024 & 2032
- Figure 21: Europe Emission Monitoring Systems Industry Revenue Share (%), by Component 2024 & 2032
- Figure 22: Europe Emission Monitoring Systems Industry Revenue (Million), by End User 2024 & 2032
- Figure 23: Europe Emission Monitoring Systems Industry Revenue Share (%), by End User 2024 & 2032
- Figure 24: Europe Emission Monitoring Systems Industry Revenue (Million), by Country 2024 & 2032
- Figure 25: Europe Emission Monitoring Systems Industry Revenue Share (%), by Country 2024 & 2032
- Figure 26: Asia Pacific Emission Monitoring Systems Industry Revenue (Million), by Component 2024 & 2032
- Figure 27: Asia Pacific Emission Monitoring Systems Industry Revenue Share (%), by Component 2024 & 2032
- Figure 28: Asia Pacific Emission Monitoring Systems Industry Revenue (Million), by End User 2024 & 2032
- Figure 29: Asia Pacific Emission Monitoring Systems Industry Revenue Share (%), by End User 2024 & 2032
- Figure 30: Asia Pacific Emission Monitoring Systems Industry Revenue (Million), by Country 2024 & 2032
- Figure 31: Asia Pacific Emission Monitoring Systems Industry Revenue Share (%), by Country 2024 & 2032
- Figure 32: Latin America Emission Monitoring Systems Industry Revenue (Million), by Component 2024 & 2032
- Figure 33: Latin America Emission Monitoring Systems Industry Revenue Share (%), by Component 2024 & 2032
- Figure 34: Latin America Emission Monitoring Systems Industry Revenue (Million), by End User 2024 & 2032
- Figure 35: Latin America Emission Monitoring Systems Industry Revenue Share (%), by End User 2024 & 2032
- Figure 36: Latin America Emission Monitoring Systems Industry Revenue (Million), by Country 2024 & 2032
- Figure 37: Latin America Emission Monitoring Systems Industry Revenue Share (%), by Country 2024 & 2032
- Figure 38: Middle East and Africa Emission Monitoring Systems Industry Revenue (Million), by Component 2024 & 2032
- Figure 39: Middle East and Africa Emission Monitoring Systems Industry Revenue Share (%), by Component 2024 & 2032
- Figure 40: Middle East and Africa Emission Monitoring Systems Industry Revenue (Million), by End User 2024 & 2032
- Figure 41: Middle East and Africa Emission Monitoring Systems Industry Revenue Share (%), by End User 2024 & 2032
- Figure 42: Middle East and Africa Emission Monitoring Systems Industry Revenue (Million), by Country 2024 & 2032
- Figure 43: Middle East and Africa Emission Monitoring Systems Industry Revenue Share (%), by Country 2024 & 2032
List of Tables
- Table 1: Global Emission Monitoring Systems Industry Revenue Million Forecast, by Region 2019 & 2032
- Table 2: Global Emission Monitoring Systems Industry Revenue Million Forecast, by Component 2019 & 2032
- Table 3: Global Emission Monitoring Systems Industry Revenue Million Forecast, by End User 2019 & 2032
- Table 4: Global Emission Monitoring Systems Industry Revenue Million Forecast, by Region 2019 & 2032
- Table 5: Global Emission Monitoring Systems Industry Revenue Million Forecast, by Country 2019 & 2032
- Table 6: United States Emission Monitoring Systems Industry Revenue (Million) Forecast, by Application 2019 & 2032
- Table 7: Canada Emission Monitoring Systems Industry Revenue (Million) Forecast, by Application 2019 & 2032
- Table 8: Mexico Emission Monitoring Systems Industry Revenue (Million) Forecast, by Application 2019 & 2032
- Table 9: Global Emission Monitoring Systems Industry Revenue Million Forecast, by Country 2019 & 2032
- Table 10: Germany Emission Monitoring Systems Industry Revenue (Million) Forecast, by Application 2019 & 2032
- Table 11: United Kingdom Emission Monitoring Systems Industry Revenue (Million) Forecast, by Application 2019 & 2032
- Table 12: France Emission Monitoring Systems Industry Revenue (Million) Forecast, by Application 2019 & 2032
- Table 13: Spain Emission Monitoring Systems Industry Revenue (Million) Forecast, by Application 2019 & 2032
- Table 14: Italy Emission Monitoring Systems Industry Revenue (Million) Forecast, by Application 2019 & 2032
- Table 15: Spain Emission Monitoring Systems Industry Revenue (Million) Forecast, by Application 2019 & 2032
- Table 16: Belgium Emission Monitoring Systems Industry Revenue (Million) Forecast, by Application 2019 & 2032
- Table 17: Netherland Emission Monitoring Systems Industry Revenue (Million) Forecast, by Application 2019 & 2032
- Table 18: Nordics Emission Monitoring Systems Industry Revenue (Million) Forecast, by Application 2019 & 2032
- Table 19: Rest of Europe Emission Monitoring Systems Industry Revenue (Million) Forecast, by Application 2019 & 2032
- Table 20: Global Emission Monitoring Systems Industry Revenue Million Forecast, by Country 2019 & 2032
- Table 21: China Emission Monitoring Systems Industry Revenue (Million) Forecast, by Application 2019 & 2032
- Table 22: Japan Emission Monitoring Systems Industry Revenue (Million) Forecast, by Application 2019 & 2032
- Table 23: India Emission Monitoring Systems Industry Revenue (Million) Forecast, by Application 2019 & 2032
- Table 24: South Korea Emission Monitoring Systems Industry Revenue (Million) Forecast, by Application 2019 & 2032
- Table 25: Southeast Asia Emission Monitoring Systems Industry Revenue (Million) Forecast, by Application 2019 & 2032
- Table 26: Australia Emission Monitoring Systems Industry Revenue (Million) Forecast, by Application 2019 & 2032
- Table 27: Indonesia Emission Monitoring Systems Industry Revenue (Million) Forecast, by Application 2019 & 2032
- Table 28: Phillipes Emission Monitoring Systems Industry Revenue (Million) Forecast, by Application 2019 & 2032
- Table 29: Singapore Emission Monitoring Systems Industry Revenue (Million) Forecast, by Application 2019 & 2032
- Table 30: Thailandc Emission Monitoring Systems Industry Revenue (Million) Forecast, by Application 2019 & 2032
- Table 31: Rest of Asia Pacific Emission Monitoring Systems Industry Revenue (Million) Forecast, by Application 2019 & 2032
- Table 32: Global Emission Monitoring Systems Industry Revenue Million Forecast, by Country 2019 & 2032
- Table 33: Brazil Emission Monitoring Systems Industry Revenue (Million) Forecast, by Application 2019 & 2032
- Table 34: Argentina Emission Monitoring Systems Industry Revenue (Million) Forecast, by Application 2019 & 2032
- Table 35: Peru Emission Monitoring Systems Industry Revenue (Million) Forecast, by Application 2019 & 2032
- Table 36: Chile Emission Monitoring Systems Industry Revenue (Million) Forecast, by Application 2019 & 2032
- Table 37: Colombia Emission Monitoring Systems Industry Revenue (Million) Forecast, by Application 2019 & 2032
- Table 38: Ecuador Emission Monitoring Systems Industry Revenue (Million) Forecast, by Application 2019 & 2032
- Table 39: Venezuela Emission Monitoring Systems Industry Revenue (Million) Forecast, by Application 2019 & 2032
- Table 40: Rest of South America Emission Monitoring Systems Industry Revenue (Million) Forecast, by Application 2019 & 2032
- Table 41: Global Emission Monitoring Systems Industry Revenue Million Forecast, by Country 2019 & 2032
- Table 42: United States Emission Monitoring Systems Industry Revenue (Million) Forecast, by Application 2019 & 2032
- Table 43: Canada Emission Monitoring Systems Industry Revenue (Million) Forecast, by Application 2019 & 2032
- Table 44: Mexico Emission Monitoring Systems Industry Revenue (Million) Forecast, by Application 2019 & 2032
- Table 45: Global Emission Monitoring Systems Industry Revenue Million Forecast, by Country 2019 & 2032
- Table 46: United Arab Emirates Emission Monitoring Systems Industry Revenue (Million) Forecast, by Application 2019 & 2032
- Table 47: Saudi Arabia Emission Monitoring Systems Industry Revenue (Million) Forecast, by Application 2019 & 2032
- Table 48: South Africa Emission Monitoring Systems Industry Revenue (Million) Forecast, by Application 2019 & 2032
- Table 49: Rest of Middle East and Africa Emission Monitoring Systems Industry Revenue (Million) Forecast, by Application 2019 & 2032
- Table 50: Global Emission Monitoring Systems Industry Revenue Million Forecast, by Component 2019 & 2032
- Table 51: Global Emission Monitoring Systems Industry Revenue Million Forecast, by End User 2019 & 2032
- Table 52: Global Emission Monitoring Systems Industry Revenue Million Forecast, by Country 2019 & 2032
- Table 53: Global Emission Monitoring Systems Industry Revenue Million Forecast, by Component 2019 & 2032
- Table 54: Global Emission Monitoring Systems Industry Revenue Million Forecast, by End User 2019 & 2032
- Table 55: Global Emission Monitoring Systems Industry Revenue Million Forecast, by Country 2019 & 2032
- Table 56: Global Emission Monitoring Systems Industry Revenue Million Forecast, by Component 2019 & 2032
- Table 57: Global Emission Monitoring Systems Industry Revenue Million Forecast, by End User 2019 & 2032
- Table 58: Global Emission Monitoring Systems Industry Revenue Million Forecast, by Country 2019 & 2032
- Table 59: Global Emission Monitoring Systems Industry Revenue Million Forecast, by Component 2019 & 2032
- Table 60: Global Emission Monitoring Systems Industry Revenue Million Forecast, by End User 2019 & 2032
- Table 61: Global Emission Monitoring Systems Industry Revenue Million Forecast, by Country 2019 & 2032
- Table 62: Global Emission Monitoring Systems Industry Revenue Million Forecast, by Component 2019 & 2032
- Table 63: Global Emission Monitoring Systems Industry Revenue Million Forecast, by End User 2019 & 2032
- Table 64: Global Emission Monitoring Systems Industry Revenue Million Forecast, by Country 2019 & 2032
Frequently Asked Questions
1. What is the projected Compound Annual Growth Rate (CAGR) of the Emission Monitoring Systems Industry?
The projected CAGR is approximately 9.20%.
2. Which companies are prominent players in the Emission Monitoring Systems Industry?
Key companies in the market include Thermo Fisher Scientific Inc *List Not Exhaustive, ABB Ltd, AMETEK Inc, Horiba Ltd, Emerson Electric Co, Siemens AG, Sick AG, Rockwell Automation Inc, General Electric Company, Teledyne Technologies Inc.
3. What are the main segments of the Emission Monitoring Systems Industry?
The market segments include Component, End User.
4. Can you provide details about the market size?
The market size is estimated to be USD XX Million as of 2022.
5. What are some drivers contributing to market growth?
Stringent Legal and Environmental Regulations; Increasing Health and Safety Issues.
6. What are the notable trends driving market growth?
Oil & Gas Segment is Expected to Witness Significant Growth.
7. Are there any restraints impacting market growth?
High Cost of These Systems for Regular Maintenance.
8. Can you provide examples of recent developments in the market?
April 2022 - ClassNK has launched 'ClassNK ZETA (Zero Emission Transition Accelerator),' a GHG emissions management tool that allows users to track accurate CO2 emissions and confirm and simulate CII ratings.
9. What pricing options are available for accessing the report?
Pricing options include single-user, multi-user, and enterprise licenses priced at USD 4750, USD 5250, and USD 8750 respectively.
10. Is the market size provided in terms of value or volume?
The market size is provided in terms of value, measured in Million.
11. Are there any specific market keywords associated with the report?
Yes, the market keyword associated with the report is "Emission Monitoring Systems Industry," which aids in identifying and referencing the specific market segment covered.
12. How do I determine which pricing option suits my needs best?
The pricing options vary based on user requirements and access needs. Individual users may opt for single-user licenses, while businesses requiring broader access may choose multi-user or enterprise licenses for cost-effective access to the report.
13. Are there any additional resources or data provided in the Emission Monitoring Systems Industry report?
While the report offers comprehensive insights, it's advisable to review the specific contents or supplementary materials provided to ascertain if additional resources or data are available.
14. How can I stay updated on further developments or reports in the Emission Monitoring Systems Industry?
To stay informed about further developments, trends, and reports in the Emission Monitoring Systems Industry, consider subscribing to industry newsletters, following relevant companies and organizations, or regularly checking reputable industry news sources and publications.
Methodology
Step 1 - Identification of Relevant Samples Size from Population Database


Step 2 - Approaches for Defining Global Market Size (Value, Volume* & Price*)

Note*: In applicable scenarios
Step 3 - Data Sources
Primary Research
- Web Analytics
- Survey Reports
- Research Institute
- Latest Research Reports
- Opinion Leaders
Secondary Research
- Annual Reports
- White Paper
- Latest Press Release
- Industry Association
- Paid Database
- Investor Presentations

Step 4 - Data Triangulation
Involves using different sources of information in order to increase the validity of a study
These sources are likely to be stakeholders in a program - participants, other researchers, program staff, other community members, and so on.
Then we put all data in single framework & apply various statistical tools to find out the dynamic on the market.
During the analysis stage, feedback from the stakeholder groups would be compared to determine areas of agreement as well as areas of divergence
