

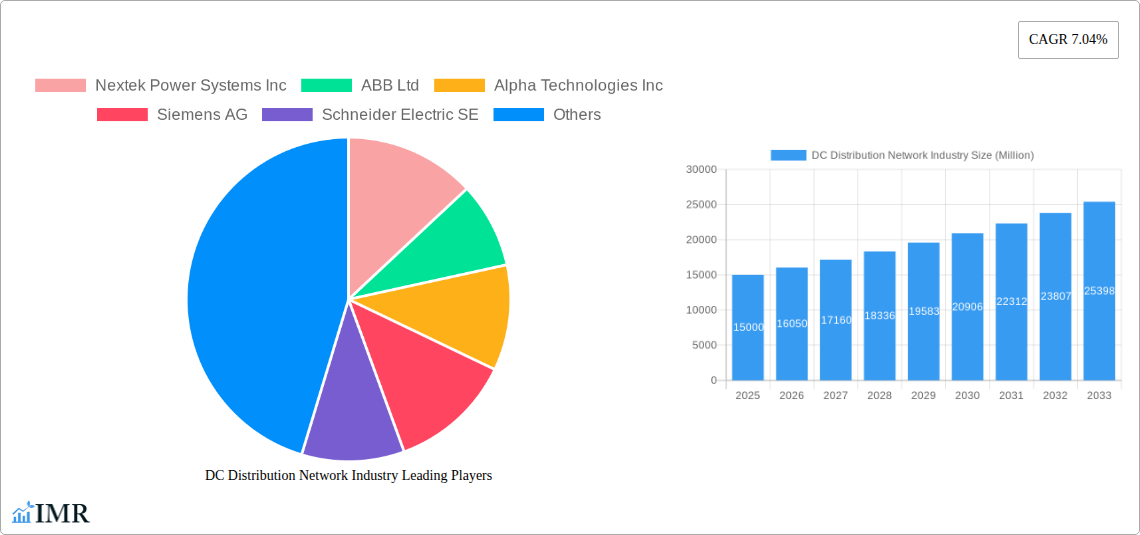
Key Insights
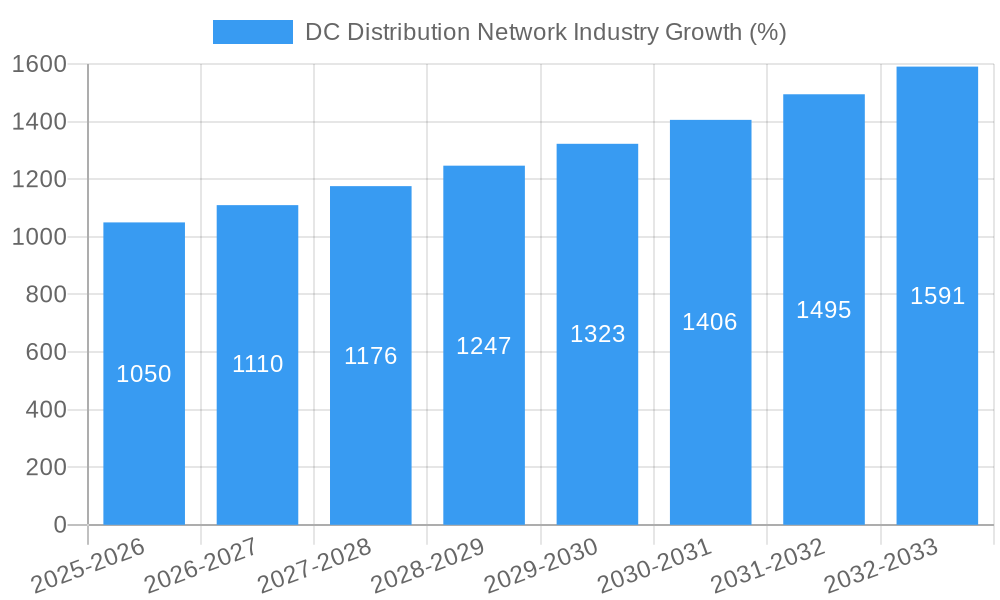
The DC Distribution Network industry is experiencing robust growth, fueled by the increasing demand for reliable power in various sectors. A 7.04% CAGR indicates a significant expansion, projected to reach substantial value by 2033. Key drivers include the proliferation of data centers, the rise of remote cell towers supporting 5G networks, the burgeoning electric vehicle (EV) fast-charging infrastructure, and the growing needs of military applications. These applications necessitate highly efficient and reliable power distribution, driving demand for advanced DC distribution solutions. The market segmentation reveals a strong focus on end-users like data centers, which demand high power density and redundancy, and remote cell towers facing challenges in grid accessibility. Commercial buildings are also significant consumers, adopting DC solutions for energy efficiency and reduced operational costs.
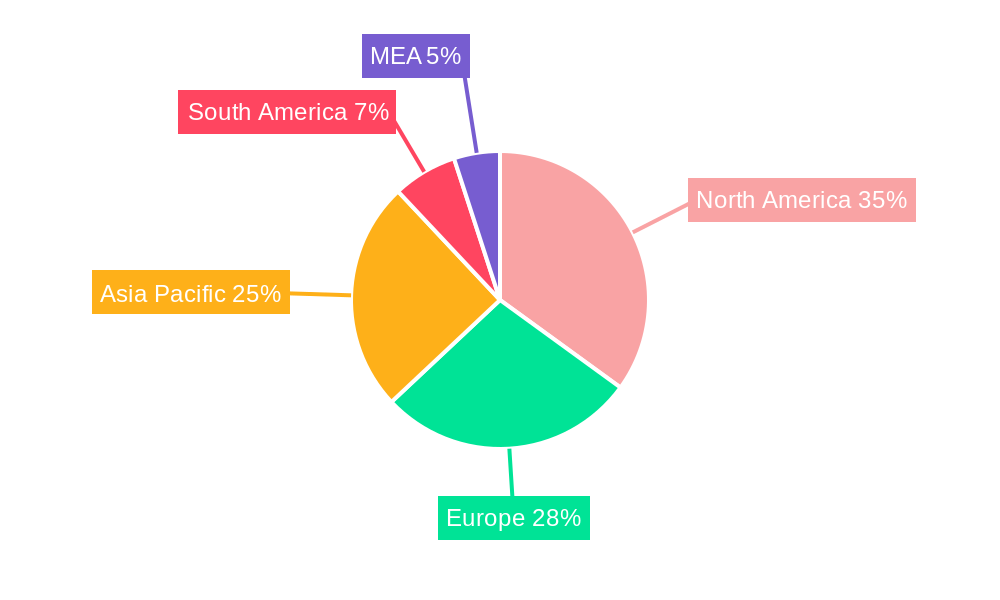
While the industry enjoys positive momentum, challenges remain. Potential restraints include the relatively high initial investment costs associated with DC infrastructure compared to traditional AC systems, along with the need for specialized expertise in design and installation. Nevertheless, long-term cost savings from reduced energy consumption and improved efficiency are expected to offset initial investments, further fueling market growth. The competitive landscape is characterized by both established players like ABB, Siemens, and Eaton, and specialized companies like Nextek Power Systems, indicating opportunities for both large-scale deployments and niche applications. Geographical growth is expected to be diverse, with North America and Asia-Pacific anticipated to be leading markets driven by robust technological adoption and significant infrastructure development in those regions.
This comprehensive report provides an in-depth analysis of the DC Distribution Network industry, encompassing market dynamics, growth trends, regional landscapes, product innovations, and key player strategies. The study covers the period 2019-2033, with a focus on the forecast period 2025-2033 and a base year of 2025. This report is essential for industry professionals, investors, and strategic decision-makers seeking a comprehensive understanding of this rapidly evolving market. The total market size is predicted to reach xx Million by 2033.
DC Distribution Network Industry Market Dynamics & Structure
This section analyzes the structure and dynamics of the DC Distribution Network market, considering factors influencing market concentration, technological advancements, regulatory landscapes, competitive substitutions, end-user demographics, and merger & acquisition (M&A) activities.
- Market Concentration: The DC distribution network market exhibits a moderately concentrated structure with key players holding significant market share. The market share of the top 5 players is estimated at xx%.
- Technological Innovation: Continuous innovation in power electronics, especially in high-voltage direct current (HVDC) technology, is a major driver. Advancements in semiconductor technologies and improved energy storage solutions are further boosting market growth. Barriers to innovation include high R&D costs and the need for industry-wide standardization.
- Regulatory Frameworks: Government regulations and policies promoting renewable energy integration and smart grid deployments are significantly influencing market growth. Stringent environmental regulations are also driving the adoption of cleaner technologies.
- Competitive Product Substitutes: Traditional AC distribution networks remain a major competitor, but the increasing advantages of DC distribution in terms of efficiency and cost-effectiveness are leading to gradual market share shift.
- End-User Demographics: The market is driven by diverse end-users, including data centers, commercial buildings, remote cell towers, military applications, and rapidly expanding EV fast-charging infrastructure. The growth of data centers and the deployment of 5G networks are particularly strong drivers.
- M&A Trends: The DC distribution network market has witnessed an increasing number of M&A activities in recent years, with larger players acquiring smaller companies to enhance their technological capabilities and market reach. The average deal volume in the past 5 years was approximately xx Million.
DC Distribution Network Industry Growth Trends & Insights
This section presents a detailed analysis of market size evolution, adoption rates, technological disruptions, and consumer behavior shifts within the DC Distribution Network market. The market is experiencing significant growth, driven by the increasing demand for reliable and efficient power distribution across various sectors.
The market size, valued at xx Million in 2025, is projected to exhibit a Compound Annual Growth Rate (CAGR) of xx% during the forecast period (2025-2033). This robust growth is fueled by the increasing adoption of renewable energy sources, the rising demand for high-power applications like data centers and EV charging stations, and the ongoing advancements in DC power technologies. Market penetration is expected to increase from xx% in 2025 to xx% by 2033. Technological disruptions, such as the emergence of more efficient power semiconductors and advancements in grid management systems, are further accelerating market growth. Consumer behavior shifts, notably a preference for sustainable energy solutions and enhanced energy efficiency, are also significant drivers.
Dominant Regions, Countries, or Segments in DC Distribution Network Industry
This section identifies the leading regions, countries, or segments within the DC distribution network market.
- North America: The North American region is currently dominating the market, driven by significant investments in renewable energy infrastructure, the rapid expansion of data centers, and increasing adoption of EV fast-charging infrastructure. Key drivers include government incentives for renewable energy integration and strong private sector investments. The region holds a market share of approximately xx%
- Europe: Europe holds the second-largest market share, fueled by stringent environmental regulations promoting clean energy adoption and extensive investments in smart grid modernization.
- Asia-Pacific: The Asia-Pacific region exhibits significant growth potential due to rapid economic development, increasing urbanization, and expanding industrial activities. Growth is driven by increased demand from emerging economies and significant government investments in power infrastructure.
- Fastest Growing Segment: EV Fast Charging Systems: The EV fast-charging systems segment is experiencing the most rapid growth, driven by the global shift towards electric vehicles and the expansion of charging infrastructure. This segment's growth is further amplified by government subsidies and incentives aimed at encouraging EV adoption.
Other end-user segments, such as data centers and commercial buildings, continue to show strong growth, particularly in developed economies.
DC Distribution Network Industry Product Landscape
The DC distribution network market offers a range of products, including DC circuit breakers, DC switchgear, DC power converters, and DC protection relays. Recent innovations focus on enhancing efficiency, reliability, and safety. Key advancements include the development of compact, modular designs, improved power conversion technologies, and the integration of smart grid capabilities. These innovations are aimed at reducing costs, improving energy efficiency, and simplifying installation and maintenance. Unique selling propositions include improved energy efficiency, reduced footprint, and enhanced grid stability.
Key Drivers, Barriers & Challenges in DC Distribution Network Industry
Key Drivers:
- Growth of Renewable Energy: The increasing integration of renewable energy sources necessitates efficient DC distribution networks.
- Expansion of Data Centers: Data centers require high-power, reliable DC power distribution systems.
- Electric Vehicle Adoption: The rapid expansion of EV charging infrastructure requires robust DC networks.
- Government Support: Favorable policies and regulations promoting smart grids and renewable energy drive market growth.
Key Challenges:
- High Initial Investment Costs: The initial investment in DC infrastructure can be substantial, posing a barrier for some adopters.
- Lack of Standardization: A lack of industry-wide standardization can hinder interoperability and hinder market expansion.
- Technical Expertise: Specialized expertise is required for designing, installing, and maintaining DC distribution networks. A skills gap exists in many regions.
- Supply Chain Disruptions: Supply chain vulnerabilities, particularly regarding crucial components like semiconductors, can impact production and deployment.
Emerging Opportunities in DC Distribution Network Industry
Emerging opportunities include expanding into underserved markets, particularly in developing economies, and developing innovative applications like microgrids and hybrid energy systems. The integration of IoT and AI technologies for smart grid management presents significant potential for improved efficiency and grid stability. Further opportunities lie in the development of standardized interfaces and interoperable solutions.
Growth Accelerators in the DC Distribution Network Industry Industry
Technological advancements in power electronics, the increasing adoption of renewable energy, supportive government policies, and strategic collaborations between manufacturers and grid operators are accelerating growth. Strategic partnerships are enabling faster technological advancements and wider market penetration.
Key Players Shaping the DC Distribution Network Industry Market
- Nextek Power Systems Inc
- ABB Ltd
- Alpha Technologies Inc
- Siemens AG
- Schneider Electric SE
- Eaton Corporation PLC
- Robert Bosch GmbH
- Vertiv Group Corp
- Secheron Sa
Notable Milestones in DC Distribution Network Industry Sector
- March 2022: National Grid and Siemens Energy partnered to upgrade a substation using Siemens Energy's fluorinated gas-free Blue DC circuit breakers, showcasing technological advancements in sustainable solutions.
- January 2022: Eaton received a USD 4.9 million award from the US Department of Energy to develop cost-effective DC fast-charging infrastructure solutions, demonstrating government support and driving innovation in the EV charging sector.
In-Depth DC Distribution Network Industry Market Outlook
The DC distribution network market is poised for significant long-term growth, driven by continued technological advancements, supportive government policies, and rising demand from diverse end-user segments. Strategic partnerships and investments in R&D will further accelerate market expansion, creating attractive opportunities for industry players and investors. The market's future hinges on addressing challenges related to cost, standardization, and skilled labor. Successful navigation of these obstacles will unlock even greater growth potential.
DC Distribution Network Industry Segmentation
-
1. End User (Qualitative Analysis Only)
- 1.1. Remote Cell Towers
- 1.2. Commercial Buildings
- 1.3. Data Centers
- 1.4. Military Applications
- 1.5. EV Fast Charging Systems
- 1.6. Other End Users
DC Distribution Network Industry Segmentation By Geography
- 1. North America
- 2. Europe
- 3. Asia Pacific
- 4. South America
- 5. Middle East and Africa
DC Distribution Network Industry REPORT HIGHLIGHTS
| Aspects | Details |
|---|---|
| Study Period | 2019-2033 |
| Base Year | 2024 |
| Estimated Year | 2025 |
| Forecast Period | 2025-2033 |
| Historical Period | 2019-2024 |
| Growth Rate | CAGR of 7.04% from 2019-2033 |
| Segmentation |
|
Table of Contents
- 1. Introduction
- 1.1. Research Scope
- 1.2. Market Segmentation
- 1.3. Research Methodology
- 1.4. Definitions and Assumptions
- 2. Executive Summary
- 2.1. Introduction
- 3. Market Dynamics
- 3.1. Introduction
- 3.2. Market Drivers
- 3.2.1. 4.; Several Government Plans for the Energy Transition in the Region
- 3.3. Market Restrains
- 3.3.1. 4.; Increasing Adoption of Self-generated Renewable Power in the Residential and Commercial Sectors
- 3.4. Market Trends
- 3.4.1. EV Fast Charging Systems to Witness Significant Growth
- 4. Market Factor Analysis
- 4.1. Porters Five Forces
- 4.2. Supply/Value Chain
- 4.3. PESTEL analysis
- 4.4. Market Entropy
- 4.5. Patent/Trademark Analysis
- 5. Global DC Distribution Network Industry Analysis, Insights and Forecast, 2019-2031
- 5.1. Market Analysis, Insights and Forecast - by End User (Qualitative Analysis Only)
- 5.1.1. Remote Cell Towers
- 5.1.2. Commercial Buildings
- 5.1.3. Data Centers
- 5.1.4. Military Applications
- 5.1.5. EV Fast Charging Systems
- 5.1.6. Other End Users
- 5.2. Market Analysis, Insights and Forecast - by Region
- 5.2.1. North America
- 5.2.2. Europe
- 5.2.3. Asia Pacific
- 5.2.4. South America
- 5.2.5. Middle East and Africa
- 5.1. Market Analysis, Insights and Forecast - by End User (Qualitative Analysis Only)
- 6. North America DC Distribution Network Industry Analysis, Insights and Forecast, 2019-2031
- 6.1. Market Analysis, Insights and Forecast - by End User (Qualitative Analysis Only)
- 6.1.1. Remote Cell Towers
- 6.1.2. Commercial Buildings
- 6.1.3. Data Centers
- 6.1.4. Military Applications
- 6.1.5. EV Fast Charging Systems
- 6.1.6. Other End Users
- 6.1. Market Analysis, Insights and Forecast - by End User (Qualitative Analysis Only)
- 7. Europe DC Distribution Network Industry Analysis, Insights and Forecast, 2019-2031
- 7.1. Market Analysis, Insights and Forecast - by End User (Qualitative Analysis Only)
- 7.1.1. Remote Cell Towers
- 7.1.2. Commercial Buildings
- 7.1.3. Data Centers
- 7.1.4. Military Applications
- 7.1.5. EV Fast Charging Systems
- 7.1.6. Other End Users
- 7.1. Market Analysis, Insights and Forecast - by End User (Qualitative Analysis Only)
- 8. Asia Pacific DC Distribution Network Industry Analysis, Insights and Forecast, 2019-2031
- 8.1. Market Analysis, Insights and Forecast - by End User (Qualitative Analysis Only)
- 8.1.1. Remote Cell Towers
- 8.1.2. Commercial Buildings
- 8.1.3. Data Centers
- 8.1.4. Military Applications
- 8.1.5. EV Fast Charging Systems
- 8.1.6. Other End Users
- 8.1. Market Analysis, Insights and Forecast - by End User (Qualitative Analysis Only)
- 9. South America DC Distribution Network Industry Analysis, Insights and Forecast, 2019-2031
- 9.1. Market Analysis, Insights and Forecast - by End User (Qualitative Analysis Only)
- 9.1.1. Remote Cell Towers
- 9.1.2. Commercial Buildings
- 9.1.3. Data Centers
- 9.1.4. Military Applications
- 9.1.5. EV Fast Charging Systems
- 9.1.6. Other End Users
- 9.1. Market Analysis, Insights and Forecast - by End User (Qualitative Analysis Only)
- 10. Middle East and Africa DC Distribution Network Industry Analysis, Insights and Forecast, 2019-2031
- 10.1. Market Analysis, Insights and Forecast - by End User (Qualitative Analysis Only)
- 10.1.1. Remote Cell Towers
- 10.1.2. Commercial Buildings
- 10.1.3. Data Centers
- 10.1.4. Military Applications
- 10.1.5. EV Fast Charging Systems
- 10.1.6. Other End Users
- 10.1. Market Analysis, Insights and Forecast - by End User (Qualitative Analysis Only)
- 11. North America DC Distribution Network Industry Analysis, Insights and Forecast, 2019-2031
- 11.1. Market Analysis, Insights and Forecast - By Country/Sub-region
- 11.1.1 United States
- 11.1.2 Canada
- 11.1.3 Mexico
- 12. Europe DC Distribution Network Industry Analysis, Insights and Forecast, 2019-2031
- 12.1. Market Analysis, Insights and Forecast - By Country/Sub-region
- 12.1.1 Germany
- 12.1.2 United Kingdom
- 12.1.3 France
- 12.1.4 Spain
- 12.1.5 Italy
- 12.1.6 Spain
- 12.1.7 Belgium
- 12.1.8 Netherland
- 12.1.9 Nordics
- 12.1.10 Rest of Europe
- 13. Asia Pacific DC Distribution Network Industry Analysis, Insights and Forecast, 2019-2031
- 13.1. Market Analysis, Insights and Forecast - By Country/Sub-region
- 13.1.1 China
- 13.1.2 Japan
- 13.1.3 India
- 13.1.4 South Korea
- 13.1.5 Southeast Asia
- 13.1.6 Australia
- 13.1.7 Indonesia
- 13.1.8 Phillipes
- 13.1.9 Singapore
- 13.1.10 Thailandc
- 13.1.11 Rest of Asia Pacific
- 14. South America DC Distribution Network Industry Analysis, Insights and Forecast, 2019-2031
- 14.1. Market Analysis, Insights and Forecast - By Country/Sub-region
- 14.1.1 Brazil
- 14.1.2 Argentina
- 14.1.3 Peru
- 14.1.4 Chile
- 14.1.5 Colombia
- 14.1.6 Ecuador
- 14.1.7 Venezuela
- 14.1.8 Rest of South America
- 15. North America DC Distribution Network Industry Analysis, Insights and Forecast, 2019-2031
- 15.1. Market Analysis, Insights and Forecast - By Country/Sub-region
- 15.1.1 United States
- 15.1.2 Canada
- 15.1.3 Mexico
- 16. MEA DC Distribution Network Industry Analysis, Insights and Forecast, 2019-2031
- 16.1. Market Analysis, Insights and Forecast - By Country/Sub-region
- 16.1.1 United Arab Emirates
- 16.1.2 Saudi Arabia
- 16.1.3 South Africa
- 16.1.4 Rest of Middle East and Africa
- 17. Competitive Analysis
- 17.1. Global Market Share Analysis 2024
- 17.2. Company Profiles
- 17.2.1 Nextek Power Systems Inc
- 17.2.1.1. Overview
- 17.2.1.2. Products
- 17.2.1.3. SWOT Analysis
- 17.2.1.4. Recent Developments
- 17.2.1.5. Financials (Based on Availability)
- 17.2.2 ABB Ltd
- 17.2.2.1. Overview
- 17.2.2.2. Products
- 17.2.2.3. SWOT Analysis
- 17.2.2.4. Recent Developments
- 17.2.2.5. Financials (Based on Availability)
- 17.2.3 Alpha Technologies Inc
- 17.2.3.1. Overview
- 17.2.3.2. Products
- 17.2.3.3. SWOT Analysis
- 17.2.3.4. Recent Developments
- 17.2.3.5. Financials (Based on Availability)
- 17.2.4 Siemens AG
- 17.2.4.1. Overview
- 17.2.4.2. Products
- 17.2.4.3. SWOT Analysis
- 17.2.4.4. Recent Developments
- 17.2.4.5. Financials (Based on Availability)
- 17.2.5 Schneider Electric SE
- 17.2.5.1. Overview
- 17.2.5.2. Products
- 17.2.5.3. SWOT Analysis
- 17.2.5.4. Recent Developments
- 17.2.5.5. Financials (Based on Availability)
- 17.2.6 Eaton Corporation PLC
- 17.2.6.1. Overview
- 17.2.6.2. Products
- 17.2.6.3. SWOT Analysis
- 17.2.6.4. Recent Developments
- 17.2.6.5. Financials (Based on Availability)
- 17.2.7 Robert Bosch GmbH
- 17.2.7.1. Overview
- 17.2.7.2. Products
- 17.2.7.3. SWOT Analysis
- 17.2.7.4. Recent Developments
- 17.2.7.5. Financials (Based on Availability)
- 17.2.8 Vertiv Group Corp
- 17.2.8.1. Overview
- 17.2.8.2. Products
- 17.2.8.3. SWOT Analysis
- 17.2.8.4. Recent Developments
- 17.2.8.5. Financials (Based on Availability)
- 17.2.9 Secheron Sa*List Not Exhaustive
- 17.2.9.1. Overview
- 17.2.9.2. Products
- 17.2.9.3. SWOT Analysis
- 17.2.9.4. Recent Developments
- 17.2.9.5. Financials (Based on Availability)
- 17.2.1 Nextek Power Systems Inc
List of Figures
- Figure 1: Global DC Distribution Network Industry Revenue Breakdown (Million, %) by Region 2024 & 2032
- Figure 2: North America DC Distribution Network Industry Revenue (Million), by Country 2024 & 2032
- Figure 3: North America DC Distribution Network Industry Revenue Share (%), by Country 2024 & 2032
- Figure 4: Europe DC Distribution Network Industry Revenue (Million), by Country 2024 & 2032
- Figure 5: Europe DC Distribution Network Industry Revenue Share (%), by Country 2024 & 2032
- Figure 6: Asia Pacific DC Distribution Network Industry Revenue (Million), by Country 2024 & 2032
- Figure 7: Asia Pacific DC Distribution Network Industry Revenue Share (%), by Country 2024 & 2032
- Figure 8: South America DC Distribution Network Industry Revenue (Million), by Country 2024 & 2032
- Figure 9: South America DC Distribution Network Industry Revenue Share (%), by Country 2024 & 2032
- Figure 10: North America DC Distribution Network Industry Revenue (Million), by Country 2024 & 2032
- Figure 11: North America DC Distribution Network Industry Revenue Share (%), by Country 2024 & 2032
- Figure 12: MEA DC Distribution Network Industry Revenue (Million), by Country 2024 & 2032
- Figure 13: MEA DC Distribution Network Industry Revenue Share (%), by Country 2024 & 2032
- Figure 14: North America DC Distribution Network Industry Revenue (Million), by End User (Qualitative Analysis Only) 2024 & 2032
- Figure 15: North America DC Distribution Network Industry Revenue Share (%), by End User (Qualitative Analysis Only) 2024 & 2032
- Figure 16: North America DC Distribution Network Industry Revenue (Million), by Country 2024 & 2032
- Figure 17: North America DC Distribution Network Industry Revenue Share (%), by Country 2024 & 2032
- Figure 18: Europe DC Distribution Network Industry Revenue (Million), by End User (Qualitative Analysis Only) 2024 & 2032
- Figure 19: Europe DC Distribution Network Industry Revenue Share (%), by End User (Qualitative Analysis Only) 2024 & 2032
- Figure 20: Europe DC Distribution Network Industry Revenue (Million), by Country 2024 & 2032
- Figure 21: Europe DC Distribution Network Industry Revenue Share (%), by Country 2024 & 2032
- Figure 22: Asia Pacific DC Distribution Network Industry Revenue (Million), by End User (Qualitative Analysis Only) 2024 & 2032
- Figure 23: Asia Pacific DC Distribution Network Industry Revenue Share (%), by End User (Qualitative Analysis Only) 2024 & 2032
- Figure 24: Asia Pacific DC Distribution Network Industry Revenue (Million), by Country 2024 & 2032
- Figure 25: Asia Pacific DC Distribution Network Industry Revenue Share (%), by Country 2024 & 2032
- Figure 26: South America DC Distribution Network Industry Revenue (Million), by End User (Qualitative Analysis Only) 2024 & 2032
- Figure 27: South America DC Distribution Network Industry Revenue Share (%), by End User (Qualitative Analysis Only) 2024 & 2032
- Figure 28: South America DC Distribution Network Industry Revenue (Million), by Country 2024 & 2032
- Figure 29: South America DC Distribution Network Industry Revenue Share (%), by Country 2024 & 2032
- Figure 30: Middle East and Africa DC Distribution Network Industry Revenue (Million), by End User (Qualitative Analysis Only) 2024 & 2032
- Figure 31: Middle East and Africa DC Distribution Network Industry Revenue Share (%), by End User (Qualitative Analysis Only) 2024 & 2032
- Figure 32: Middle East and Africa DC Distribution Network Industry Revenue (Million), by Country 2024 & 2032
- Figure 33: Middle East and Africa DC Distribution Network Industry Revenue Share (%), by Country 2024 & 2032
List of Tables
- Table 1: Global DC Distribution Network Industry Revenue Million Forecast, by Region 2019 & 2032
- Table 2: Global DC Distribution Network Industry Revenue Million Forecast, by End User (Qualitative Analysis Only) 2019 & 2032
- Table 3: Global DC Distribution Network Industry Revenue Million Forecast, by Region 2019 & 2032
- Table 4: Global DC Distribution Network Industry Revenue Million Forecast, by Country 2019 & 2032
- Table 5: United States DC Distribution Network Industry Revenue (Million) Forecast, by Application 2019 & 2032
- Table 6: Canada DC Distribution Network Industry Revenue (Million) Forecast, by Application 2019 & 2032
- Table 7: Mexico DC Distribution Network Industry Revenue (Million) Forecast, by Application 2019 & 2032
- Table 8: Global DC Distribution Network Industry Revenue Million Forecast, by Country 2019 & 2032
- Table 9: Germany DC Distribution Network Industry Revenue (Million) Forecast, by Application 2019 & 2032
- Table 10: United Kingdom DC Distribution Network Industry Revenue (Million) Forecast, by Application 2019 & 2032
- Table 11: France DC Distribution Network Industry Revenue (Million) Forecast, by Application 2019 & 2032
- Table 12: Spain DC Distribution Network Industry Revenue (Million) Forecast, by Application 2019 & 2032
- Table 13: Italy DC Distribution Network Industry Revenue (Million) Forecast, by Application 2019 & 2032
- Table 14: Spain DC Distribution Network Industry Revenue (Million) Forecast, by Application 2019 & 2032
- Table 15: Belgium DC Distribution Network Industry Revenue (Million) Forecast, by Application 2019 & 2032
- Table 16: Netherland DC Distribution Network Industry Revenue (Million) Forecast, by Application 2019 & 2032
- Table 17: Nordics DC Distribution Network Industry Revenue (Million) Forecast, by Application 2019 & 2032
- Table 18: Rest of Europe DC Distribution Network Industry Revenue (Million) Forecast, by Application 2019 & 2032
- Table 19: Global DC Distribution Network Industry Revenue Million Forecast, by Country 2019 & 2032
- Table 20: China DC Distribution Network Industry Revenue (Million) Forecast, by Application 2019 & 2032
- Table 21: Japan DC Distribution Network Industry Revenue (Million) Forecast, by Application 2019 & 2032
- Table 22: India DC Distribution Network Industry Revenue (Million) Forecast, by Application 2019 & 2032
- Table 23: South Korea DC Distribution Network Industry Revenue (Million) Forecast, by Application 2019 & 2032
- Table 24: Southeast Asia DC Distribution Network Industry Revenue (Million) Forecast, by Application 2019 & 2032
- Table 25: Australia DC Distribution Network Industry Revenue (Million) Forecast, by Application 2019 & 2032
- Table 26: Indonesia DC Distribution Network Industry Revenue (Million) Forecast, by Application 2019 & 2032
- Table 27: Phillipes DC Distribution Network Industry Revenue (Million) Forecast, by Application 2019 & 2032
- Table 28: Singapore DC Distribution Network Industry Revenue (Million) Forecast, by Application 2019 & 2032
- Table 29: Thailandc DC Distribution Network Industry Revenue (Million) Forecast, by Application 2019 & 2032
- Table 30: Rest of Asia Pacific DC Distribution Network Industry Revenue (Million) Forecast, by Application 2019 & 2032
- Table 31: Global DC Distribution Network Industry Revenue Million Forecast, by Country 2019 & 2032
- Table 32: Brazil DC Distribution Network Industry Revenue (Million) Forecast, by Application 2019 & 2032
- Table 33: Argentina DC Distribution Network Industry Revenue (Million) Forecast, by Application 2019 & 2032
- Table 34: Peru DC Distribution Network Industry Revenue (Million) Forecast, by Application 2019 & 2032
- Table 35: Chile DC Distribution Network Industry Revenue (Million) Forecast, by Application 2019 & 2032
- Table 36: Colombia DC Distribution Network Industry Revenue (Million) Forecast, by Application 2019 & 2032
- Table 37: Ecuador DC Distribution Network Industry Revenue (Million) Forecast, by Application 2019 & 2032
- Table 38: Venezuela DC Distribution Network Industry Revenue (Million) Forecast, by Application 2019 & 2032
- Table 39: Rest of South America DC Distribution Network Industry Revenue (Million) Forecast, by Application 2019 & 2032
- Table 40: Global DC Distribution Network Industry Revenue Million Forecast, by Country 2019 & 2032
- Table 41: United States DC Distribution Network Industry Revenue (Million) Forecast, by Application 2019 & 2032
- Table 42: Canada DC Distribution Network Industry Revenue (Million) Forecast, by Application 2019 & 2032
- Table 43: Mexico DC Distribution Network Industry Revenue (Million) Forecast, by Application 2019 & 2032
- Table 44: Global DC Distribution Network Industry Revenue Million Forecast, by Country 2019 & 2032
- Table 45: United Arab Emirates DC Distribution Network Industry Revenue (Million) Forecast, by Application 2019 & 2032
- Table 46: Saudi Arabia DC Distribution Network Industry Revenue (Million) Forecast, by Application 2019 & 2032
- Table 47: South Africa DC Distribution Network Industry Revenue (Million) Forecast, by Application 2019 & 2032
- Table 48: Rest of Middle East and Africa DC Distribution Network Industry Revenue (Million) Forecast, by Application 2019 & 2032
- Table 49: Global DC Distribution Network Industry Revenue Million Forecast, by End User (Qualitative Analysis Only) 2019 & 2032
- Table 50: Global DC Distribution Network Industry Revenue Million Forecast, by Country 2019 & 2032
- Table 51: Global DC Distribution Network Industry Revenue Million Forecast, by End User (Qualitative Analysis Only) 2019 & 2032
- Table 52: Global DC Distribution Network Industry Revenue Million Forecast, by Country 2019 & 2032
- Table 53: Global DC Distribution Network Industry Revenue Million Forecast, by End User (Qualitative Analysis Only) 2019 & 2032
- Table 54: Global DC Distribution Network Industry Revenue Million Forecast, by Country 2019 & 2032
- Table 55: Global DC Distribution Network Industry Revenue Million Forecast, by End User (Qualitative Analysis Only) 2019 & 2032
- Table 56: Global DC Distribution Network Industry Revenue Million Forecast, by Country 2019 & 2032
- Table 57: Global DC Distribution Network Industry Revenue Million Forecast, by End User (Qualitative Analysis Only) 2019 & 2032
- Table 58: Global DC Distribution Network Industry Revenue Million Forecast, by Country 2019 & 2032
Frequently Asked Questions
1. What is the projected Compound Annual Growth Rate (CAGR) of the DC Distribution Network Industry?
The projected CAGR is approximately 7.04%.
2. Which companies are prominent players in the DC Distribution Network Industry?
Key companies in the market include Nextek Power Systems Inc, ABB Ltd, Alpha Technologies Inc, Siemens AG, Schneider Electric SE, Eaton Corporation PLC, Robert Bosch GmbH, Vertiv Group Corp, Secheron Sa*List Not Exhaustive.
3. What are the main segments of the DC Distribution Network Industry?
The market segments include End User (Qualitative Analysis Only) .
4. Can you provide details about the market size?
The market size is estimated to be USD XX Million as of 2022.
5. What are some drivers contributing to market growth?
4.; Several Government Plans for the Energy Transition in the Region.
6. What are the notable trends driving market growth?
EV Fast Charging Systems to Witness Significant Growth.
7. Are there any restraints impacting market growth?
4.; Increasing Adoption of Self-generated Renewable Power in the Residential and Commercial Sectors.
8. Can you provide examples of recent developments in the market?
March 2022: In line with shared commitments to decarbonize, National Grid and Siemens Energy teamed up to undertake an upgrade of a National Grid substation using Siemens Energy-designed fluorinated gas-free Blue DC circuit breakers, which are made of clean air insulation and vacuum switching technology. Scheduled for commissioning in 2023, Siemens Energy's Blue DC circuit breakers will be installed in Massachusetts at the United States substation that serves several Massachusetts communities. The first Siemens Energy Blue circuit breaker installation will be in National Grid's United States electricity network.
9. What pricing options are available for accessing the report?
Pricing options include single-user, multi-user, and enterprise licenses priced at USD 4750, USD 5250, and USD 8750 respectively.
10. Is the market size provided in terms of value or volume?
The market size is provided in terms of value, measured in Million.
11. Are there any specific market keywords associated with the report?
Yes, the market keyword associated with the report is "DC Distribution Network Industry," which aids in identifying and referencing the specific market segment covered.
12. How do I determine which pricing option suits my needs best?
The pricing options vary based on user requirements and access needs. Individual users may opt for single-user licenses, while businesses requiring broader access may choose multi-user or enterprise licenses for cost-effective access to the report.
13. Are there any additional resources or data provided in the DC Distribution Network Industry report?
While the report offers comprehensive insights, it's advisable to review the specific contents or supplementary materials provided to ascertain if additional resources or data are available.
14. How can I stay updated on further developments or reports in the DC Distribution Network Industry?
To stay informed about further developments, trends, and reports in the DC Distribution Network Industry, consider subscribing to industry newsletters, following relevant companies and organizations, or regularly checking reputable industry news sources and publications.
Methodology
Step 1 - Identification of Relevant Samples Size from Population Database


Step 2 - Approaches for Defining Global Market Size (Value, Volume* & Price*)

Note*: In applicable scenarios
Step 3 - Data Sources
Primary Research
- Web Analytics
- Survey Reports
- Research Institute
- Latest Research Reports
- Opinion Leaders
Secondary Research
- Annual Reports
- White Paper
- Latest Press Release
- Industry Association
- Paid Database
- Investor Presentations

Step 4 - Data Triangulation
Involves using different sources of information in order to increase the validity of a study
These sources are likely to be stakeholders in a program - participants, other researchers, program staff, other community members, and so on.
Then we put all data in single framework & apply various statistical tools to find out the dynamic on the market.
During the analysis stage, feedback from the stakeholder groups would be compared to determine areas of agreement as well as areas of divergence
