

Key Insights
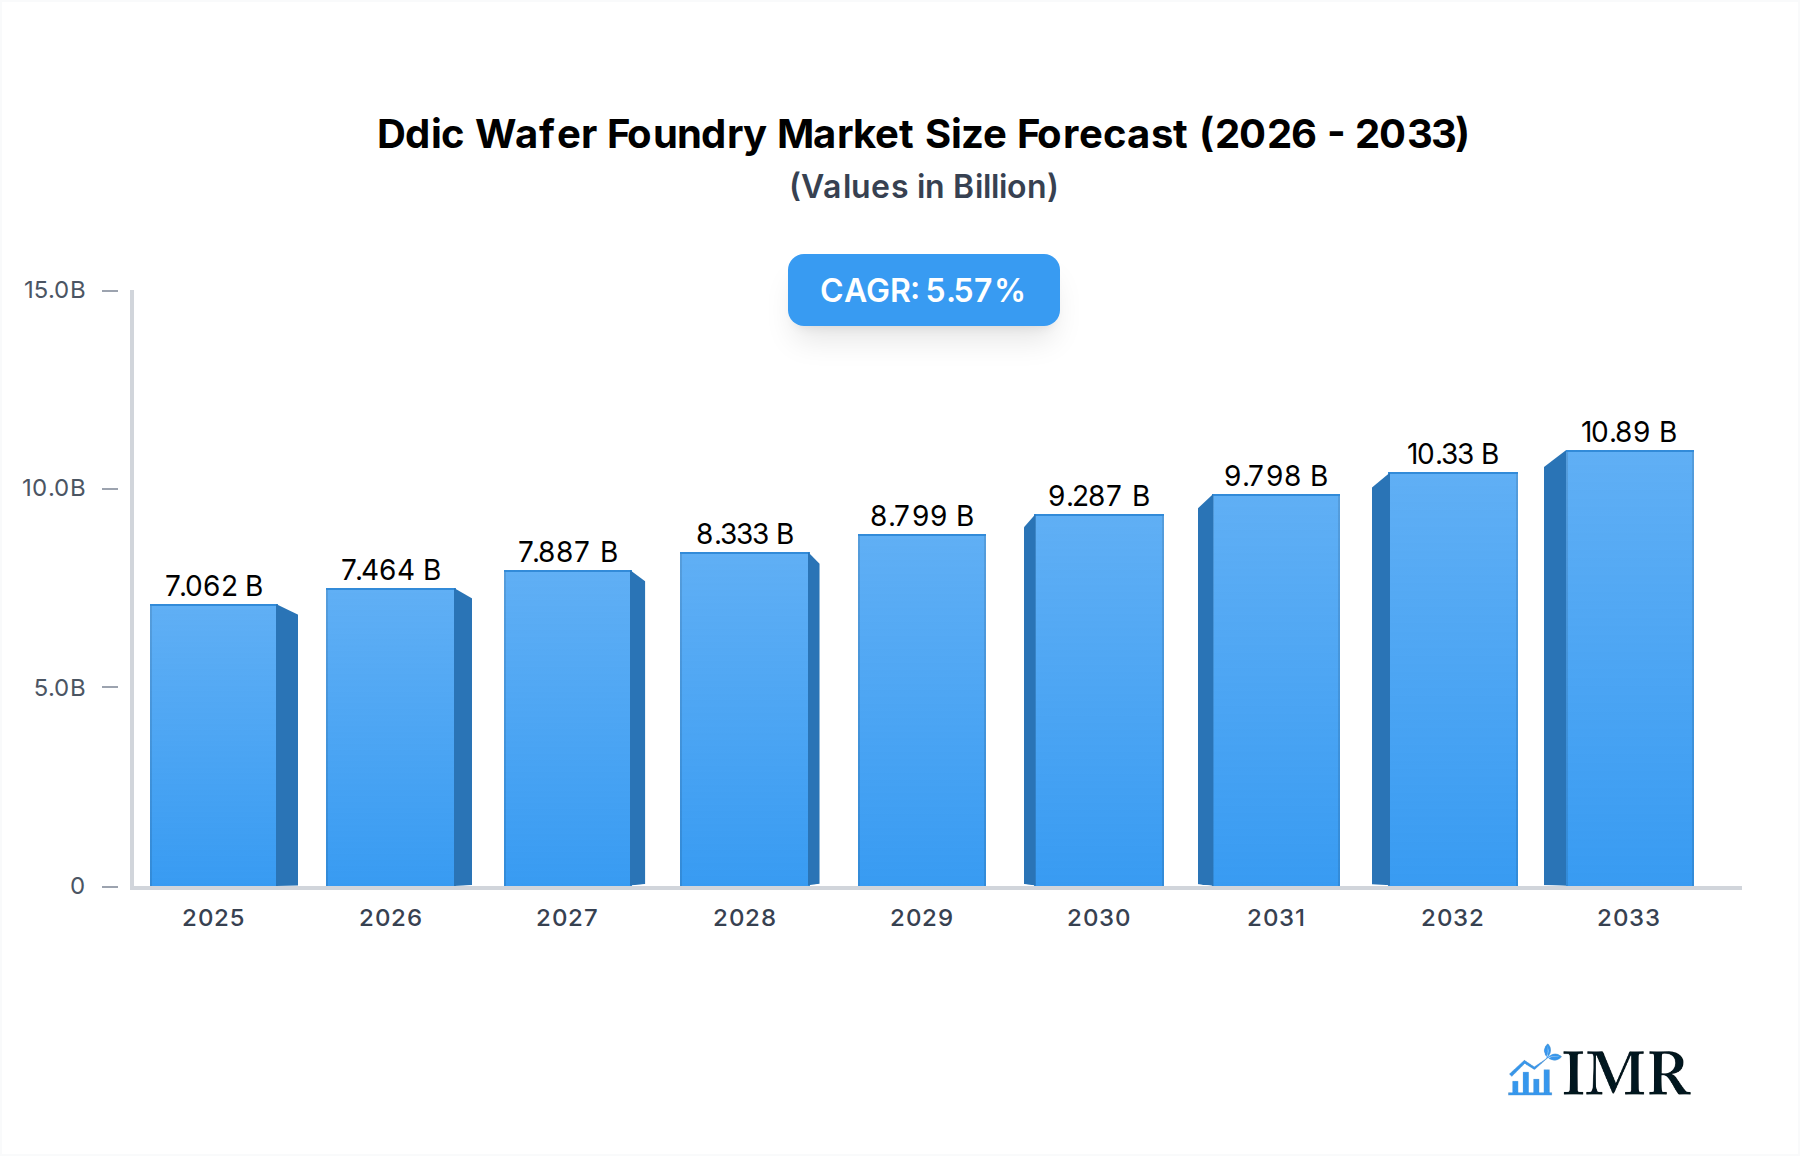
The global Ddic Wafer Foundry market is experiencing robust expansion, projected to reach an estimated $7,062 million by 2025, driven by an anticipated Compound Annual Growth Rate (CAGR) of 5.6% over the forecast period of 2025-2033. This significant growth is primarily fueled by the escalating demand for advanced display technologies across a multitude of applications, particularly in the large-size display segment, encompassing a wide array of televisions. The increasing adoption of smart devices, wearables, and automotive displays also contributes to the burgeoning market for Ddic wafer foundry services. Advancements in semiconductor manufacturing processes, including the increasing prevalence of 45nm and below nodes, are enabling the production of more efficient and sophisticated Ddic chips, further stimulating market development. Emerging economies are also playing a crucial role, with a growing consumer base and increasing disposable incomes leading to a higher demand for electronic devices with advanced displays.

Ddic Wafer Foundry Market Size (In Billion)
The Ddic Wafer Foundry market is characterized by intense competition among established players such as TSMC, Samsung Foundry, and United Microelectronics Corporation (UMC), all vying for dominance through technological innovation and capacity expansion. The market is segmented by application into Large Size Display (TV) and Small and Medium Size Display, with the former currently holding a significant market share due to the burgeoning demand for larger and higher-resolution televisions. By type, the market is segmented across various process nodes, including 45nm and Below, 65/55nm, 90nm, 130/110nm, and 150 nm and Above, reflecting the diverse requirements of different display technologies. Geographically, the Asia Pacific region, particularly China and South Korea, is a dominant force, owing to its established manufacturing ecosystem and strong presence of leading display panel manufacturers. North America and Europe are also significant markets, driven by innovation in consumer electronics and automotive sectors. The market's trajectory is expected to be shaped by continuous investment in research and development, focusing on enhancing power efficiency, display quality, and cost-effectiveness of Ddic chips.
Ddic Wafer Foundry Company Market Share
Ddic Wafer Foundry Market Report: Navigating the Future of Display Technology
This comprehensive report offers an in-depth analysis of the Ddic Wafer Foundry market, a critical sector underpinning the global display industry. Covering the period from 2019 to 2033, with a base and estimated year of 2025, this report provides crucial insights for stakeholders seeking to understand market dynamics, growth trajectories, and competitive landscapes. Leveraging high-traffic keywords such as "display driver IC foundry," "semiconductor manufacturing," "advanced node," and "display technology," this report is optimized for maximum search engine visibility and relevance to industry professionals. We delve into both parent and child markets, offering a holistic view of the ecosystem, and present all quantitative data in millions of units.
Ddic Wafer Foundry Market Dynamics & Structure
The Ddic Wafer Foundry market exhibits a moderately concentrated structure, dominated by a few key players that command significant market share. Technological innovation, particularly in advancing process nodes and improving power efficiency for display driver integrated circuits (DDICs), serves as a primary driver. Regulatory frameworks, especially those pertaining to environmental standards and intellectual property, also play a crucial role in shaping market entry and operational strategies. Competitive product substitutes, while limited within the core DDIC foundry segment, emerge from alternative display technologies and integrated solutions. End-user demographics, influenced by the growing demand for high-resolution and feature-rich displays across consumer electronics, are a critical factor in market evolution. Mergers and acquisitions (M&A) trends are indicative of consolidation efforts and strategic expansions by leading foundries to secure market position and expand capacity.
- Market Concentration: Dominated by a few key players with substantial foundry capacity for DDICs.
- Technological Innovation Drivers: Advancements in process nodes (e.g., 45nm and below), increased integration density, and enhanced power management solutions for advanced displays.
- Regulatory Frameworks: Environmental compliance and IP protection policies influencing manufacturing operations and technology development.
- Competitive Product Substitutes: Emerging integrated display controller solutions and advancements in alternative display technologies posing indirect competition.
- End-User Demographics: Growing consumer demand for larger, higher-resolution, and more energy-efficient displays for televisions, smartphones, and wearables.
- M&A Trends: Strategic acquisitions and partnerships aimed at capacity expansion, technology acquisition, and market diversification.
Ddic Wafer Foundry Growth Trends & Insights
The Ddic Wafer Foundry market is projected to experience robust growth over the forecast period, driven by an insatiable global appetite for advanced display technologies. The market size is expected to expand significantly, fueled by increasing adoption rates of high-definition and OLED displays across various applications, from large-screen televisions to compact smartphones and automotive displays. Technological disruptions, such as the transition to newer manufacturing processes and the development of specialized DDICs for emerging display types, are continuously reshaping the competitive landscape. Consumer behavior shifts, characterized by a preference for immersive visual experiences and the proliferation of smart devices, are directly translating into higher demand for sophisticated display driver ICs. This evolving demand necessitates continuous innovation and capacity expansion from wafer foundries. The CAGR of the market is projected to be in the range of xx% during the forecast period. Market penetration of advanced nodes for DDICs is steadily increasing, especially for small and medium-sized displays that demand higher performance and lower power consumption.
Dominant Regions, Countries, or Segments in Ddic Wafer Foundry
The Small and Medium Size Display segment, particularly those utilizing advanced process nodes like 45nm and below, is emerging as a dominant force driving growth in the Ddic Wafer Foundry market. This dominance is fueled by the explosive expansion of the smartphone, tablet, wearable, and automotive display markets, all of which rely heavily on sophisticated and power-efficient DDICs. Countries with established semiconductor manufacturing ecosystems, strong government support for the electronics industry, and a significant presence of display panel manufacturers are leading the charge. Taiwan and South Korea, home to major display panel producers and leading foundries, are pivotal regions. The demand for higher resolutions, faster refresh rates, and improved power efficiency in these smaller displays necessitates foundries to invest heavily in advanced process technologies.
- Dominant Segment: Small and Medium Size Display applications, driven by smartphones, wearables, and automotive infotainment systems.
- Dominant Process Node: 45nm and Below, offering superior performance, power efficiency, and integration for advanced displays.
- Key Regional Players: Taiwan and South Korea, with their robust semiconductor manufacturing infrastructure and strong presence of display panel giants.
- Key Country Drivers: Government incentives for semiconductor manufacturing, skilled workforce availability, and strong domestic demand for consumer electronics.
- Market Share & Growth Potential: The Small and Medium Size Display segment currently holds an estimated xx% of the total Ddic Wafer Foundry market and is projected to grow at a CAGR of xx% during the forecast period.
Ddic Wafer Foundry Product Landscape
The Ddic Wafer Foundry product landscape is characterized by continuous innovation in process technologies and IC designs tailored for diverse display applications. Foundries are focusing on delivering DDICs manufactured on advanced nodes such as 45nm and below, enabling higher resolutions, increased pixel counts, and enhanced display performance. For large size displays like TVs, the emphasis is on cost-effectiveness and high volume production, often utilizing nodes like 65/55nm and 90nm. Conversely, small and medium-sized displays demand cutting-edge solutions for improved power efficiency, faster response times, and advanced features like high refresh rates and dynamic contrast ratios, pushing the boundaries of 45nm and below processes. Key product innovations include integrated solutions offering reduced bill of materials and smaller form factors, along with advanced power management techniques to extend battery life in portable devices.
Key Drivers, Barriers & Challenges in Ddic Wafer Foundry
The Ddic Wafer Foundry market is propelled by several key drivers. The burgeoning demand for advanced display technologies across consumer electronics, automotive, and industrial sectors is paramount. Continuous technological advancements in semiconductor manufacturing, enabling smaller process nodes and higher integration densities for DDICs, are critical. Furthermore, the increasing adoption of 5G technology, leading to richer multimedia experiences, directly fuels the need for more sophisticated display drivers.
Conversely, the market faces significant barriers and challenges. The substantial capital investment required for advanced semiconductor fabrication facilities is a major hurdle, limiting new entrants. Supply chain disruptions, exacerbated by geopolitical factors and global events, pose a constant threat to production stability. Intense competition among foundries, particularly in securing long-term contracts with major display panel manufacturers, can lead to price pressures. Navigating complex intellectual property landscapes and stringent environmental regulations also presents considerable challenges.
Emerging Opportunities in Ddic Wafer Foundry
Emerging opportunities within the Ddic Wafer Foundry market lie in the burgeoning demand for advanced display technologies in nascent and rapidly growing sectors. The automotive industry's transition towards digital cockpits and advanced driver-assistance systems (ADAS) is creating significant demand for specialized DDICs with enhanced reliability and performance. Similarly, the metaverse and augmented reality (AR)/virtual reality (VR) markets, while still in their early stages, promise substantial future growth for foundries capable of producing DDICs for high-resolution, low-latency displays. Furthermore, the increasing adoption of foldable and flexible displays in consumer electronics presents unique manufacturing challenges and opportunities for foundries that can master these advanced packaging and process technologies.
Growth Accelerators in the Ddic Wafer Foundry Industry
Several factors are acting as growth accelerators for the Ddic Wafer Foundry industry. The relentless pursuit of higher display resolutions and refresh rates by panel manufacturers, driven by consumer expectations, necessitates foundry support for bleeding-edge process technologies. Strategic partnerships and collaborations between foundries and IC design houses are crucial for co-developing innovative DDIC solutions that meet evolving market demands. Government initiatives promoting domestic semiconductor manufacturing and R&D investments also play a vital role in fostering industry growth and innovation. The expansion of cloud computing and data-intensive applications further fuels demand for displays with superior visual fidelity, indirectly benefiting the DDIC foundry sector.
Key Players Shaping the Ddic Wafer Foundry Market
- TSMC
- Samsung Foundry
- United Microelectronics Corporation (UMC)
- VIS (Vanguard International Semiconductor)
- HLMC
- Nexchip
Notable Milestones in Ddic Wafer Foundry Sector
- 2019: TSMC announces advancements in its 7nm process node, enabling higher performance and efficiency for DDICs.
- 2020: Samsung Foundry expands its capacity for advanced process nodes to meet growing demand from display manufacturers.
- 2021: UMC invests in new fabrication facilities to increase its foundry capacity for display driver ICs.
- 2022: VIS announces a new generation of DDICs for high-refresh-rate gaming displays.
- 2023: HLMC showcases its capabilities in producing DDICs for emerging OLED display technologies.
- 2024: Nexchip unveils its latest 12-inch wafer manufacturing capabilities for advanced display driver ICs.
In-Depth Ddic Wafer Foundry Market Outlook
The Ddic Wafer Foundry market is poised for significant expansion, driven by its integral role in the ever-evolving display technology landscape. The persistent demand for higher resolution, greater energy efficiency, and more immersive visual experiences across a multitude of devices will continue to fuel innovation and capacity expansion among foundries. Strategic investments in advanced process nodes, particularly for small and medium-sized displays, coupled with a focus on developing tailored solutions for emerging applications like automotive and AR/VR, will be critical for success. Foundries that can effectively navigate supply chain complexities, embrace sustainable manufacturing practices, and forge strong partnerships with IC designers and panel manufacturers will be well-positioned to capitalize on the substantial growth opportunities projected for the coming years.
Ddic Wafer Foundry Segmentation
-
1. Application
- 1.1. Large Size Display (TV)
- 1.2. Small and Medium Size Display
-
2. Type
- 2.1. 45nm and Below
- 2.2. 65/55nm
- 2.3. 90nm
- 2.4. 130/110nm
- 2.5. 150 nm and Above
Ddic Wafer Foundry Segmentation By Geography
-
1. North America
- 1.1. United States
- 1.2. Canada
- 1.3. Mexico
-
2. South America
- 2.1. Brazil
- 2.2. Argentina
- 2.3. Rest of South America
-
3. Europe
- 3.1. United Kingdom
- 3.2. Germany
- 3.3. France
- 3.4. Italy
- 3.5. Spain
- 3.6. Russia
- 3.7. Benelux
- 3.8. Nordics
- 3.9. Rest of Europe
-
4. Middle East & Africa
- 4.1. Turkey
- 4.2. Israel
- 4.3. GCC
- 4.4. North Africa
- 4.5. South Africa
- 4.6. Rest of Middle East & Africa
-
5. Asia Pacific
- 5.1. China
- 5.2. India
- 5.3. Japan
- 5.4. South Korea
- 5.5. ASEAN
- 5.6. Oceania
- 5.7. Rest of Asia Pacific
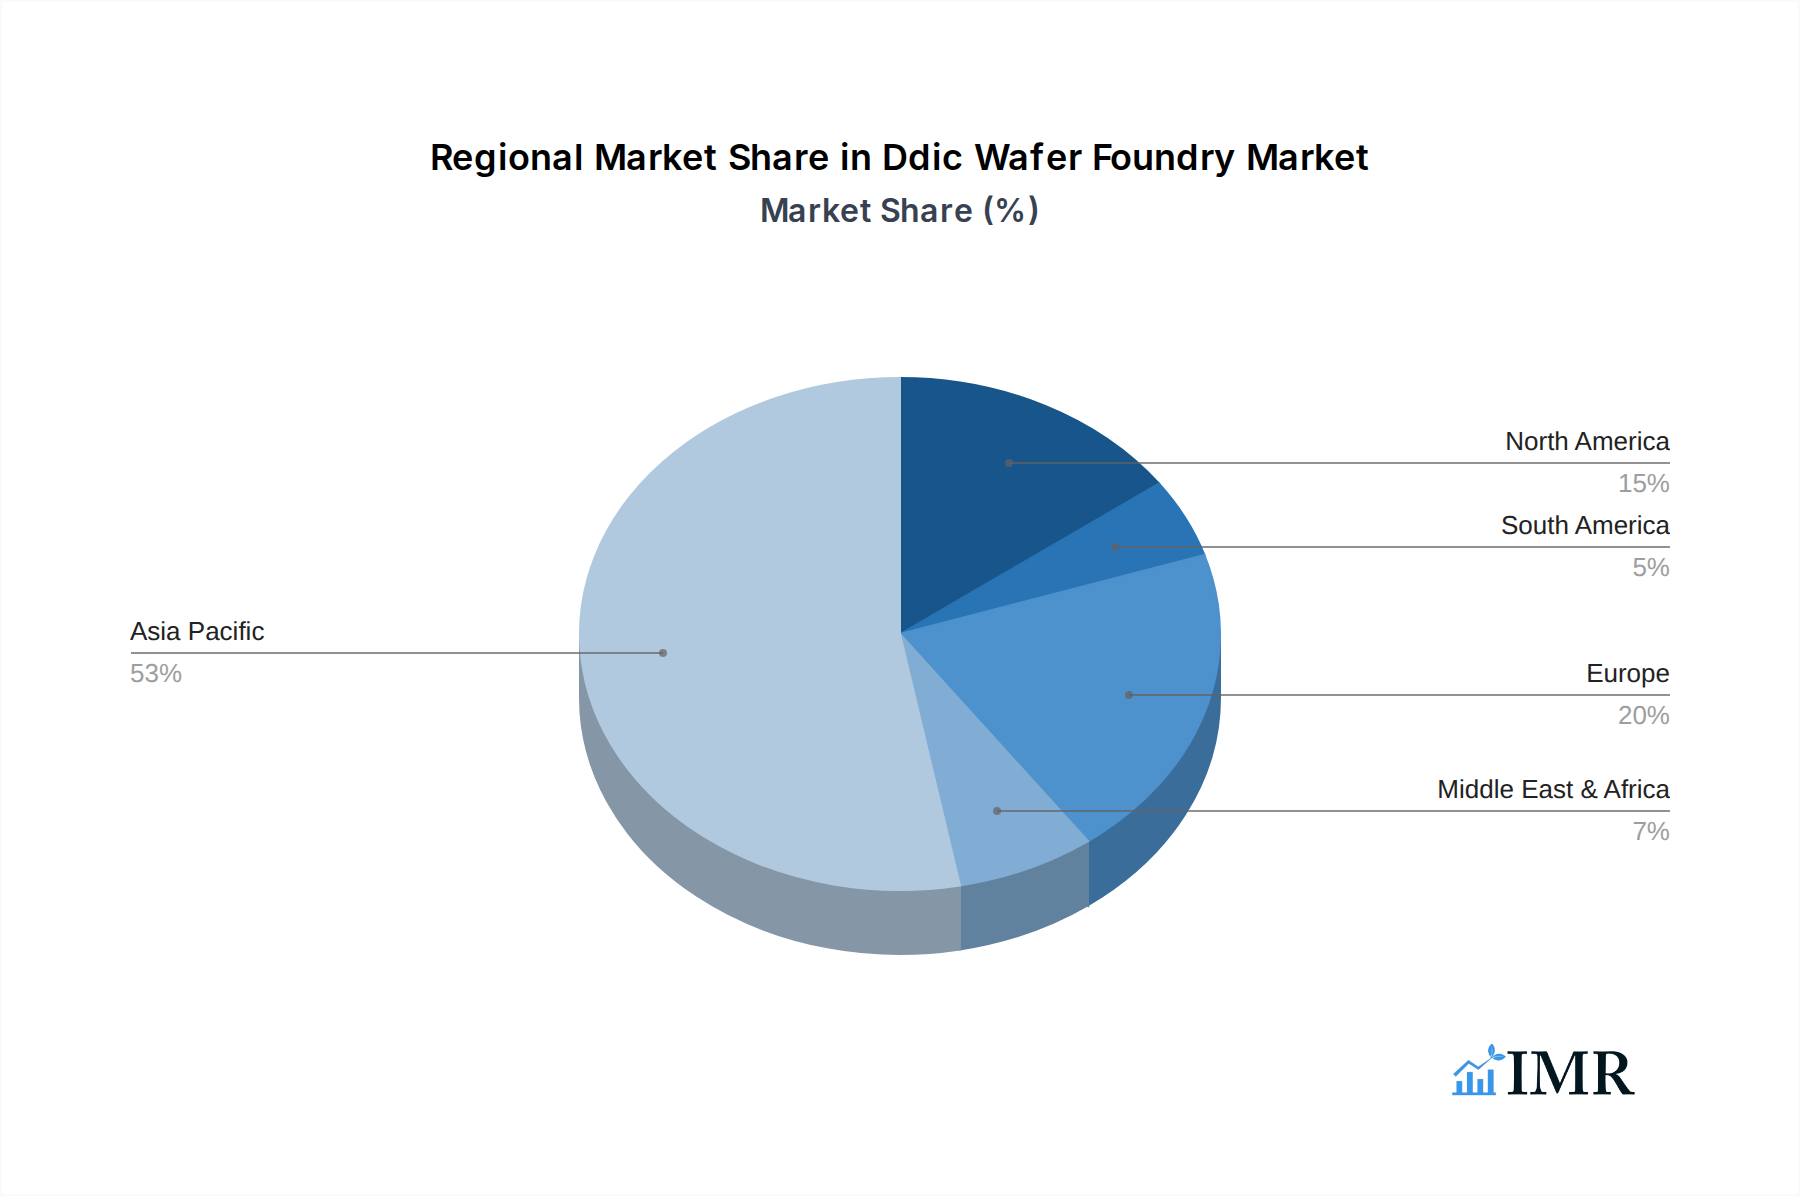
Ddic Wafer Foundry Regional Market Share
Geographic Coverage of Ddic Wafer Foundry
Ddic Wafer Foundry REPORT HIGHLIGHTS
| Aspects | Details |
|---|---|
| Study Period | 2020-2034 |
| Base Year | 2025 |
| Estimated Year | 2026 |
| Forecast Period | 2026-2034 |
| Historical Period | 2020-2025 |
| Growth Rate | CAGR of 5.6% from 2020-2034 |
| Segmentation |
|
Table of Contents
- 1. Introduction
- 1.1. Research Scope
- 1.2. Market Segmentation
- 1.3. Research Methodology
- 1.4. Definitions and Assumptions
- 2. Executive Summary
- 2.1. Introduction
- 3. Market Dynamics
- 3.1. Introduction
- 3.2. Market Drivers
- 3.3. Market Restrains
- 3.4. Market Trends
- 4. Market Factor Analysis
- 4.1. Porters Five Forces
- 4.2. Supply/Value Chain
- 4.3. PESTEL analysis
- 4.4. Market Entropy
- 4.5. Patent/Trademark Analysis
- 5. Global Ddic Wafer Foundry Analysis, Insights and Forecast, 2020-2032
- 5.1. Market Analysis, Insights and Forecast - by Application
- 5.1.1. Large Size Display (TV)
- 5.1.2. Small and Medium Size Display
- 5.2. Market Analysis, Insights and Forecast - by Type
- 5.2.1. 45nm and Below
- 5.2.2. 65/55nm
- 5.2.3. 90nm
- 5.2.4. 130/110nm
- 5.2.5. 150 nm and Above
- 5.3. Market Analysis, Insights and Forecast - by Region
- 5.3.1. North America
- 5.3.2. South America
- 5.3.3. Europe
- 5.3.4. Middle East & Africa
- 5.3.5. Asia Pacific
- 5.1. Market Analysis, Insights and Forecast - by Application
- 6. North America Ddic Wafer Foundry Analysis, Insights and Forecast, 2020-2032
- 6.1. Market Analysis, Insights and Forecast - by Application
- 6.1.1. Large Size Display (TV)
- 6.1.2. Small and Medium Size Display
- 6.2. Market Analysis, Insights and Forecast - by Type
- 6.2.1. 45nm and Below
- 6.2.2. 65/55nm
- 6.2.3. 90nm
- 6.2.4. 130/110nm
- 6.2.5. 150 nm and Above
- 6.1. Market Analysis, Insights and Forecast - by Application
- 7. South America Ddic Wafer Foundry Analysis, Insights and Forecast, 2020-2032
- 7.1. Market Analysis, Insights and Forecast - by Application
- 7.1.1. Large Size Display (TV)
- 7.1.2. Small and Medium Size Display
- 7.2. Market Analysis, Insights and Forecast - by Type
- 7.2.1. 45nm and Below
- 7.2.2. 65/55nm
- 7.2.3. 90nm
- 7.2.4. 130/110nm
- 7.2.5. 150 nm and Above
- 7.1. Market Analysis, Insights and Forecast - by Application
- 8. Europe Ddic Wafer Foundry Analysis, Insights and Forecast, 2020-2032
- 8.1. Market Analysis, Insights and Forecast - by Application
- 8.1.1. Large Size Display (TV)
- 8.1.2. Small and Medium Size Display
- 8.2. Market Analysis, Insights and Forecast - by Type
- 8.2.1. 45nm and Below
- 8.2.2. 65/55nm
- 8.2.3. 90nm
- 8.2.4. 130/110nm
- 8.2.5. 150 nm and Above
- 8.1. Market Analysis, Insights and Forecast - by Application
- 9. Middle East & Africa Ddic Wafer Foundry Analysis, Insights and Forecast, 2020-2032
- 9.1. Market Analysis, Insights and Forecast - by Application
- 9.1.1. Large Size Display (TV)
- 9.1.2. Small and Medium Size Display
- 9.2. Market Analysis, Insights and Forecast - by Type
- 9.2.1. 45nm and Below
- 9.2.2. 65/55nm
- 9.2.3. 90nm
- 9.2.4. 130/110nm
- 9.2.5. 150 nm and Above
- 9.1. Market Analysis, Insights and Forecast - by Application
- 10. Asia Pacific Ddic Wafer Foundry Analysis, Insights and Forecast, 2020-2032
- 10.1. Market Analysis, Insights and Forecast - by Application
- 10.1.1. Large Size Display (TV)
- 10.1.2. Small and Medium Size Display
- 10.2. Market Analysis, Insights and Forecast - by Type
- 10.2.1. 45nm and Below
- 10.2.2. 65/55nm
- 10.2.3. 90nm
- 10.2.4. 130/110nm
- 10.2.5. 150 nm and Above
- 10.1. Market Analysis, Insights and Forecast - by Application
- 11. Competitive Analysis
- 11.1. Global Market Share Analysis 2025
- 11.2. Company Profiles
- 11.2.1 TSMC
- 11.2.1.1. Overview
- 11.2.1.2. Products
- 11.2.1.3. SWOT Analysis
- 11.2.1.4. Recent Developments
- 11.2.1.5. Financials (Based on Availability)
- 11.2.2 Samsung Foundry
- 11.2.2.1. Overview
- 11.2.2.2. Products
- 11.2.2.3. SWOT Analysis
- 11.2.2.4. Recent Developments
- 11.2.2.5. Financials (Based on Availability)
- 11.2.3 United Microelectronics Corporation (UMC)
- 11.2.3.1. Overview
- 11.2.3.2. Products
- 11.2.3.3. SWOT Analysis
- 11.2.3.4. Recent Developments
- 11.2.3.5. Financials (Based on Availability)
- 11.2.4 VIS (Vanguard International Semiconductor)
- 11.2.4.1. Overview
- 11.2.4.2. Products
- 11.2.4.3. SWOT Analysis
- 11.2.4.4. Recent Developments
- 11.2.4.5. Financials (Based on Availability)
- 11.2.5 HLMC
- 11.2.5.1. Overview
- 11.2.5.2. Products
- 11.2.5.3. SWOT Analysis
- 11.2.5.4. Recent Developments
- 11.2.5.5. Financials (Based on Availability)
- 11.2.6 Nexchip
- 11.2.6.1. Overview
- 11.2.6.2. Products
- 11.2.6.3. SWOT Analysis
- 11.2.6.4. Recent Developments
- 11.2.6.5. Financials (Based on Availability)
- 11.2.1 TSMC
List of Figures
- Figure 1: Global Ddic Wafer Foundry Revenue Breakdown (million, %) by Region 2025 & 2033
- Figure 2: North America Ddic Wafer Foundry Revenue (million), by Application 2025 & 2033
- Figure 3: North America Ddic Wafer Foundry Revenue Share (%), by Application 2025 & 2033
- Figure 4: North America Ddic Wafer Foundry Revenue (million), by Type 2025 & 2033
- Figure 5: North America Ddic Wafer Foundry Revenue Share (%), by Type 2025 & 2033
- Figure 6: North America Ddic Wafer Foundry Revenue (million), by Country 2025 & 2033
- Figure 7: North America Ddic Wafer Foundry Revenue Share (%), by Country 2025 & 2033
- Figure 8: South America Ddic Wafer Foundry Revenue (million), by Application 2025 & 2033
- Figure 9: South America Ddic Wafer Foundry Revenue Share (%), by Application 2025 & 2033
- Figure 10: South America Ddic Wafer Foundry Revenue (million), by Type 2025 & 2033
- Figure 11: South America Ddic Wafer Foundry Revenue Share (%), by Type 2025 & 2033
- Figure 12: South America Ddic Wafer Foundry Revenue (million), by Country 2025 & 2033
- Figure 13: South America Ddic Wafer Foundry Revenue Share (%), by Country 2025 & 2033
- Figure 14: Europe Ddic Wafer Foundry Revenue (million), by Application 2025 & 2033
- Figure 15: Europe Ddic Wafer Foundry Revenue Share (%), by Application 2025 & 2033
- Figure 16: Europe Ddic Wafer Foundry Revenue (million), by Type 2025 & 2033
- Figure 17: Europe Ddic Wafer Foundry Revenue Share (%), by Type 2025 & 2033
- Figure 18: Europe Ddic Wafer Foundry Revenue (million), by Country 2025 & 2033
- Figure 19: Europe Ddic Wafer Foundry Revenue Share (%), by Country 2025 & 2033
- Figure 20: Middle East & Africa Ddic Wafer Foundry Revenue (million), by Application 2025 & 2033
- Figure 21: Middle East & Africa Ddic Wafer Foundry Revenue Share (%), by Application 2025 & 2033
- Figure 22: Middle East & Africa Ddic Wafer Foundry Revenue (million), by Type 2025 & 2033
- Figure 23: Middle East & Africa Ddic Wafer Foundry Revenue Share (%), by Type 2025 & 2033
- Figure 24: Middle East & Africa Ddic Wafer Foundry Revenue (million), by Country 2025 & 2033
- Figure 25: Middle East & Africa Ddic Wafer Foundry Revenue Share (%), by Country 2025 & 2033
- Figure 26: Asia Pacific Ddic Wafer Foundry Revenue (million), by Application 2025 & 2033
- Figure 27: Asia Pacific Ddic Wafer Foundry Revenue Share (%), by Application 2025 & 2033
- Figure 28: Asia Pacific Ddic Wafer Foundry Revenue (million), by Type 2025 & 2033
- Figure 29: Asia Pacific Ddic Wafer Foundry Revenue Share (%), by Type 2025 & 2033
- Figure 30: Asia Pacific Ddic Wafer Foundry Revenue (million), by Country 2025 & 2033
- Figure 31: Asia Pacific Ddic Wafer Foundry Revenue Share (%), by Country 2025 & 2033
List of Tables
- Table 1: Global Ddic Wafer Foundry Revenue million Forecast, by Application 2020 & 2033
- Table 2: Global Ddic Wafer Foundry Revenue million Forecast, by Type 2020 & 2033
- Table 3: Global Ddic Wafer Foundry Revenue million Forecast, by Region 2020 & 2033
- Table 4: Global Ddic Wafer Foundry Revenue million Forecast, by Application 2020 & 2033
- Table 5: Global Ddic Wafer Foundry Revenue million Forecast, by Type 2020 & 2033
- Table 6: Global Ddic Wafer Foundry Revenue million Forecast, by Country 2020 & 2033
- Table 7: United States Ddic Wafer Foundry Revenue (million) Forecast, by Application 2020 & 2033
- Table 8: Canada Ddic Wafer Foundry Revenue (million) Forecast, by Application 2020 & 2033
- Table 9: Mexico Ddic Wafer Foundry Revenue (million) Forecast, by Application 2020 & 2033
- Table 10: Global Ddic Wafer Foundry Revenue million Forecast, by Application 2020 & 2033
- Table 11: Global Ddic Wafer Foundry Revenue million Forecast, by Type 2020 & 2033
- Table 12: Global Ddic Wafer Foundry Revenue million Forecast, by Country 2020 & 2033
- Table 13: Brazil Ddic Wafer Foundry Revenue (million) Forecast, by Application 2020 & 2033
- Table 14: Argentina Ddic Wafer Foundry Revenue (million) Forecast, by Application 2020 & 2033
- Table 15: Rest of South America Ddic Wafer Foundry Revenue (million) Forecast, by Application 2020 & 2033
- Table 16: Global Ddic Wafer Foundry Revenue million Forecast, by Application 2020 & 2033
- Table 17: Global Ddic Wafer Foundry Revenue million Forecast, by Type 2020 & 2033
- Table 18: Global Ddic Wafer Foundry Revenue million Forecast, by Country 2020 & 2033
- Table 19: United Kingdom Ddic Wafer Foundry Revenue (million) Forecast, by Application 2020 & 2033
- Table 20: Germany Ddic Wafer Foundry Revenue (million) Forecast, by Application 2020 & 2033
- Table 21: France Ddic Wafer Foundry Revenue (million) Forecast, by Application 2020 & 2033
- Table 22: Italy Ddic Wafer Foundry Revenue (million) Forecast, by Application 2020 & 2033
- Table 23: Spain Ddic Wafer Foundry Revenue (million) Forecast, by Application 2020 & 2033
- Table 24: Russia Ddic Wafer Foundry Revenue (million) Forecast, by Application 2020 & 2033
- Table 25: Benelux Ddic Wafer Foundry Revenue (million) Forecast, by Application 2020 & 2033
- Table 26: Nordics Ddic Wafer Foundry Revenue (million) Forecast, by Application 2020 & 2033
- Table 27: Rest of Europe Ddic Wafer Foundry Revenue (million) Forecast, by Application 2020 & 2033
- Table 28: Global Ddic Wafer Foundry Revenue million Forecast, by Application 2020 & 2033
- Table 29: Global Ddic Wafer Foundry Revenue million Forecast, by Type 2020 & 2033
- Table 30: Global Ddic Wafer Foundry Revenue million Forecast, by Country 2020 & 2033
- Table 31: Turkey Ddic Wafer Foundry Revenue (million) Forecast, by Application 2020 & 2033
- Table 32: Israel Ddic Wafer Foundry Revenue (million) Forecast, by Application 2020 & 2033
- Table 33: GCC Ddic Wafer Foundry Revenue (million) Forecast, by Application 2020 & 2033
- Table 34: North Africa Ddic Wafer Foundry Revenue (million) Forecast, by Application 2020 & 2033
- Table 35: South Africa Ddic Wafer Foundry Revenue (million) Forecast, by Application 2020 & 2033
- Table 36: Rest of Middle East & Africa Ddic Wafer Foundry Revenue (million) Forecast, by Application 2020 & 2033
- Table 37: Global Ddic Wafer Foundry Revenue million Forecast, by Application 2020 & 2033
- Table 38: Global Ddic Wafer Foundry Revenue million Forecast, by Type 2020 & 2033
- Table 39: Global Ddic Wafer Foundry Revenue million Forecast, by Country 2020 & 2033
- Table 40: China Ddic Wafer Foundry Revenue (million) Forecast, by Application 2020 & 2033
- Table 41: India Ddic Wafer Foundry Revenue (million) Forecast, by Application 2020 & 2033
- Table 42: Japan Ddic Wafer Foundry Revenue (million) Forecast, by Application 2020 & 2033
- Table 43: South Korea Ddic Wafer Foundry Revenue (million) Forecast, by Application 2020 & 2033
- Table 44: ASEAN Ddic Wafer Foundry Revenue (million) Forecast, by Application 2020 & 2033
- Table 45: Oceania Ddic Wafer Foundry Revenue (million) Forecast, by Application 2020 & 2033
- Table 46: Rest of Asia Pacific Ddic Wafer Foundry Revenue (million) Forecast, by Application 2020 & 2033
Frequently Asked Questions
1. What is the projected Compound Annual Growth Rate (CAGR) of the Ddic Wafer Foundry?
The projected CAGR is approximately 5.6%.
2. Which companies are prominent players in the Ddic Wafer Foundry?
Key companies in the market include TSMC, Samsung Foundry, United Microelectronics Corporation (UMC), VIS (Vanguard International Semiconductor), HLMC, Nexchip.
3. What are the main segments of the Ddic Wafer Foundry?
The market segments include Application, Type.
4. Can you provide details about the market size?
The market size is estimated to be USD 7062 million as of 2022.
5. What are some drivers contributing to market growth?
N/A
6. What are the notable trends driving market growth?
N/A
7. Are there any restraints impacting market growth?
N/A
8. Can you provide examples of recent developments in the market?
N/A
9. What pricing options are available for accessing the report?
Pricing options include single-user, multi-user, and enterprise licenses priced at USD 4250.00, USD 6375.00, and USD 8500.00 respectively.
10. Is the market size provided in terms of value or volume?
The market size is provided in terms of value, measured in million.
11. Are there any specific market keywords associated with the report?
Yes, the market keyword associated with the report is "Ddic Wafer Foundry," which aids in identifying and referencing the specific market segment covered.
12. How do I determine which pricing option suits my needs best?
The pricing options vary based on user requirements and access needs. Individual users may opt for single-user licenses, while businesses requiring broader access may choose multi-user or enterprise licenses for cost-effective access to the report.
13. Are there any additional resources or data provided in the Ddic Wafer Foundry report?
While the report offers comprehensive insights, it's advisable to review the specific contents or supplementary materials provided to ascertain if additional resources or data are available.
14. How can I stay updated on further developments or reports in the Ddic Wafer Foundry?
To stay informed about further developments, trends, and reports in the Ddic Wafer Foundry, consider subscribing to industry newsletters, following relevant companies and organizations, or regularly checking reputable industry news sources and publications.
Methodology
Step 1 - Identification of Relevant Samples Size from Population Database


Step 2 - Approaches for Defining Global Market Size (Value, Volume* & Price*)

Note*: In applicable scenarios
Step 3 - Data Sources
Primary Research
- Web Analytics
- Survey Reports
- Research Institute
- Latest Research Reports
- Opinion Leaders
Secondary Research
- Annual Reports
- White Paper
- Latest Press Release
- Industry Association
- Paid Database
- Investor Presentations

Step 4 - Data Triangulation
Involves using different sources of information in order to increase the validity of a study
These sources are likely to be stakeholders in a program - participants, other researchers, program staff, other community members, and so on.
Then we put all data in single framework & apply various statistical tools to find out the dynamic on the market.
During the analysis stage, feedback from the stakeholder groups would be compared to determine areas of agreement as well as areas of divergence