

Key Insights
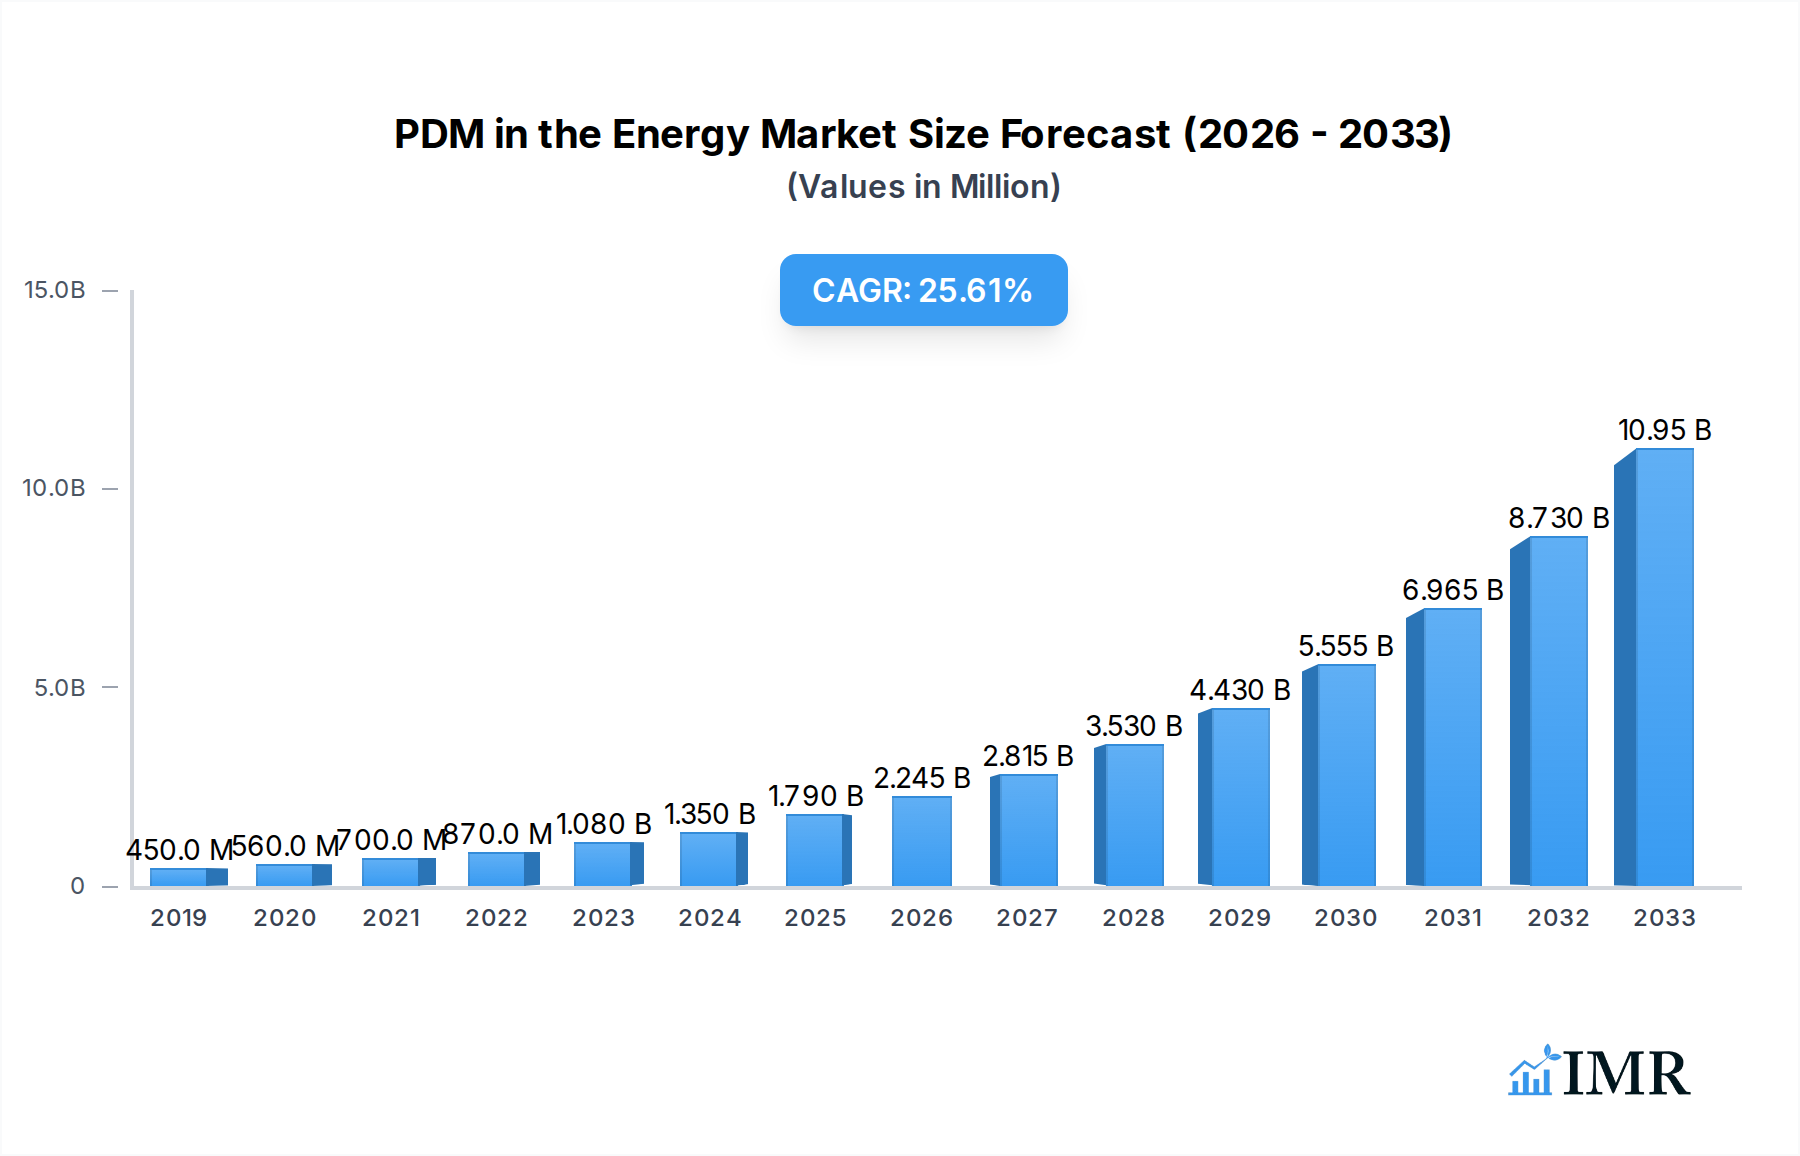
The global market for Product Data Management (PDM) in the Energy sector is poised for significant expansion, projected to reach a substantial $1.79 billion by 2025. This growth is fueled by an impressive Compound Annual Growth Rate (CAGR) of 25.77% during the forecast period of 2025-2033. Key drivers propelling this surge include the escalating complexity of energy projects, the increasing demand for regulatory compliance and standardization, and the imperative for enhanced operational efficiency in an industry undergoing rapid digital transformation. Companies are increasingly adopting PDM solutions to streamline workflows, improve collaboration across dispersed teams, and ensure the integrity and accessibility of critical project data, from initial design to ongoing maintenance and decommissioning. The push towards renewable energy sources and the modernization of existing energy infrastructure further necessitate robust data management capabilities to handle diverse datasets and complex lifecycles.

PDM in the Energy Market Market Size (In Million)
The PDM in the Energy market is characterized by a dynamic landscape of offerings, with "Solutions" and "Services" segments leading the adoption, supported by both "On-premise" and "Cloud" deployment models. The Cloud segment is experiencing particularly rapid growth due to its scalability, cost-effectiveness, and ease of integration. Geographically, North America and Europe are currently dominant markets, driven by established energy industries and advanced technological adoption. However, the Asia Pacific region, especially China and India, is emerging as a high-growth area, propelled by massive investments in energy infrastructure and a burgeoning adoption of digital technologies. Restraints such as the initial cost of implementation and concerns regarding data security, particularly for sensitive energy infrastructure information, are being mitigated by the clear ROI offered by PDM systems and the development of more secure cloud-based solutions. Leading companies like Siemens AG, ABB Ltd, and GE Automation & Control are at the forefront, offering sophisticated PDM solutions tailored to the unique demands of the energy industry.
PDM in the Energy Market Company Market Share
Report Description: PDM in the Energy Market – Growth, Trends, and Future Outlook (2019-2033)
This comprehensive report offers an in-depth analysis of the Predictive Maintenance (PDM) market within the global energy sector. Examining market dynamics, growth trends, regional dominance, product landscape, key drivers, challenges, opportunities, and key players, this report provides strategic insights for stakeholders. The study covers the period from 2019 to 2033, with a base and estimated year of 2025, and a forecast period of 2025–2033, with historical data from 2019–2024. It integrates high-traffic keywords such as "predictive maintenance energy," "energy IoT," "digital twin energy," "AI in energy," "smart grid maintenance," and "asset management energy" to maximize search engine visibility. The report also explores parent and child market segments, offering a holistic view of the industry's evolution. All values are presented in Million units.
PDM in the Energy Market Market Dynamics & Structure
The PDM in the Energy Market is characterized by a moderately concentrated structure, driven by a blend of established industrial giants and emerging technology innovators. Technological innovation is the primary driver, fueled by advancements in Artificial Intelligence (AI), Machine Learning (ML), the Internet of Things (IoT), and the proliferation of Big Data analytics. These technologies enable more accurate and timely predictions of equipment failures, optimizing operational efficiency and reducing downtime across the energy value chain. Regulatory frameworks, particularly those pushing for grid modernization, renewable energy integration, and enhanced safety standards, further stimulate PDM adoption. Competitive product substitutes are minimal, as PDM offers a proactive approach that surpasses traditional reactive maintenance strategies. End-user demographics are diverse, encompassing utilities, oil and gas exploration and production, renewable energy generation, and energy transmission and distribution companies. Mergers and acquisitions (M&A) are moderately active, as larger players acquire specialized PDM providers to expand their solution portfolios and market reach.
- Market Concentration: Moderately concentrated, with a few key players holding significant market share.
- Technological Innovation Drivers: AI, ML, IoT, Big Data, Digital Twins, Edge Computing.
- Regulatory Frameworks: Grid modernization mandates, renewable energy incentives, safety regulations, environmental compliance.
- Competitive Product Substitutes: Limited, with PDM significantly outperforming traditional reactive maintenance.
- End-User Demographics: Utilities, Oil & Gas, Renewable Energy (Solar, Wind), Transmission & Distribution.
- M&A Trends: Strategic acquisitions to enhance capabilities and market presence.
PDM in the Energy Market Growth Trends & Insights
The PDM in the Energy Market is poised for robust growth, driven by the escalating need for operational efficiency, cost reduction, and enhanced reliability across the energy sector. The market size evolution is projected to witness a significant upward trajectory, fueled by the increasing adoption of IoT devices for real-time data collection and the sophisticated application of AI and ML algorithms for predictive analytics. Adoption rates are accelerating as energy companies recognize the substantial return on investment (ROI) from preventing unplanned outages, extending asset lifespans, and optimizing maintenance schedules. Technological disruptions, including the maturation of digital twin technologies and the integration of edge computing for on-site data processing, are further propelling market expansion. Consumer behavior shifts are evident, with a growing demand for uninterrupted energy supply and a greater emphasis on sustainable and efficient energy management. This evolving landscape necessitates proactive maintenance strategies, making PDM an indispensable component of modern energy operations. The market is expected to exhibit a Compound Annual Growth Rate (CAGR) of approximately 18.5% during the forecast period. Market penetration for PDM solutions is projected to reach over 65% of major energy asset portfolios by 2033.
- Market Size Evolution: Significant expansion driven by digitalization and AI integration.
- Adoption Rates: Steadily increasing across all energy sub-sectors due to clear ROI.
- Technological Disruptions: Digital Twins, Edge Computing, advanced sensor technologies.
- Consumer Behavior Shifts: Demand for reliability, sustainability, and efficient energy consumption.
- CAGR: Estimated at 18.5% (2025-2033).
- Market Penetration: Anticipated to exceed 65% by 2033.
Dominant Regions, Countries, or Segments in PDM in the Energy Market
North America currently dominates the PDM in the Energy Market, driven by its mature energy infrastructure, significant investments in grid modernization, and a strong emphasis on technological innovation. The United States, in particular, leads with widespread adoption of AI and IoT solutions across its vast oil and gas, utility, and renewable energy sectors. Government initiatives supporting digital transformation and energy efficiency further bolster this dominance.
Key Drivers of Dominance in North America:
- Technological Advancement: High concentration of AI and IoT solution providers.
- Infrastructure Investment: Substantial spending on grid modernization and digital transformation.
- Regulatory Support: Favorable policies promoting energy efficiency and reliability.
- Industry Leadership: Early adoption and development of cutting-edge PDM technologies.
The Offering segment of Solutions holds the largest market share within the PDM in the Energy Market. These solutions encompass software platforms, analytics engines, and integrated systems designed for real-time monitoring, data analysis, and predictive modeling. The Cloud deployment model is rapidly gaining traction and is projected to overtake on-premise solutions in the coming years due to its scalability, cost-effectiveness, and ease of integration. Cloud-based PDM allows for more agile data management and analysis, crucial for the vast and dynamic datasets generated in the energy sector.
Dominant Segments:
- Offering: Solutions (comprising software, analytics, and integrated platforms).
- Deployment Model: Cloud deployment is emerging as the dominant model, offering scalability and cost-efficiency, projected to surpass On-premise by 2028.
Europe follows closely, with a strong focus on renewable energy integration and stringent environmental regulations driving PDM adoption. Countries like Germany and the UK are at the forefront of implementing smart grid technologies and predictive maintenance for wind and solar farms. The Asia Pacific region is witnessing the fastest growth, fueled by rapidly expanding energy demand, significant investments in new infrastructure, and government support for digitalizing the energy sector, particularly in countries like China and India.
PDM in the Energy Market Product Landscape
The PDM in the Energy Market product landscape is defined by sophisticated software platforms and integrated hardware solutions. Innovations focus on enhancing the accuracy and comprehensiveness of predictive analytics. Key products include AI-powered monitoring systems, real-time data analytics dashboards, and digital twin platforms that create virtual replicas of physical assets. These products leverage sensor data, historical performance, and external factors to forecast potential failures with high precision. Unique selling propositions often revolve around advanced anomaly detection algorithms, seamless integration with existing SCADA and enterprise systems, and customizable reporting features. Technological advancements are continuously improving the predictive capabilities, enabling early identification of subtle deviations and minimizing unforeseen disruptions.
Key Drivers, Barriers & Challenges in PDM in the Energy Market
Key Drivers:
- Cost Reduction: Minimizing unplanned downtime and associated repair costs.
- Enhanced Reliability: Ensuring consistent energy supply and grid stability.
- Asset Lifecycle Management: Extending the operational life of critical energy infrastructure.
- Safety Improvement: Proactively identifying and mitigating potential hazards.
- Regulatory Compliance: Meeting increasing demands for operational efficiency and environmental standards.
Barriers & Challenges:
- High Initial Investment: Significant upfront costs for hardware, software, and implementation.
- Data Integration Complexity: Challenges in integrating diverse data sources from legacy systems.
- Cybersecurity Concerns: Protecting sensitive operational data from cyber threats.
- Skills Gap: Shortage of skilled personnel for PDM implementation and management.
- Resistance to Change: Overcoming organizational inertia and traditional maintenance practices.
Emerging Opportunities in PDM in the Energy Market
Emerging opportunities in the PDM in the Energy Market are centered around the expanding use of AI and ML in granular asset monitoring, particularly for decentralized energy resources like distributed solar and battery storage systems. The integration of PDM with cybersecurity solutions presents a significant avenue for growth, addressing the critical need for secure energy infrastructure. Furthermore, the development of low-code/no-code PDM platforms is democratizing access to predictive analytics, enabling smaller energy providers and specialized service companies to leverage these technologies. The increasing focus on the circular economy also opens opportunities for PDM to optimize resource utilization and waste reduction throughout the energy asset lifecycle.
Growth Accelerators in the PDM in the Energy Market Industry
Growth accelerators in the PDM in the Energy Market industry are primarily driven by rapid advancements in AI and IoT technologies, making data collection and analysis more efficient and insightful. Strategic partnerships between PDM providers, cloud service providers, and energy companies are fostering ecosystem development and accelerating solution deployment. Furthermore, the increasing global push towards renewable energy sources necessitates advanced maintenance strategies to ensure the reliability of intermittent power generation, acting as a significant growth catalyst. Market expansion into developing economies, where energy infrastructure is still being built out, presents a substantial opportunity for the widespread adoption of PDM from the outset.
Key Players Shaping the PDM in the Energy Market Market
- ABB Ltd
- Accenture PLC
- IBM Corporation
- GE Automation & Control
- Siemens AG
- Banner Engineering Corp
- Schneider Electric
- Robert Bosch GmbH
- Intel Corporation
- SAP SE
Notable Milestones in PDM in the Energy Market Sector
- September 2022: Atlas AI partnered with the Rockefeller Foundation, leveraging satellite data and ML to address the green infrastructure investment gap in Sub-Saharan African countries like Kenya, Rwanda, Uganda, and Nigeria, highlighting the role of predictive analytics in climate action.
- June 2022: Hinduja Tech entered the IoT market with Senseye, offering AI-powered solutions for machine reliability and predictive maintenance, integrating digital services and SAP automotive solutions to predict machine failure.
- February 2022: The European Union announced a EUR 1.6 billion (USD 1,690 million) investment in Morocco's green energy sector, signaling a growing trend towards green and digital transitions and expected increased popularity for predictive maintenance solutions.
In-Depth PDM in the Energy Market Market Outlook
The PDM in the Energy Market outlook is exceptionally promising, characterized by sustained innovation and expanding application across the energy spectrum. The convergence of AI, IoT, and cloud computing will continue to drive the development of more intelligent and autonomous predictive maintenance systems. Strategic collaborations and the increasing adoption of PDM in renewable energy sectors, alongside traditional oil and gas, will fuel market growth. As energy grids become more complex and interconnected, the demand for robust and proactive asset management solutions will escalate, positioning PDM as a critical enabler of grid resilience, operational efficiency, and sustainable energy future. The market is set to witness significant expansion driven by digital transformation initiatives and the imperative for reliable energy delivery.
PDM in the Energy Market Segmentation
-
1. Offering
- 1.1. Solutions
- 1.2. Services
-
2. Deployment Model
- 2.1. On-premise
- 2.2. Cloud
PDM in the Energy Market Segmentation By Geography
-
1. North America
- 1.1. United States
- 1.2. Canada
- 1.3. Mexico
-
2. South America
- 2.1. Brazil
- 2.2. Argentina
- 2.3. Rest of South America
-
3. Europe
- 3.1. United Kingdom
- 3.2. Germany
- 3.3. France
- 3.4. Italy
- 3.5. Spain
- 3.6. Russia
- 3.7. Benelux
- 3.8. Nordics
- 3.9. Rest of Europe
-
4. Middle East & Africa
- 4.1. Turkey
- 4.2. Israel
- 4.3. GCC
- 4.4. North Africa
- 4.5. South Africa
- 4.6. Rest of Middle East & Africa
-
5. Asia Pacific
- 5.1. China
- 5.2. India
- 5.3. Japan
- 5.4. South Korea
- 5.5. ASEAN
- 5.6. Oceania
- 5.7. Rest of Asia Pacific
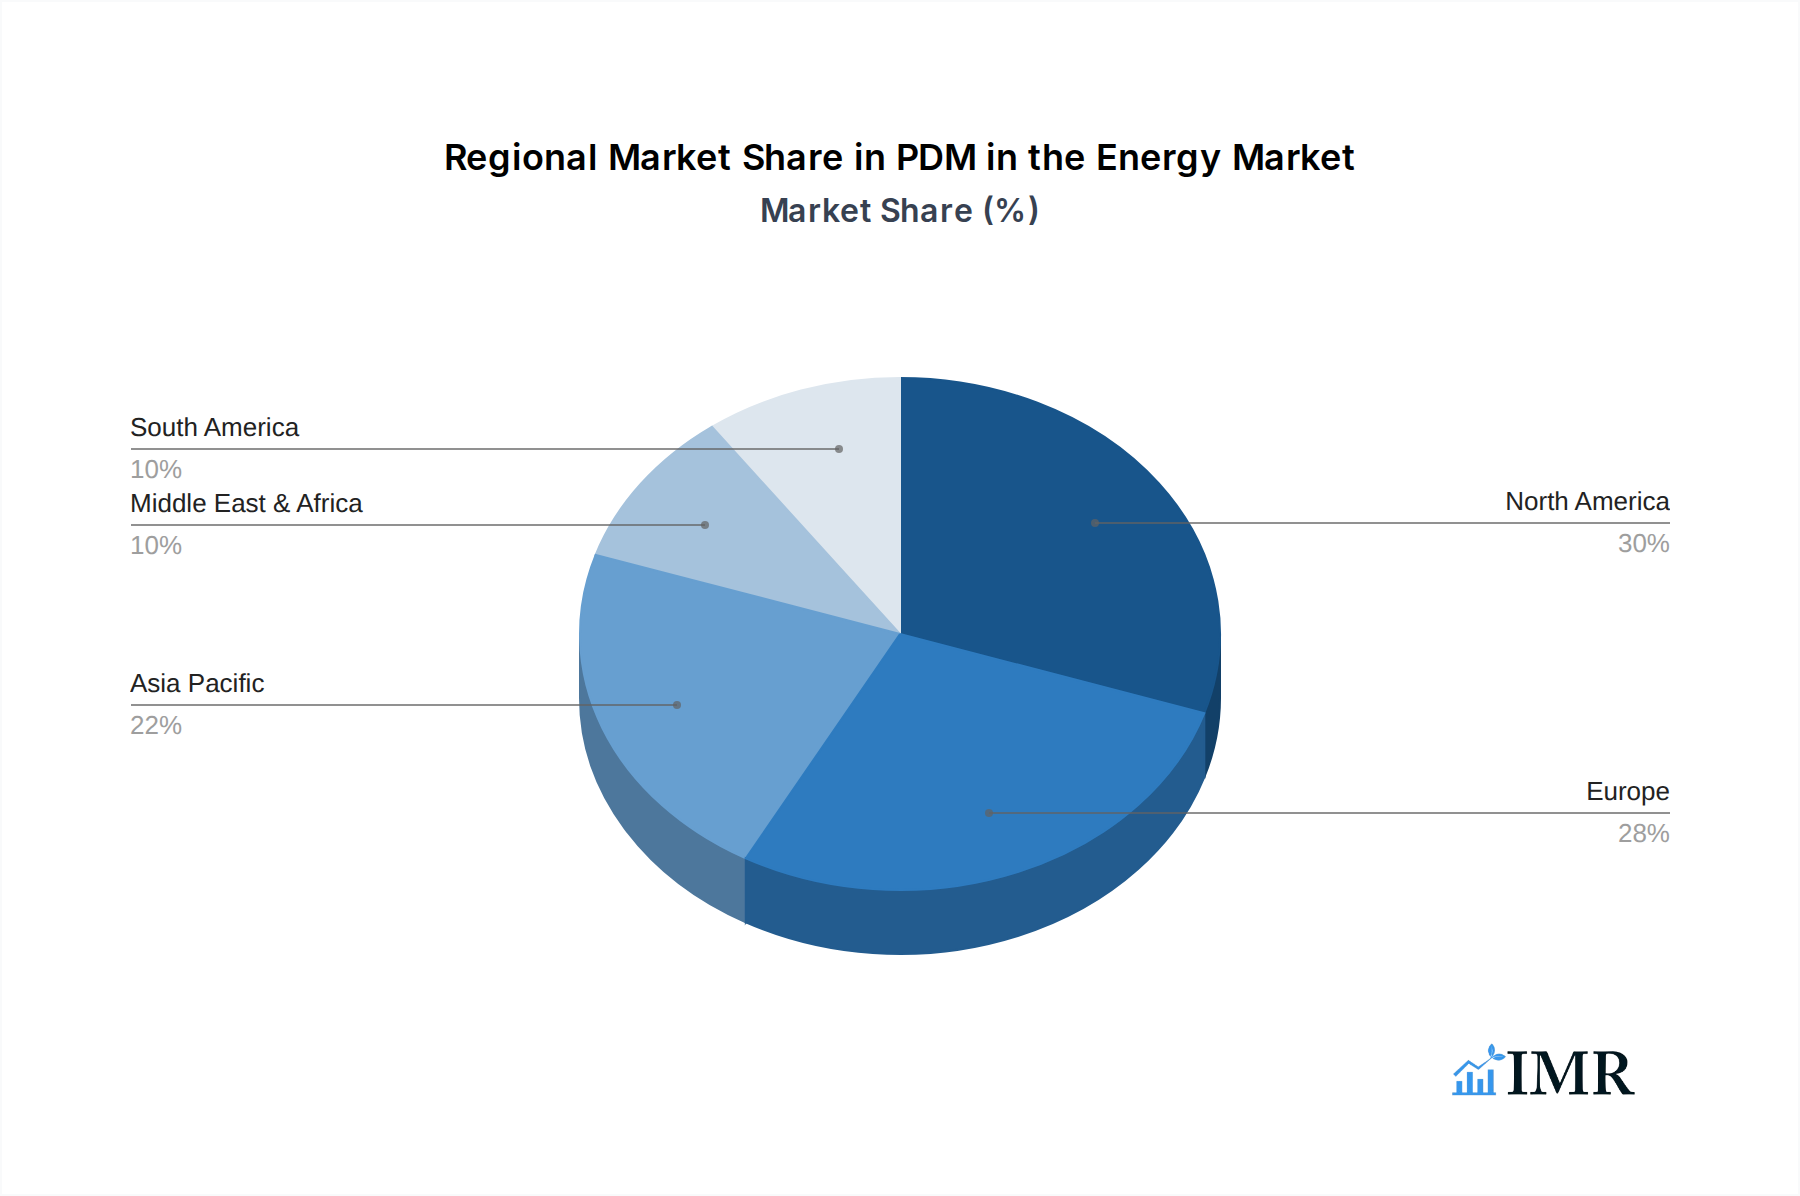
PDM in the Energy Market Regional Market Share
Geographic Coverage of PDM in the Energy Market
PDM in the Energy Market REPORT HIGHLIGHTS
| Aspects | Details |
|---|---|
| Study Period | 2020-2034 |
| Base Year | 2025 |
| Estimated Year | 2026 |
| Forecast Period | 2026-2034 |
| Historical Period | 2020-2025 |
| Growth Rate | CAGR of 25.77% from 2020-2034 |
| Segmentation |
|
Table of Contents
- 1. Introduction
- 1.1. Research Scope
- 1.2. Market Segmentation
- 1.3. Research Objective
- 1.4. Definitions and Assumptions
- 2. Executive Summary
- 2.1. Market Snapshot
- 3. Market Dynamics
- 3.1. Market Drivers
- 3.2. Market Restrains
- 3.3. Market Trends
- 3.4. Market Opportunities
- 4. Market Factor Analysis
- 4.1. Porters Five Forces
- 4.1.1. Bargaining Power of Suppliers
- 4.1.2. Bargaining Power of Buyers
- 4.1.3. Threat of New Entrants
- 4.1.4. Threat of Substitutes
- 4.1.5. Competitive Rivalry
- 4.2. PESTEL analysis
- 4.3. BCG Analysis
- 4.3.1. Stars (High Growth, High Market Share)
- 4.3.2. Cash Cows (Low Growth, High Market Share)
- 4.3.3. Question Mark (High Growth, Low Market Share)
- 4.3.4. Dogs (Low Growth, Low Market Share)
- 4.4. Ansoff Matrix Analysis
- 4.5. Supply Chain Analysis
- 4.6. Regulatory Landscape
- 4.7. Current Market Potential and Opportunity Assessment (TAM–SAM–SOM Framework)
- 4.8. IMR Analyst Note
- 4.1. Porters Five Forces
- 5. Market Analysis, Insights and Forecast 2021-2033
- 5.1. Market Analysis, Insights and Forecast - by Offering
- 5.1.1. Solutions
- 5.1.2. Services
- 5.2. Market Analysis, Insights and Forecast - by Deployment Model
- 5.2.1. On-premise
- 5.2.2. Cloud
- 5.3. Market Analysis, Insights and Forecast - by Region
- 5.3.1. North America
- 5.3.2. South America
- 5.3.3. Europe
- 5.3.4. Middle East & Africa
- 5.3.5. Asia Pacific
- 5.1. Market Analysis, Insights and Forecast - by Offering
- 6. Global PDM in the Energy Market Analysis, Insights and Forecast, 2021-2033
- 6.1. Market Analysis, Insights and Forecast - by Offering
- 6.1.1. Solutions
- 6.1.2. Services
- 6.2. Market Analysis, Insights and Forecast - by Deployment Model
- 6.2.1. On-premise
- 6.2.2. Cloud
- 6.1. Market Analysis, Insights and Forecast - by Offering
- 7. North America PDM in the Energy Market Analysis, Insights and Forecast, 2020-2032
- 7.1. Market Analysis, Insights and Forecast - by Offering
- 7.1.1. Solutions
- 7.1.2. Services
- 7.2. Market Analysis, Insights and Forecast - by Deployment Model
- 7.2.1. On-premise
- 7.2.2. Cloud
- 7.1. Market Analysis, Insights and Forecast - by Offering
- 8. South America PDM in the Energy Market Analysis, Insights and Forecast, 2020-2032
- 8.1. Market Analysis, Insights and Forecast - by Offering
- 8.1.1. Solutions
- 8.1.2. Services
- 8.2. Market Analysis, Insights and Forecast - by Deployment Model
- 8.2.1. On-premise
- 8.2.2. Cloud
- 8.1. Market Analysis, Insights and Forecast - by Offering
- 9. Europe PDM in the Energy Market Analysis, Insights and Forecast, 2020-2032
- 9.1. Market Analysis, Insights and Forecast - by Offering
- 9.1.1. Solutions
- 9.1.2. Services
- 9.2. Market Analysis, Insights and Forecast - by Deployment Model
- 9.2.1. On-premise
- 9.2.2. Cloud
- 9.1. Market Analysis, Insights and Forecast - by Offering
- 10. Middle East & Africa PDM in the Energy Market Analysis, Insights and Forecast, 2020-2032
- 10.1. Market Analysis, Insights and Forecast - by Offering
- 10.1.1. Solutions
- 10.1.2. Services
- 10.2. Market Analysis, Insights and Forecast - by Deployment Model
- 10.2.1. On-premise
- 10.2.2. Cloud
- 10.1. Market Analysis, Insights and Forecast - by Offering
- 11. Asia Pacific PDM in the Energy Market Analysis, Insights and Forecast, 2020-2032
- 11.1. Market Analysis, Insights and Forecast - by Offering
- 11.1.1. Solutions
- 11.1.2. Services
- 11.2. Market Analysis, Insights and Forecast - by Deployment Model
- 11.2.1. On-premise
- 11.2.2. Cloud
- 11.1. Market Analysis, Insights and Forecast - by Offering
- 12. Competitive Analysis
- 12.1. Company Profiles
- 12.1.1 ABB Ltd
- 12.1.1.1. Company Overview
- 12.1.1.2. Products
- 12.1.1.3. Company Financials
- 12.1.1.4. SWOT Analysis
- 12.1.2 Accenture PLC
- 12.1.2.1. Company Overview
- 12.1.2.2. Products
- 12.1.2.3. Company Financials
- 12.1.2.4. SWOT Analysis
- 12.1.3 IBM Corporation
- 12.1.3.1. Company Overview
- 12.1.3.2. Products
- 12.1.3.3. Company Financials
- 12.1.3.4. SWOT Analysis
- 12.1.4 GE Automation & Control*List Not Exhaustive
- 12.1.4.1. Company Overview
- 12.1.4.2. Products
- 12.1.4.3. Company Financials
- 12.1.4.4. SWOT Analysis
- 12.1.5 Siemens AG
- 12.1.5.1. Company Overview
- 12.1.5.2. Products
- 12.1.5.3. Company Financials
- 12.1.5.4. SWOT Analysis
- 12.1.6 Banner Engineering Corp
- 12.1.6.1. Company Overview
- 12.1.6.2. Products
- 12.1.6.3. Company Financials
- 12.1.6.4. SWOT Analysis
- 12.1.7 Schneider Electric
- 12.1.7.1. Company Overview
- 12.1.7.2. Products
- 12.1.7.3. Company Financials
- 12.1.7.4. SWOT Analysis
- 12.1.8 Robert Bosch GmbH
- 12.1.8.1. Company Overview
- 12.1.8.2. Products
- 12.1.8.3. Company Financials
- 12.1.8.4. SWOT Analysis
- 12.1.9 Intel Corporation
- 12.1.9.1. Company Overview
- 12.1.9.2. Products
- 12.1.9.3. Company Financials
- 12.1.9.4. SWOT Analysis
- 12.1.10 SAP SE
- 12.1.10.1. Company Overview
- 12.1.10.2. Products
- 12.1.10.3. Company Financials
- 12.1.10.4. SWOT Analysis
- 12.1.1 ABB Ltd
- 12.2. Market Entropy
- 12.2.1 Company's Key Areas Served
- 12.2.2 Recent Developments
- 12.3. Company Market Share Analysis 2025
- 12.3.1 Top 5 Companies Market Share Analysis
- 12.3.2 Top 3 Companies Market Share Analysis
- 12.4. List of Potential Customers
- 13. Research Methodology
List of Figures
- Figure 1: Global PDM in the Energy Market Revenue Breakdown (Million, %) by Region 2025 & 2033
- Figure 2: North America PDM in the Energy Market Revenue (Million), by Offering 2025 & 2033
- Figure 3: North America PDM in the Energy Market Revenue Share (%), by Offering 2025 & 2033
- Figure 4: North America PDM in the Energy Market Revenue (Million), by Deployment Model 2025 & 2033
- Figure 5: North America PDM in the Energy Market Revenue Share (%), by Deployment Model 2025 & 2033
- Figure 6: North America PDM in the Energy Market Revenue (Million), by Country 2025 & 2033
- Figure 7: North America PDM in the Energy Market Revenue Share (%), by Country 2025 & 2033
- Figure 8: South America PDM in the Energy Market Revenue (Million), by Offering 2025 & 2033
- Figure 9: South America PDM in the Energy Market Revenue Share (%), by Offering 2025 & 2033
- Figure 10: South America PDM in the Energy Market Revenue (Million), by Deployment Model 2025 & 2033
- Figure 11: South America PDM in the Energy Market Revenue Share (%), by Deployment Model 2025 & 2033
- Figure 12: South America PDM in the Energy Market Revenue (Million), by Country 2025 & 2033
- Figure 13: South America PDM in the Energy Market Revenue Share (%), by Country 2025 & 2033
- Figure 14: Europe PDM in the Energy Market Revenue (Million), by Offering 2025 & 2033
- Figure 15: Europe PDM in the Energy Market Revenue Share (%), by Offering 2025 & 2033
- Figure 16: Europe PDM in the Energy Market Revenue (Million), by Deployment Model 2025 & 2033
- Figure 17: Europe PDM in the Energy Market Revenue Share (%), by Deployment Model 2025 & 2033
- Figure 18: Europe PDM in the Energy Market Revenue (Million), by Country 2025 & 2033
- Figure 19: Europe PDM in the Energy Market Revenue Share (%), by Country 2025 & 2033
- Figure 20: Middle East & Africa PDM in the Energy Market Revenue (Million), by Offering 2025 & 2033
- Figure 21: Middle East & Africa PDM in the Energy Market Revenue Share (%), by Offering 2025 & 2033
- Figure 22: Middle East & Africa PDM in the Energy Market Revenue (Million), by Deployment Model 2025 & 2033
- Figure 23: Middle East & Africa PDM in the Energy Market Revenue Share (%), by Deployment Model 2025 & 2033
- Figure 24: Middle East & Africa PDM in the Energy Market Revenue (Million), by Country 2025 & 2033
- Figure 25: Middle East & Africa PDM in the Energy Market Revenue Share (%), by Country 2025 & 2033
- Figure 26: Asia Pacific PDM in the Energy Market Revenue (Million), by Offering 2025 & 2033
- Figure 27: Asia Pacific PDM in the Energy Market Revenue Share (%), by Offering 2025 & 2033
- Figure 28: Asia Pacific PDM in the Energy Market Revenue (Million), by Deployment Model 2025 & 2033
- Figure 29: Asia Pacific PDM in the Energy Market Revenue Share (%), by Deployment Model 2025 & 2033
- Figure 30: Asia Pacific PDM in the Energy Market Revenue (Million), by Country 2025 & 2033
- Figure 31: Asia Pacific PDM in the Energy Market Revenue Share (%), by Country 2025 & 2033
List of Tables
- Table 1: Global PDM in the Energy Market Revenue Million Forecast, by Offering 2020 & 2033
- Table 2: Global PDM in the Energy Market Revenue Million Forecast, by Deployment Model 2020 & 2033
- Table 3: Global PDM in the Energy Market Revenue Million Forecast, by Region 2020 & 2033
- Table 4: Global PDM in the Energy Market Revenue Million Forecast, by Offering 2020 & 2033
- Table 5: Global PDM in the Energy Market Revenue Million Forecast, by Deployment Model 2020 & 2033
- Table 6: Global PDM in the Energy Market Revenue Million Forecast, by Country 2020 & 2033
- Table 7: United States PDM in the Energy Market Revenue (Million) Forecast, by Application 2020 & 2033
- Table 8: Canada PDM in the Energy Market Revenue (Million) Forecast, by Application 2020 & 2033
- Table 9: Mexico PDM in the Energy Market Revenue (Million) Forecast, by Application 2020 & 2033
- Table 10: Global PDM in the Energy Market Revenue Million Forecast, by Offering 2020 & 2033
- Table 11: Global PDM in the Energy Market Revenue Million Forecast, by Deployment Model 2020 & 2033
- Table 12: Global PDM in the Energy Market Revenue Million Forecast, by Country 2020 & 2033
- Table 13: Brazil PDM in the Energy Market Revenue (Million) Forecast, by Application 2020 & 2033
- Table 14: Argentina PDM in the Energy Market Revenue (Million) Forecast, by Application 2020 & 2033
- Table 15: Rest of South America PDM in the Energy Market Revenue (Million) Forecast, by Application 2020 & 2033
- Table 16: Global PDM in the Energy Market Revenue Million Forecast, by Offering 2020 & 2033
- Table 17: Global PDM in the Energy Market Revenue Million Forecast, by Deployment Model 2020 & 2033
- Table 18: Global PDM in the Energy Market Revenue Million Forecast, by Country 2020 & 2033
- Table 19: United Kingdom PDM in the Energy Market Revenue (Million) Forecast, by Application 2020 & 2033
- Table 20: Germany PDM in the Energy Market Revenue (Million) Forecast, by Application 2020 & 2033
- Table 21: France PDM in the Energy Market Revenue (Million) Forecast, by Application 2020 & 2033
- Table 22: Italy PDM in the Energy Market Revenue (Million) Forecast, by Application 2020 & 2033
- Table 23: Spain PDM in the Energy Market Revenue (Million) Forecast, by Application 2020 & 2033
- Table 24: Russia PDM in the Energy Market Revenue (Million) Forecast, by Application 2020 & 2033
- Table 25: Benelux PDM in the Energy Market Revenue (Million) Forecast, by Application 2020 & 2033
- Table 26: Nordics PDM in the Energy Market Revenue (Million) Forecast, by Application 2020 & 2033
- Table 27: Rest of Europe PDM in the Energy Market Revenue (Million) Forecast, by Application 2020 & 2033
- Table 28: Global PDM in the Energy Market Revenue Million Forecast, by Offering 2020 & 2033
- Table 29: Global PDM in the Energy Market Revenue Million Forecast, by Deployment Model 2020 & 2033
- Table 30: Global PDM in the Energy Market Revenue Million Forecast, by Country 2020 & 2033
- Table 31: Turkey PDM in the Energy Market Revenue (Million) Forecast, by Application 2020 & 2033
- Table 32: Israel PDM in the Energy Market Revenue (Million) Forecast, by Application 2020 & 2033
- Table 33: GCC PDM in the Energy Market Revenue (Million) Forecast, by Application 2020 & 2033
- Table 34: North Africa PDM in the Energy Market Revenue (Million) Forecast, by Application 2020 & 2033
- Table 35: South Africa PDM in the Energy Market Revenue (Million) Forecast, by Application 2020 & 2033
- Table 36: Rest of Middle East & Africa PDM in the Energy Market Revenue (Million) Forecast, by Application 2020 & 2033
- Table 37: Global PDM in the Energy Market Revenue Million Forecast, by Offering 2020 & 2033
- Table 38: Global PDM in the Energy Market Revenue Million Forecast, by Deployment Model 2020 & 2033
- Table 39: Global PDM in the Energy Market Revenue Million Forecast, by Country 2020 & 2033
- Table 40: China PDM in the Energy Market Revenue (Million) Forecast, by Application 2020 & 2033
- Table 41: India PDM in the Energy Market Revenue (Million) Forecast, by Application 2020 & 2033
- Table 42: Japan PDM in the Energy Market Revenue (Million) Forecast, by Application 2020 & 2033
- Table 43: South Korea PDM in the Energy Market Revenue (Million) Forecast, by Application 2020 & 2033
- Table 44: ASEAN PDM in the Energy Market Revenue (Million) Forecast, by Application 2020 & 2033
- Table 45: Oceania PDM in the Energy Market Revenue (Million) Forecast, by Application 2020 & 2033
- Table 46: Rest of Asia Pacific PDM in the Energy Market Revenue (Million) Forecast, by Application 2020 & 2033
Frequently Asked Questions
1. What is the projected Compound Annual Growth Rate (CAGR) of the PDM in the Energy Market?
The projected CAGR is approximately 25.77%.
2. Which companies are prominent players in the PDM in the Energy Market?
Key companies in the market include ABB Ltd, Accenture PLC, IBM Corporation, GE Automation & Control*List Not Exhaustive, Siemens AG, Banner Engineering Corp, Schneider Electric, Robert Bosch GmbH, Intel Corporation, SAP SE.
3. What are the main segments of the PDM in the Energy Market?
The market segments include Offering, Deployment Model.
4. Can you provide details about the market size?
The market size is estimated to be USD 1.79 Million as of 2022.
5. What are some drivers contributing to market growth?
Increasing Investments in the Energy Sector; Increasing Adoption of Automation.
6. What are the notable trends driving market growth?
Solutions Segment is Anticipated to Witness Significant Growth.
7. Are there any restraints impacting market growth?
Lack of Awareness About the Benefits of Sports Analytics Solutions.
8. Can you provide examples of recent developments in the market?
September 2022: Electricity Growth and Use in Developing Economies Atlas AI, a predictive analytics platform, partnered with the Rockefeller Foundation, a US-based energy research organization, to assist Sub-Saharan African countries such as Kenya, Rwanda, Uganda, and Nigeria in addressing the impending green infrastructure investment gap and accelerating climate action initiatives through the use of satellite data and machine learning (ML) technologies.
9. What pricing options are available for accessing the report?
Pricing options include single-user, multi-user, and enterprise licenses priced at USD 4750, USD 5250, and USD 8750 respectively.
10. Is the market size provided in terms of value or volume?
The market size is provided in terms of value, measured in Million.
11. Are there any specific market keywords associated with the report?
Yes, the market keyword associated with the report is "PDM in the Energy Market," which aids in identifying and referencing the specific market segment covered.
12. How do I determine which pricing option suits my needs best?
The pricing options vary based on user requirements and access needs. Individual users may opt for single-user licenses, while businesses requiring broader access may choose multi-user or enterprise licenses for cost-effective access to the report.
13. Are there any additional resources or data provided in the PDM in the Energy Market report?
While the report offers comprehensive insights, it's advisable to review the specific contents or supplementary materials provided to ascertain if additional resources or data are available.
14. How can I stay updated on further developments or reports in the PDM in the Energy Market?
To stay informed about further developments, trends, and reports in the PDM in the Energy Market, consider subscribing to industry newsletters, following relevant companies and organizations, or regularly checking reputable industry news sources and publications.
Methodology
Step 1 - Identification of Relevant Samples Size from Population Database


Step 2 - Approaches for Defining Global Market Size (Value, Volume* & Price*)

Note*: In applicable scenarios
Step 3 - Data Sources
Primary Research
- Web Analytics
- Survey Reports
- Research Institute
- Latest Research Reports
- Opinion Leaders
Secondary Research
- Annual Reports
- White Paper
- Latest Press Release
- Industry Association
- Paid Database
- Investor Presentations

Step 4 - Data Triangulation
Involves using different sources of information in order to increase the validity of a study
These sources are likely to be stakeholders in a program - participants, other researchers, program staff, other community members, and so on.
Then we put all data in single framework & apply various statistical tools to find out the dynamic on the market.
During the analysis stage, feedback from the stakeholder groups would be compared to determine areas of agreement as well as areas of divergence