

Key Insights
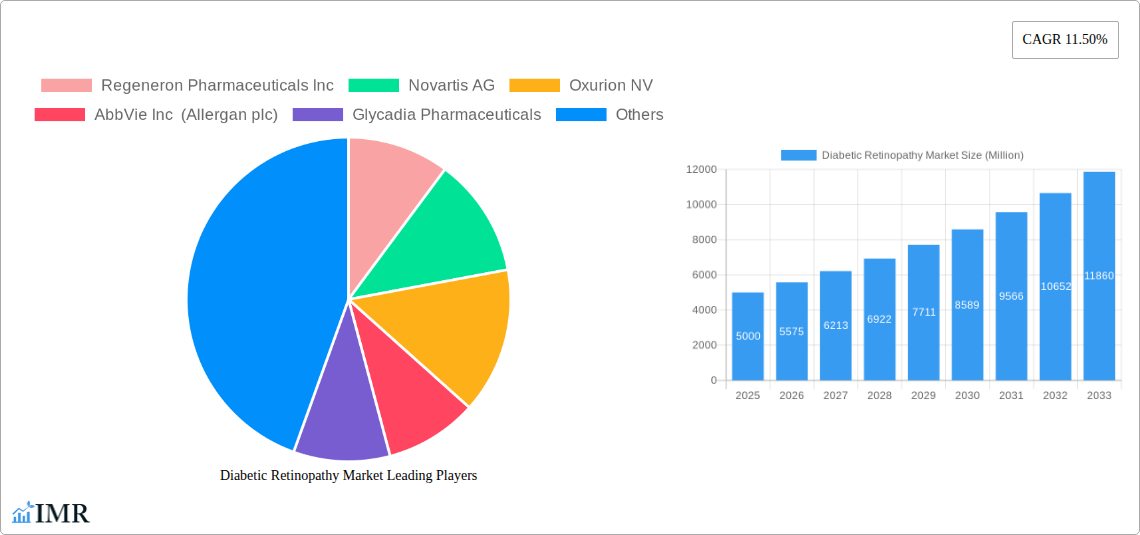
The global diabetic retinopathy market is experiencing robust growth, projected to reach a substantial size driven by the escalating prevalence of diabetes worldwide. The market's Compound Annual Growth Rate (CAGR) of 11.50% from 2019 to 2024 indicates significant market expansion. This growth is fueled by several factors, including the rising geriatric population, increasing awareness about diabetic retinopathy and its complications, and advancements in treatment modalities. The availability of effective therapies such as anti-VEGF drugs, intraocular steroid injections, laser surgery, and vitrectomy significantly impacts market expansion. While the specific market size for 2025 is not provided, extrapolating from the 11.50% CAGR and a presumed 2024 market size (based on typical market growth patterns), a reasonable estimate for the 2025 market size would be in the billions of USD. Furthermore, the segmentation by treatment approach highlights the dominant role of anti-VEGF drugs, followed by other treatments. This underscores the ongoing focus on developing and improving these therapies. Regional variations exist; North America, with its advanced healthcare infrastructure and higher diabetes prevalence, likely commands a significant market share. However, the Asia-Pacific region is expected to witness rapid growth fueled by rising diabetes cases and increasing healthcare spending.
Market restraints include the high cost of advanced treatments, unequal access to quality healthcare in developing countries, and the need for frequent follow-up visits and monitoring for effective management. Despite these constraints, the continued innovation in diagnostic tools and therapeutic interventions, along with increased government initiatives to improve diabetes care, will contribute to sustained market growth. Proliferative diabetic retinopathy, being a more severe form, will likely command a larger share of the market due to its greater need for intensive medical intervention. The competitive landscape is characterized by the presence of major pharmaceutical companies, engaged in extensive research and development, along with the emergence of smaller biotech firms focusing on innovative treatment approaches. The forecast period (2025-2033) promises continued expansion for the global diabetic retinopathy market driven by increased awareness, improved treatment options and the persistent rise in diabetes incidence.
Diabetic Retinopathy Market Report: 2019-2033
This comprehensive report provides an in-depth analysis of the Diabetic Retinopathy Market, encompassing market dynamics, growth trends, regional analysis, product landscape, key players, and future outlook. The study period covers 2019-2033, with a base year of 2025 and a forecast period of 2025-2033. The report segments the market by Type (Proliferative Diabetic Retinopathy, Non-proliferative Retinopathy) and Management Approach (Anti-VEGF Drug, Intraocular Steroid Injection, Laser Surgery, Vitrectomy). The market is projected to reach xx Million by 2033, showcasing significant growth opportunities for stakeholders.
Diabetic Retinopathy Market Dynamics & Structure
The Diabetic Retinopathy market is characterized by a moderately concentrated landscape with several key players vying for market share. Technological innovation, particularly in drug delivery systems and diagnostic tools, is a major growth driver. Stringent regulatory frameworks, however, pose challenges to market entry and product approvals. The market also faces competition from substitute treatments and alternative management approaches. The end-user demographic is largely comprised of aging populations with a high prevalence of diabetes. M&A activity has been moderate, with several companies focusing on strategic partnerships and collaborations rather than large-scale acquisitions.
- Market Concentration: Moderately concentrated, with top 5 players holding approximately xx% market share (2025).
- Technological Innovation: Focus on developing novel therapies (e.g., gene therapy) and improving drug delivery methods.
- Regulatory Framework: Stringent FDA and EMA approvals impact market entry and timelines.
- Competitive Substitutes: Alternative treatments and management approaches pose competitive pressure.
- End-User Demographics: Aging population with rising diabetes prevalence drives demand.
- M&A Trends: Moderate M&A activity; strategic partnerships prevalent over large acquisitions. Estimated xx M&A deals in the period 2019-2024.
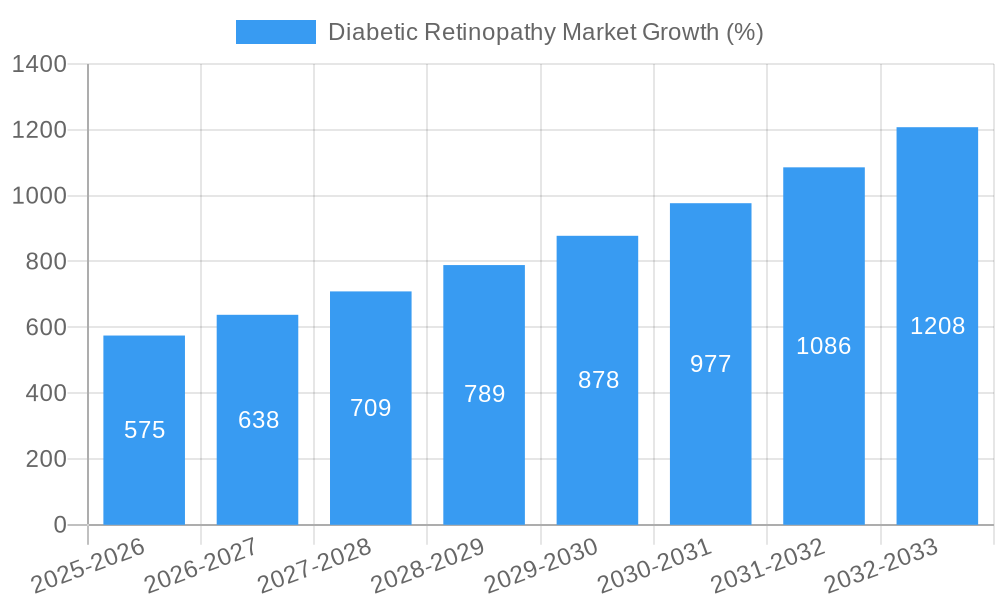
Diabetic Retinopathy Market Growth Trends & Insights
The global Diabetic Retinopathy market witnessed substantial growth during the historical period (2019-2024), driven by increasing prevalence of diabetes, improved diagnostic capabilities, and advancements in treatment modalities. The market size expanded from xx Million in 2019 to xx Million in 2024, registering a CAGR of xx%. The adoption rate of novel therapies like Anti-VEGF drugs is rising steadily, contributing significantly to market growth. Technological disruptions, such as the development of gene therapies and AI-powered diagnostic tools, are expected to further accelerate market expansion. Consumer behavior shifts, focusing on proactive disease management and improved quality of life, are also fueling demand. Market penetration of Anti-VEGF drugs is expected to reach xx% by 2033.
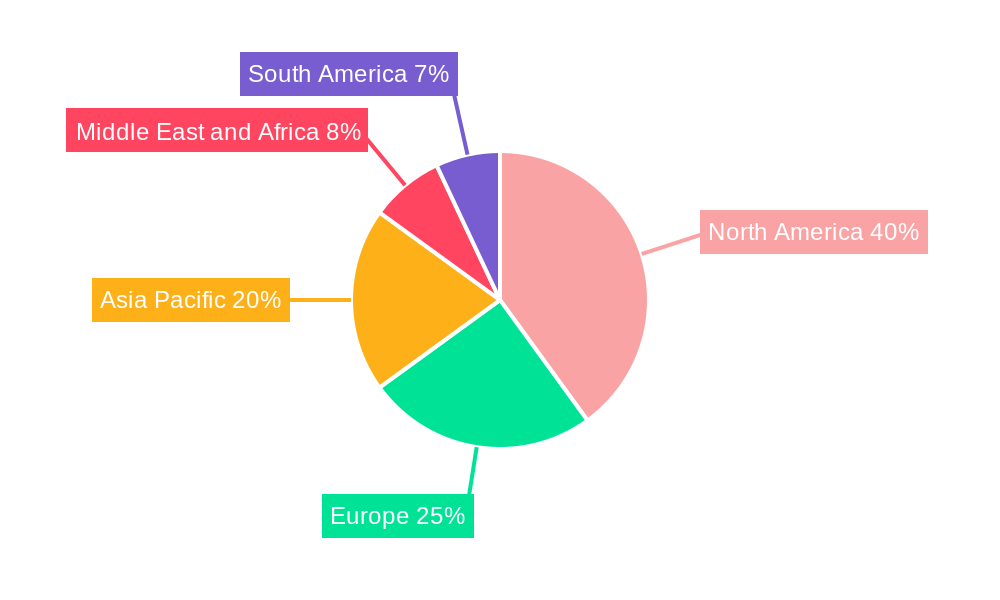
Dominant Regions, Countries, or Segments in Diabetic Retinopathy Market
North America currently holds the largest market share in the Diabetic Retinopathy market, driven by high prevalence of diabetes, advanced healthcare infrastructure, and strong regulatory support. Within North America, the United States dominates, accounting for approximately xx% of the regional market. The Anti-VEGF drug segment constitutes the largest portion of the management approach category, attributed to its effectiveness and widespread adoption. Proliferative Diabetic Retinopathy represents a substantial segment due to its severity and treatment needs.
- Key Drivers in North America: High prevalence of diabetes, well-established healthcare infrastructure, strong R&D investments.
- Europe Market Growth: Driven by rising diabetes prevalence and increasing healthcare expenditure.
- Asia-Pacific Market Potential: Significant growth potential due to large diabetic population and improving healthcare access.
- Anti-VEGF Drug Segment Dominance: High efficacy and widespread adoption drive market share.
- Proliferative Diabetic Retinopathy Segment: Large segment due to disease severity and treatment requirements.
Diabetic Retinopathy Market Product Landscape
The Diabetic Retinopathy market features a diverse range of products, including Anti-VEGF drugs (e.g., aflibercept, ranibizumab), intraocular steroid injections, laser treatment devices, and vitrectomy equipment. Recent innovations include novel drug delivery systems, improved imaging techniques for early detection, and minimally invasive surgical procedures. These advancements offer improved treatment outcomes, reduced side effects, and enhanced patient convenience. Unique selling propositions focus on efficacy, safety, and ease of administration.
Key Drivers, Barriers & Challenges in Diabetic Retinopathy Market
Key Drivers:
- Rising prevalence of diabetes globally.
- Technological advancements in treatment and diagnostics.
- Increased awareness and early detection initiatives.
- Favorable reimbursement policies in developed countries.
Challenges and Restraints:
- High cost of advanced therapies, limiting access in low- and middle-income countries.
- Potential side effects associated with certain treatments.
- Stringent regulatory approvals prolonging product launches.
- Competition from alternative treatment approaches.
Emerging Opportunities in Diabetic Retinopathy Market
- Untapped markets in developing economies with high diabetes prevalence.
- Development of personalized medicine approaches tailored to individual patient needs.
- Expansion of telemedicine for remote monitoring and diagnosis.
- Integration of AI and machine learning for improved disease management.
Growth Accelerators in the Diabetic Retinopathy Market Industry
Long-term growth in the Diabetic Retinopathy market will be fueled by continuous technological breakthroughs in drug development and delivery systems, strategic partnerships between pharmaceutical companies and medical device manufacturers, and the expansion of market reach into underserved populations through global healthcare initiatives.
Key Players Shaping the Diabetic Retinopathy Market Market
- Regeneron Pharmaceuticals Inc
- Novartis AG
- Oxurion NV
- AbbVie Inc (Allergan plc)
- Glycadia Pharmaceuticals
- Alimera Sciences
- BCN Peptides
- F Hoffmann-La Roche Ltd (Genentech)
- Ocuphire Pharma
Notable Milestones in Diabetic Retinopathy Market Sector
- June 2022: Regeneron Pharmaceuticals, Inc. announced FDA acceptance of EYLEA sBLA for a 16-week 2 mg dosing regimen.
- February 2022: REGENXBIO Inc. announced positive interim data from the Phase II ALTITUDE trial of RGX-314.
In-Depth Diabetic Retinopathy Market Market Outlook
The Diabetic Retinopathy market is poised for significant growth over the forecast period (2025-2033), driven by sustained technological innovation, expanding access to healthcare, and rising awareness about the disease. Strategic partnerships and collaborations amongst key players are expected to further accelerate market expansion. The market offers promising opportunities for companies focusing on developing novel therapies, improving diagnostic tools, and providing cost-effective treatment solutions.
Diabetic Retinopathy Market Segmentation
-
1. Type
- 1.1. Proliferative Diabetic Retinopathy
- 1.2. Non-proliferative Retinopathy
-
2. Management Approach
- 2.1. Anti-VEGF Drug
- 2.2. Intraocular Steroid Injection
- 2.3. Laser Surgery
- 2.4. Vitrectomy
Diabetic Retinopathy Market Segmentation By Geography
-
1. North America
- 1.1. United States
- 1.2. Canada
- 1.3. Mexico
-
2. Europe
- 2.1. Germany
- 2.2. United Kingdom
- 2.3. France
- 2.4. Italy
- 2.5. Spain
- 2.6. Rest of Europe
-
3. Asia Pacific
- 3.1. China
- 3.2. Japan
- 3.3. India
- 3.4. Australia
- 3.5. South Korea
- 3.6. Rest of Asia Pacific
-
4. Middle East and Africa
- 4.1. GCC
- 4.2. South Africa
- 4.3. Rest of Middle East and Africa
-
5. South America
- 5.1. Brazil
- 5.2. Argentina
- 5.3. Rest of South America
Diabetic Retinopathy Market REPORT HIGHLIGHTS
| Aspects | Details |
|---|---|
| Study Period | 2019-2033 |
| Base Year | 2024 |
| Estimated Year | 2025 |
| Forecast Period | 2025-2033 |
| Historical Period | 2019-2024 |
| Growth Rate | CAGR of 11.50% from 2019-2033 |
| Segmentation |
|
Table of Contents
- 1. Introduction
- 1.1. Research Scope
- 1.2. Market Segmentation
- 1.3. Research Methodology
- 1.4. Definitions and Assumptions
- 2. Executive Summary
- 2.1. Introduction
- 3. Market Dynamics
- 3.1. Introduction
- 3.2. Market Drivers
- 3.2.1. Rising Prevalence of Diabetes and Blindness Due to The Same; Growing Geriatric Population Base; Increasing Technological Advancements in Diabetic Retinopathy Surgical Instruments
- 3.3. Market Restrains
- 3.3.1. Lack of Skilled Ophthalmologists; Extended Approval Time for Drugs
- 3.4. Market Trends
- 3.4.1. Proliferative diabetic retinopathy is Expected to Hold Significant Market Share in the Type Segment
- 4. Market Factor Analysis
- 4.1. Porters Five Forces
- 4.2. Supply/Value Chain
- 4.3. PESTEL analysis
- 4.4. Market Entropy
- 4.5. Patent/Trademark Analysis
- 5. Global Diabetic Retinopathy Market Analysis, Insights and Forecast, 2019-2031
- 5.1. Market Analysis, Insights and Forecast - by Type
- 5.1.1. Proliferative Diabetic Retinopathy
- 5.1.2. Non-proliferative Retinopathy
- 5.2. Market Analysis, Insights and Forecast - by Management Approach
- 5.2.1. Anti-VEGF Drug
- 5.2.2. Intraocular Steroid Injection
- 5.2.3. Laser Surgery
- 5.2.4. Vitrectomy
- 5.3. Market Analysis, Insights and Forecast - by Region
- 5.3.1. North America
- 5.3.2. Europe
- 5.3.3. Asia Pacific
- 5.3.4. Middle East and Africa
- 5.3.5. South America
- 5.1. Market Analysis, Insights and Forecast - by Type
- 6. North America Diabetic Retinopathy Market Analysis, Insights and Forecast, 2019-2031
- 6.1. Market Analysis, Insights and Forecast - by Type
- 6.1.1. Proliferative Diabetic Retinopathy
- 6.1.2. Non-proliferative Retinopathy
- 6.2. Market Analysis, Insights and Forecast - by Management Approach
- 6.2.1. Anti-VEGF Drug
- 6.2.2. Intraocular Steroid Injection
- 6.2.3. Laser Surgery
- 6.2.4. Vitrectomy
- 6.1. Market Analysis, Insights and Forecast - by Type
- 7. Europe Diabetic Retinopathy Market Analysis, Insights and Forecast, 2019-2031
- 7.1. Market Analysis, Insights and Forecast - by Type
- 7.1.1. Proliferative Diabetic Retinopathy
- 7.1.2. Non-proliferative Retinopathy
- 7.2. Market Analysis, Insights and Forecast - by Management Approach
- 7.2.1. Anti-VEGF Drug
- 7.2.2. Intraocular Steroid Injection
- 7.2.3. Laser Surgery
- 7.2.4. Vitrectomy
- 7.1. Market Analysis, Insights and Forecast - by Type
- 8. Asia Pacific Diabetic Retinopathy Market Analysis, Insights and Forecast, 2019-2031
- 8.1. Market Analysis, Insights and Forecast - by Type
- 8.1.1. Proliferative Diabetic Retinopathy
- 8.1.2. Non-proliferative Retinopathy
- 8.2. Market Analysis, Insights and Forecast - by Management Approach
- 8.2.1. Anti-VEGF Drug
- 8.2.2. Intraocular Steroid Injection
- 8.2.3. Laser Surgery
- 8.2.4. Vitrectomy
- 8.1. Market Analysis, Insights and Forecast - by Type
- 9. Middle East and Africa Diabetic Retinopathy Market Analysis, Insights and Forecast, 2019-2031
- 9.1. Market Analysis, Insights and Forecast - by Type
- 9.1.1. Proliferative Diabetic Retinopathy
- 9.1.2. Non-proliferative Retinopathy
- 9.2. Market Analysis, Insights and Forecast - by Management Approach
- 9.2.1. Anti-VEGF Drug
- 9.2.2. Intraocular Steroid Injection
- 9.2.3. Laser Surgery
- 9.2.4. Vitrectomy
- 9.1. Market Analysis, Insights and Forecast - by Type
- 10. South America Diabetic Retinopathy Market Analysis, Insights and Forecast, 2019-2031
- 10.1. Market Analysis, Insights and Forecast - by Type
- 10.1.1. Proliferative Diabetic Retinopathy
- 10.1.2. Non-proliferative Retinopathy
- 10.2. Market Analysis, Insights and Forecast - by Management Approach
- 10.2.1. Anti-VEGF Drug
- 10.2.2. Intraocular Steroid Injection
- 10.2.3. Laser Surgery
- 10.2.4. Vitrectomy
- 10.1. Market Analysis, Insights and Forecast - by Type
- 11. North America Diabetic Retinopathy Market Analysis, Insights and Forecast, 2019-2031
- 11.1. Market Analysis, Insights and Forecast - By Country/Sub-region
- 11.1.1 United States
- 11.1.2 Canada
- 11.1.3 Mexico
- 12. Europe Diabetic Retinopathy Market Analysis, Insights and Forecast, 2019-2031
- 12.1. Market Analysis, Insights and Forecast - By Country/Sub-region
- 12.1.1 Germany
- 12.1.2 United Kingdom
- 12.1.3 France
- 12.1.4 Italy
- 12.1.5 Spain
- 12.1.6 Rest of Europe
- 13. Asia Pacific Diabetic Retinopathy Market Analysis, Insights and Forecast, 2019-2031
- 13.1. Market Analysis, Insights and Forecast - By Country/Sub-region
- 13.1.1 China
- 13.1.2 Japan
- 13.1.3 India
- 13.1.4 Australia
- 13.1.5 South Korea
- 13.1.6 Rest of Asia Pacific
- 14. Middle East and Africa Diabetic Retinopathy Market Analysis, Insights and Forecast, 2019-2031
- 14.1. Market Analysis, Insights and Forecast - By Country/Sub-region
- 14.1.1 GCC
- 14.1.2 South Africa
- 14.1.3 Rest of Middle East and Africa
- 15. South America Diabetic Retinopathy Market Analysis, Insights and Forecast, 2019-2031
- 15.1. Market Analysis, Insights and Forecast - By Country/Sub-region
- 15.1.1 Brazil
- 15.1.2 Argentina
- 15.1.3 Rest of South America
- 16. Competitive Analysis
- 16.1. Global Market Share Analysis 2024
- 16.2. Company Profiles
- 16.2.1 Regeneron Pharmaceuticals Inc
- 16.2.1.1. Overview
- 16.2.1.2. Products
- 16.2.1.3. SWOT Analysis
- 16.2.1.4. Recent Developments
- 16.2.1.5. Financials (Based on Availability)
- 16.2.2 Novartis AG
- 16.2.2.1. Overview
- 16.2.2.2. Products
- 16.2.2.3. SWOT Analysis
- 16.2.2.4. Recent Developments
- 16.2.2.5. Financials (Based on Availability)
- 16.2.3 Oxurion NV
- 16.2.3.1. Overview
- 16.2.3.2. Products
- 16.2.3.3. SWOT Analysis
- 16.2.3.4. Recent Developments
- 16.2.3.5. Financials (Based on Availability)
- 16.2.4 AbbVie Inc (Allergan plc)
- 16.2.4.1. Overview
- 16.2.4.2. Products
- 16.2.4.3. SWOT Analysis
- 16.2.4.4. Recent Developments
- 16.2.4.5. Financials (Based on Availability)
- 16.2.5 Glycadia Pharmaceuticals
- 16.2.5.1. Overview
- 16.2.5.2. Products
- 16.2.5.3. SWOT Analysis
- 16.2.5.4. Recent Developments
- 16.2.5.5. Financials (Based on Availability)
- 16.2.6 Alimera Sciences
- 16.2.6.1. Overview
- 16.2.6.2. Products
- 16.2.6.3. SWOT Analysis
- 16.2.6.4. Recent Developments
- 16.2.6.5. Financials (Based on Availability)
- 16.2.7 BCN Peptides
- 16.2.7.1. Overview
- 16.2.7.2. Products
- 16.2.7.3. SWOT Analysis
- 16.2.7.4. Recent Developments
- 16.2.7.5. Financials (Based on Availability)
- 16.2.8 F Hoffmann-La Roche Ltd (Genentech)
- 16.2.8.1. Overview
- 16.2.8.2. Products
- 16.2.8.3. SWOT Analysis
- 16.2.8.4. Recent Developments
- 16.2.8.5. Financials (Based on Availability)
- 16.2.9 Ocuphire Pharma
- 16.2.9.1. Overview
- 16.2.9.2. Products
- 16.2.9.3. SWOT Analysis
- 16.2.9.4. Recent Developments
- 16.2.9.5. Financials (Based on Availability)
- 16.2.1 Regeneron Pharmaceuticals Inc
List of Figures
- Figure 1: Global Diabetic Retinopathy Market Revenue Breakdown (Million, %) by Region 2024 & 2032
- Figure 2: Global Diabetic Retinopathy Market Volume Breakdown (K Unit, %) by Region 2024 & 2032
- Figure 3: North America Diabetic Retinopathy Market Revenue (Million), by Country 2024 & 2032
- Figure 4: North America Diabetic Retinopathy Market Volume (K Unit), by Country 2024 & 2032
- Figure 5: North America Diabetic Retinopathy Market Revenue Share (%), by Country 2024 & 2032
- Figure 6: North America Diabetic Retinopathy Market Volume Share (%), by Country 2024 & 2032
- Figure 7: Europe Diabetic Retinopathy Market Revenue (Million), by Country 2024 & 2032
- Figure 8: Europe Diabetic Retinopathy Market Volume (K Unit), by Country 2024 & 2032
- Figure 9: Europe Diabetic Retinopathy Market Revenue Share (%), by Country 2024 & 2032
- Figure 10: Europe Diabetic Retinopathy Market Volume Share (%), by Country 2024 & 2032
- Figure 11: Asia Pacific Diabetic Retinopathy Market Revenue (Million), by Country 2024 & 2032
- Figure 12: Asia Pacific Diabetic Retinopathy Market Volume (K Unit), by Country 2024 & 2032
- Figure 13: Asia Pacific Diabetic Retinopathy Market Revenue Share (%), by Country 2024 & 2032
- Figure 14: Asia Pacific Diabetic Retinopathy Market Volume Share (%), by Country 2024 & 2032
- Figure 15: Middle East and Africa Diabetic Retinopathy Market Revenue (Million), by Country 2024 & 2032
- Figure 16: Middle East and Africa Diabetic Retinopathy Market Volume (K Unit), by Country 2024 & 2032
- Figure 17: Middle East and Africa Diabetic Retinopathy Market Revenue Share (%), by Country 2024 & 2032
- Figure 18: Middle East and Africa Diabetic Retinopathy Market Volume Share (%), by Country 2024 & 2032
- Figure 19: South America Diabetic Retinopathy Market Revenue (Million), by Country 2024 & 2032
- Figure 20: South America Diabetic Retinopathy Market Volume (K Unit), by Country 2024 & 2032
- Figure 21: South America Diabetic Retinopathy Market Revenue Share (%), by Country 2024 & 2032
- Figure 22: South America Diabetic Retinopathy Market Volume Share (%), by Country 2024 & 2032
- Figure 23: North America Diabetic Retinopathy Market Revenue (Million), by Type 2024 & 2032
- Figure 24: North America Diabetic Retinopathy Market Volume (K Unit), by Type 2024 & 2032
- Figure 25: North America Diabetic Retinopathy Market Revenue Share (%), by Type 2024 & 2032
- Figure 26: North America Diabetic Retinopathy Market Volume Share (%), by Type 2024 & 2032
- Figure 27: North America Diabetic Retinopathy Market Revenue (Million), by Management Approach 2024 & 2032
- Figure 28: North America Diabetic Retinopathy Market Volume (K Unit), by Management Approach 2024 & 2032
- Figure 29: North America Diabetic Retinopathy Market Revenue Share (%), by Management Approach 2024 & 2032
- Figure 30: North America Diabetic Retinopathy Market Volume Share (%), by Management Approach 2024 & 2032
- Figure 31: North America Diabetic Retinopathy Market Revenue (Million), by Country 2024 & 2032
- Figure 32: North America Diabetic Retinopathy Market Volume (K Unit), by Country 2024 & 2032
- Figure 33: North America Diabetic Retinopathy Market Revenue Share (%), by Country 2024 & 2032
- Figure 34: North America Diabetic Retinopathy Market Volume Share (%), by Country 2024 & 2032
- Figure 35: Europe Diabetic Retinopathy Market Revenue (Million), by Type 2024 & 2032
- Figure 36: Europe Diabetic Retinopathy Market Volume (K Unit), by Type 2024 & 2032
- Figure 37: Europe Diabetic Retinopathy Market Revenue Share (%), by Type 2024 & 2032
- Figure 38: Europe Diabetic Retinopathy Market Volume Share (%), by Type 2024 & 2032
- Figure 39: Europe Diabetic Retinopathy Market Revenue (Million), by Management Approach 2024 & 2032
- Figure 40: Europe Diabetic Retinopathy Market Volume (K Unit), by Management Approach 2024 & 2032
- Figure 41: Europe Diabetic Retinopathy Market Revenue Share (%), by Management Approach 2024 & 2032
- Figure 42: Europe Diabetic Retinopathy Market Volume Share (%), by Management Approach 2024 & 2032
- Figure 43: Europe Diabetic Retinopathy Market Revenue (Million), by Country 2024 & 2032
- Figure 44: Europe Diabetic Retinopathy Market Volume (K Unit), by Country 2024 & 2032
- Figure 45: Europe Diabetic Retinopathy Market Revenue Share (%), by Country 2024 & 2032
- Figure 46: Europe Diabetic Retinopathy Market Volume Share (%), by Country 2024 & 2032
- Figure 47: Asia Pacific Diabetic Retinopathy Market Revenue (Million), by Type 2024 & 2032
- Figure 48: Asia Pacific Diabetic Retinopathy Market Volume (K Unit), by Type 2024 & 2032
- Figure 49: Asia Pacific Diabetic Retinopathy Market Revenue Share (%), by Type 2024 & 2032
- Figure 50: Asia Pacific Diabetic Retinopathy Market Volume Share (%), by Type 2024 & 2032
- Figure 51: Asia Pacific Diabetic Retinopathy Market Revenue (Million), by Management Approach 2024 & 2032
- Figure 52: Asia Pacific Diabetic Retinopathy Market Volume (K Unit), by Management Approach 2024 & 2032
- Figure 53: Asia Pacific Diabetic Retinopathy Market Revenue Share (%), by Management Approach 2024 & 2032
- Figure 54: Asia Pacific Diabetic Retinopathy Market Volume Share (%), by Management Approach 2024 & 2032
- Figure 55: Asia Pacific Diabetic Retinopathy Market Revenue (Million), by Country 2024 & 2032
- Figure 56: Asia Pacific Diabetic Retinopathy Market Volume (K Unit), by Country 2024 & 2032
- Figure 57: Asia Pacific Diabetic Retinopathy Market Revenue Share (%), by Country 2024 & 2032
- Figure 58: Asia Pacific Diabetic Retinopathy Market Volume Share (%), by Country 2024 & 2032
- Figure 59: Middle East and Africa Diabetic Retinopathy Market Revenue (Million), by Type 2024 & 2032
- Figure 60: Middle East and Africa Diabetic Retinopathy Market Volume (K Unit), by Type 2024 & 2032
- Figure 61: Middle East and Africa Diabetic Retinopathy Market Revenue Share (%), by Type 2024 & 2032
- Figure 62: Middle East and Africa Diabetic Retinopathy Market Volume Share (%), by Type 2024 & 2032
- Figure 63: Middle East and Africa Diabetic Retinopathy Market Revenue (Million), by Management Approach 2024 & 2032
- Figure 64: Middle East and Africa Diabetic Retinopathy Market Volume (K Unit), by Management Approach 2024 & 2032
- Figure 65: Middle East and Africa Diabetic Retinopathy Market Revenue Share (%), by Management Approach 2024 & 2032
- Figure 66: Middle East and Africa Diabetic Retinopathy Market Volume Share (%), by Management Approach 2024 & 2032
- Figure 67: Middle East and Africa Diabetic Retinopathy Market Revenue (Million), by Country 2024 & 2032
- Figure 68: Middle East and Africa Diabetic Retinopathy Market Volume (K Unit), by Country 2024 & 2032
- Figure 69: Middle East and Africa Diabetic Retinopathy Market Revenue Share (%), by Country 2024 & 2032
- Figure 70: Middle East and Africa Diabetic Retinopathy Market Volume Share (%), by Country 2024 & 2032
- Figure 71: South America Diabetic Retinopathy Market Revenue (Million), by Type 2024 & 2032
- Figure 72: South America Diabetic Retinopathy Market Volume (K Unit), by Type 2024 & 2032
- Figure 73: South America Diabetic Retinopathy Market Revenue Share (%), by Type 2024 & 2032
- Figure 74: South America Diabetic Retinopathy Market Volume Share (%), by Type 2024 & 2032
- Figure 75: South America Diabetic Retinopathy Market Revenue (Million), by Management Approach 2024 & 2032
- Figure 76: South America Diabetic Retinopathy Market Volume (K Unit), by Management Approach 2024 & 2032
- Figure 77: South America Diabetic Retinopathy Market Revenue Share (%), by Management Approach 2024 & 2032
- Figure 78: South America Diabetic Retinopathy Market Volume Share (%), by Management Approach 2024 & 2032
- Figure 79: South America Diabetic Retinopathy Market Revenue (Million), by Country 2024 & 2032
- Figure 80: South America Diabetic Retinopathy Market Volume (K Unit), by Country 2024 & 2032
- Figure 81: South America Diabetic Retinopathy Market Revenue Share (%), by Country 2024 & 2032
- Figure 82: South America Diabetic Retinopathy Market Volume Share (%), by Country 2024 & 2032
List of Tables
- Table 1: Global Diabetic Retinopathy Market Revenue Million Forecast, by Region 2019 & 2032
- Table 2: Global Diabetic Retinopathy Market Volume K Unit Forecast, by Region 2019 & 2032
- Table 3: Global Diabetic Retinopathy Market Revenue Million Forecast, by Type 2019 & 2032
- Table 4: Global Diabetic Retinopathy Market Volume K Unit Forecast, by Type 2019 & 2032
- Table 5: Global Diabetic Retinopathy Market Revenue Million Forecast, by Management Approach 2019 & 2032
- Table 6: Global Diabetic Retinopathy Market Volume K Unit Forecast, by Management Approach 2019 & 2032
- Table 7: Global Diabetic Retinopathy Market Revenue Million Forecast, by Region 2019 & 2032
- Table 8: Global Diabetic Retinopathy Market Volume K Unit Forecast, by Region 2019 & 2032
- Table 9: Global Diabetic Retinopathy Market Revenue Million Forecast, by Country 2019 & 2032
- Table 10: Global Diabetic Retinopathy Market Volume K Unit Forecast, by Country 2019 & 2032
- Table 11: United States Diabetic Retinopathy Market Revenue (Million) Forecast, by Application 2019 & 2032
- Table 12: United States Diabetic Retinopathy Market Volume (K Unit) Forecast, by Application 2019 & 2032
- Table 13: Canada Diabetic Retinopathy Market Revenue (Million) Forecast, by Application 2019 & 2032
- Table 14: Canada Diabetic Retinopathy Market Volume (K Unit) Forecast, by Application 2019 & 2032
- Table 15: Mexico Diabetic Retinopathy Market Revenue (Million) Forecast, by Application 2019 & 2032
- Table 16: Mexico Diabetic Retinopathy Market Volume (K Unit) Forecast, by Application 2019 & 2032
- Table 17: Global Diabetic Retinopathy Market Revenue Million Forecast, by Country 2019 & 2032
- Table 18: Global Diabetic Retinopathy Market Volume K Unit Forecast, by Country 2019 & 2032
- Table 19: Germany Diabetic Retinopathy Market Revenue (Million) Forecast, by Application 2019 & 2032
- Table 20: Germany Diabetic Retinopathy Market Volume (K Unit) Forecast, by Application 2019 & 2032
- Table 21: United Kingdom Diabetic Retinopathy Market Revenue (Million) Forecast, by Application 2019 & 2032
- Table 22: United Kingdom Diabetic Retinopathy Market Volume (K Unit) Forecast, by Application 2019 & 2032
- Table 23: France Diabetic Retinopathy Market Revenue (Million) Forecast, by Application 2019 & 2032
- Table 24: France Diabetic Retinopathy Market Volume (K Unit) Forecast, by Application 2019 & 2032
- Table 25: Italy Diabetic Retinopathy Market Revenue (Million) Forecast, by Application 2019 & 2032
- Table 26: Italy Diabetic Retinopathy Market Volume (K Unit) Forecast, by Application 2019 & 2032
- Table 27: Spain Diabetic Retinopathy Market Revenue (Million) Forecast, by Application 2019 & 2032
- Table 28: Spain Diabetic Retinopathy Market Volume (K Unit) Forecast, by Application 2019 & 2032
- Table 29: Rest of Europe Diabetic Retinopathy Market Revenue (Million) Forecast, by Application 2019 & 2032
- Table 30: Rest of Europe Diabetic Retinopathy Market Volume (K Unit) Forecast, by Application 2019 & 2032
- Table 31: Global Diabetic Retinopathy Market Revenue Million Forecast, by Country 2019 & 2032
- Table 32: Global Diabetic Retinopathy Market Volume K Unit Forecast, by Country 2019 & 2032
- Table 33: China Diabetic Retinopathy Market Revenue (Million) Forecast, by Application 2019 & 2032
- Table 34: China Diabetic Retinopathy Market Volume (K Unit) Forecast, by Application 2019 & 2032
- Table 35: Japan Diabetic Retinopathy Market Revenue (Million) Forecast, by Application 2019 & 2032
- Table 36: Japan Diabetic Retinopathy Market Volume (K Unit) Forecast, by Application 2019 & 2032
- Table 37: India Diabetic Retinopathy Market Revenue (Million) Forecast, by Application 2019 & 2032
- Table 38: India Diabetic Retinopathy Market Volume (K Unit) Forecast, by Application 2019 & 2032
- Table 39: Australia Diabetic Retinopathy Market Revenue (Million) Forecast, by Application 2019 & 2032
- Table 40: Australia Diabetic Retinopathy Market Volume (K Unit) Forecast, by Application 2019 & 2032
- Table 41: South Korea Diabetic Retinopathy Market Revenue (Million) Forecast, by Application 2019 & 2032
- Table 42: South Korea Diabetic Retinopathy Market Volume (K Unit) Forecast, by Application 2019 & 2032
- Table 43: Rest of Asia Pacific Diabetic Retinopathy Market Revenue (Million) Forecast, by Application 2019 & 2032
- Table 44: Rest of Asia Pacific Diabetic Retinopathy Market Volume (K Unit) Forecast, by Application 2019 & 2032
- Table 45: Global Diabetic Retinopathy Market Revenue Million Forecast, by Country 2019 & 2032
- Table 46: Global Diabetic Retinopathy Market Volume K Unit Forecast, by Country 2019 & 2032
- Table 47: GCC Diabetic Retinopathy Market Revenue (Million) Forecast, by Application 2019 & 2032
- Table 48: GCC Diabetic Retinopathy Market Volume (K Unit) Forecast, by Application 2019 & 2032
- Table 49: South Africa Diabetic Retinopathy Market Revenue (Million) Forecast, by Application 2019 & 2032
- Table 50: South Africa Diabetic Retinopathy Market Volume (K Unit) Forecast, by Application 2019 & 2032
- Table 51: Rest of Middle East and Africa Diabetic Retinopathy Market Revenue (Million) Forecast, by Application 2019 & 2032
- Table 52: Rest of Middle East and Africa Diabetic Retinopathy Market Volume (K Unit) Forecast, by Application 2019 & 2032
- Table 53: Global Diabetic Retinopathy Market Revenue Million Forecast, by Country 2019 & 2032
- Table 54: Global Diabetic Retinopathy Market Volume K Unit Forecast, by Country 2019 & 2032
- Table 55: Brazil Diabetic Retinopathy Market Revenue (Million) Forecast, by Application 2019 & 2032
- Table 56: Brazil Diabetic Retinopathy Market Volume (K Unit) Forecast, by Application 2019 & 2032
- Table 57: Argentina Diabetic Retinopathy Market Revenue (Million) Forecast, by Application 2019 & 2032
- Table 58: Argentina Diabetic Retinopathy Market Volume (K Unit) Forecast, by Application 2019 & 2032
- Table 59: Rest of South America Diabetic Retinopathy Market Revenue (Million) Forecast, by Application 2019 & 2032
- Table 60: Rest of South America Diabetic Retinopathy Market Volume (K Unit) Forecast, by Application 2019 & 2032
- Table 61: Global Diabetic Retinopathy Market Revenue Million Forecast, by Type 2019 & 2032
- Table 62: Global Diabetic Retinopathy Market Volume K Unit Forecast, by Type 2019 & 2032
- Table 63: Global Diabetic Retinopathy Market Revenue Million Forecast, by Management Approach 2019 & 2032
- Table 64: Global Diabetic Retinopathy Market Volume K Unit Forecast, by Management Approach 2019 & 2032
- Table 65: Global Diabetic Retinopathy Market Revenue Million Forecast, by Country 2019 & 2032
- Table 66: Global Diabetic Retinopathy Market Volume K Unit Forecast, by Country 2019 & 2032
- Table 67: United States Diabetic Retinopathy Market Revenue (Million) Forecast, by Application 2019 & 2032
- Table 68: United States Diabetic Retinopathy Market Volume (K Unit) Forecast, by Application 2019 & 2032
- Table 69: Canada Diabetic Retinopathy Market Revenue (Million) Forecast, by Application 2019 & 2032
- Table 70: Canada Diabetic Retinopathy Market Volume (K Unit) Forecast, by Application 2019 & 2032
- Table 71: Mexico Diabetic Retinopathy Market Revenue (Million) Forecast, by Application 2019 & 2032
- Table 72: Mexico Diabetic Retinopathy Market Volume (K Unit) Forecast, by Application 2019 & 2032
- Table 73: Global Diabetic Retinopathy Market Revenue Million Forecast, by Type 2019 & 2032
- Table 74: Global Diabetic Retinopathy Market Volume K Unit Forecast, by Type 2019 & 2032
- Table 75: Global Diabetic Retinopathy Market Revenue Million Forecast, by Management Approach 2019 & 2032
- Table 76: Global Diabetic Retinopathy Market Volume K Unit Forecast, by Management Approach 2019 & 2032
- Table 77: Global Diabetic Retinopathy Market Revenue Million Forecast, by Country 2019 & 2032
- Table 78: Global Diabetic Retinopathy Market Volume K Unit Forecast, by Country 2019 & 2032
- Table 79: Germany Diabetic Retinopathy Market Revenue (Million) Forecast, by Application 2019 & 2032
- Table 80: Germany Diabetic Retinopathy Market Volume (K Unit) Forecast, by Application 2019 & 2032
- Table 81: United Kingdom Diabetic Retinopathy Market Revenue (Million) Forecast, by Application 2019 & 2032
- Table 82: United Kingdom Diabetic Retinopathy Market Volume (K Unit) Forecast, by Application 2019 & 2032
- Table 83: France Diabetic Retinopathy Market Revenue (Million) Forecast, by Application 2019 & 2032
- Table 84: France Diabetic Retinopathy Market Volume (K Unit) Forecast, by Application 2019 & 2032
- Table 85: Italy Diabetic Retinopathy Market Revenue (Million) Forecast, by Application 2019 & 2032
- Table 86: Italy Diabetic Retinopathy Market Volume (K Unit) Forecast, by Application 2019 & 2032
- Table 87: Spain Diabetic Retinopathy Market Revenue (Million) Forecast, by Application 2019 & 2032
- Table 88: Spain Diabetic Retinopathy Market Volume (K Unit) Forecast, by Application 2019 & 2032
- Table 89: Rest of Europe Diabetic Retinopathy Market Revenue (Million) Forecast, by Application 2019 & 2032
- Table 90: Rest of Europe Diabetic Retinopathy Market Volume (K Unit) Forecast, by Application 2019 & 2032
- Table 91: Global Diabetic Retinopathy Market Revenue Million Forecast, by Type 2019 & 2032
- Table 92: Global Diabetic Retinopathy Market Volume K Unit Forecast, by Type 2019 & 2032
- Table 93: Global Diabetic Retinopathy Market Revenue Million Forecast, by Management Approach 2019 & 2032
- Table 94: Global Diabetic Retinopathy Market Volume K Unit Forecast, by Management Approach 2019 & 2032
- Table 95: Global Diabetic Retinopathy Market Revenue Million Forecast, by Country 2019 & 2032
- Table 96: Global Diabetic Retinopathy Market Volume K Unit Forecast, by Country 2019 & 2032
- Table 97: China Diabetic Retinopathy Market Revenue (Million) Forecast, by Application 2019 & 2032
- Table 98: China Diabetic Retinopathy Market Volume (K Unit) Forecast, by Application 2019 & 2032
- Table 99: Japan Diabetic Retinopathy Market Revenue (Million) Forecast, by Application 2019 & 2032
- Table 100: Japan Diabetic Retinopathy Market Volume (K Unit) Forecast, by Application 2019 & 2032
- Table 101: India Diabetic Retinopathy Market Revenue (Million) Forecast, by Application 2019 & 2032
- Table 102: India Diabetic Retinopathy Market Volume (K Unit) Forecast, by Application 2019 & 2032
- Table 103: Australia Diabetic Retinopathy Market Revenue (Million) Forecast, by Application 2019 & 2032
- Table 104: Australia Diabetic Retinopathy Market Volume (K Unit) Forecast, by Application 2019 & 2032
- Table 105: South Korea Diabetic Retinopathy Market Revenue (Million) Forecast, by Application 2019 & 2032
- Table 106: South Korea Diabetic Retinopathy Market Volume (K Unit) Forecast, by Application 2019 & 2032
- Table 107: Rest of Asia Pacific Diabetic Retinopathy Market Revenue (Million) Forecast, by Application 2019 & 2032
- Table 108: Rest of Asia Pacific Diabetic Retinopathy Market Volume (K Unit) Forecast, by Application 2019 & 2032
- Table 109: Global Diabetic Retinopathy Market Revenue Million Forecast, by Type 2019 & 2032
- Table 110: Global Diabetic Retinopathy Market Volume K Unit Forecast, by Type 2019 & 2032
- Table 111: Global Diabetic Retinopathy Market Revenue Million Forecast, by Management Approach 2019 & 2032
- Table 112: Global Diabetic Retinopathy Market Volume K Unit Forecast, by Management Approach 2019 & 2032
- Table 113: Global Diabetic Retinopathy Market Revenue Million Forecast, by Country 2019 & 2032
- Table 114: Global Diabetic Retinopathy Market Volume K Unit Forecast, by Country 2019 & 2032
- Table 115: GCC Diabetic Retinopathy Market Revenue (Million) Forecast, by Application 2019 & 2032
- Table 116: GCC Diabetic Retinopathy Market Volume (K Unit) Forecast, by Application 2019 & 2032
- Table 117: South Africa Diabetic Retinopathy Market Revenue (Million) Forecast, by Application 2019 & 2032
- Table 118: South Africa Diabetic Retinopathy Market Volume (K Unit) Forecast, by Application 2019 & 2032
- Table 119: Rest of Middle East and Africa Diabetic Retinopathy Market Revenue (Million) Forecast, by Application 2019 & 2032
- Table 120: Rest of Middle East and Africa Diabetic Retinopathy Market Volume (K Unit) Forecast, by Application 2019 & 2032
- Table 121: Global Diabetic Retinopathy Market Revenue Million Forecast, by Type 2019 & 2032
- Table 122: Global Diabetic Retinopathy Market Volume K Unit Forecast, by Type 2019 & 2032
- Table 123: Global Diabetic Retinopathy Market Revenue Million Forecast, by Management Approach 2019 & 2032
- Table 124: Global Diabetic Retinopathy Market Volume K Unit Forecast, by Management Approach 2019 & 2032
- Table 125: Global Diabetic Retinopathy Market Revenue Million Forecast, by Country 2019 & 2032
- Table 126: Global Diabetic Retinopathy Market Volume K Unit Forecast, by Country 2019 & 2032
- Table 127: Brazil Diabetic Retinopathy Market Revenue (Million) Forecast, by Application 2019 & 2032
- Table 128: Brazil Diabetic Retinopathy Market Volume (K Unit) Forecast, by Application 2019 & 2032
- Table 129: Argentina Diabetic Retinopathy Market Revenue (Million) Forecast, by Application 2019 & 2032
- Table 130: Argentina Diabetic Retinopathy Market Volume (K Unit) Forecast, by Application 2019 & 2032
- Table 131: Rest of South America Diabetic Retinopathy Market Revenue (Million) Forecast, by Application 2019 & 2032
- Table 132: Rest of South America Diabetic Retinopathy Market Volume (K Unit) Forecast, by Application 2019 & 2032
Frequently Asked Questions
1. What is the projected Compound Annual Growth Rate (CAGR) of the Diabetic Retinopathy Market?
The projected CAGR is approximately 11.50%.
2. Which companies are prominent players in the Diabetic Retinopathy Market?
Key companies in the market include Regeneron Pharmaceuticals Inc, Novartis AG, Oxurion NV , AbbVie Inc (Allergan plc), Glycadia Pharmaceuticals, Alimera Sciences, BCN Peptides, F Hoffmann-La Roche Ltd (Genentech), Ocuphire Pharma.
3. What are the main segments of the Diabetic Retinopathy Market?
The market segments include Type, Management Approach.
4. Can you provide details about the market size?
The market size is estimated to be USD XX Million as of 2022.
5. What are some drivers contributing to market growth?
Rising Prevalence of Diabetes and Blindness Due to The Same; Growing Geriatric Population Base; Increasing Technological Advancements in Diabetic Retinopathy Surgical Instruments.
6. What are the notable trends driving market growth?
Proliferative diabetic retinopathy is Expected to Hold Significant Market Share in the Type Segment.
7. Are there any restraints impacting market growth?
Lack of Skilled Ophthalmologists; Extended Approval Time for Drugs.
8. Can you provide examples of recent developments in the market?
In June 2022, Regeneron Pharmaceuticals, Inc. announced that the United States Food and Drug Administration (FDA) accepted for review the EYLEA (aflibercept) Injection supplemental Biologics License Application (sBLA) for every 16-week 2 mg dosing regimen (after initial monthly doses) in patients with diabetic retinopathy (DR).
9. What pricing options are available for accessing the report?
Pricing options include single-user, multi-user, and enterprise licenses priced at USD 4750, USD 5250, and USD 8750 respectively.
10. Is the market size provided in terms of value or volume?
The market size is provided in terms of value, measured in Million and volume, measured in K Unit.
11. Are there any specific market keywords associated with the report?
Yes, the market keyword associated with the report is "Diabetic Retinopathy Market," which aids in identifying and referencing the specific market segment covered.
12. How do I determine which pricing option suits my needs best?
The pricing options vary based on user requirements and access needs. Individual users may opt for single-user licenses, while businesses requiring broader access may choose multi-user or enterprise licenses for cost-effective access to the report.
13. Are there any additional resources or data provided in the Diabetic Retinopathy Market report?
While the report offers comprehensive insights, it's advisable to review the specific contents or supplementary materials provided to ascertain if additional resources or data are available.
14. How can I stay updated on further developments or reports in the Diabetic Retinopathy Market?
To stay informed about further developments, trends, and reports in the Diabetic Retinopathy Market, consider subscribing to industry newsletters, following relevant companies and organizations, or regularly checking reputable industry news sources and publications.
Methodology
Step 1 - Identification of Relevant Samples Size from Population Database


Step 2 - Approaches for Defining Global Market Size (Value, Volume* & Price*)

Note*: In applicable scenarios
Step 3 - Data Sources
Primary Research
- Web Analytics
- Survey Reports
- Research Institute
- Latest Research Reports
- Opinion Leaders
Secondary Research
- Annual Reports
- White Paper
- Latest Press Release
- Industry Association
- Paid Database
- Investor Presentations

Step 4 - Data Triangulation
Involves using different sources of information in order to increase the validity of a study
These sources are likely to be stakeholders in a program - participants, other researchers, program staff, other community members, and so on.
Then we put all data in single framework & apply various statistical tools to find out the dynamic on the market.
During the analysis stage, feedback from the stakeholder groups would be compared to determine areas of agreement as well as areas of divergence
