

Key Insights
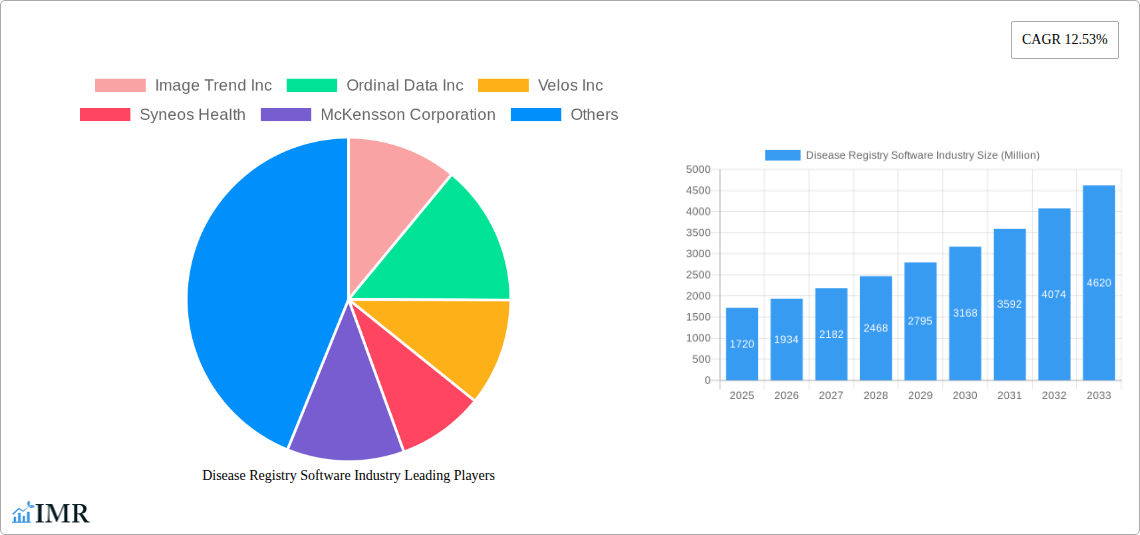
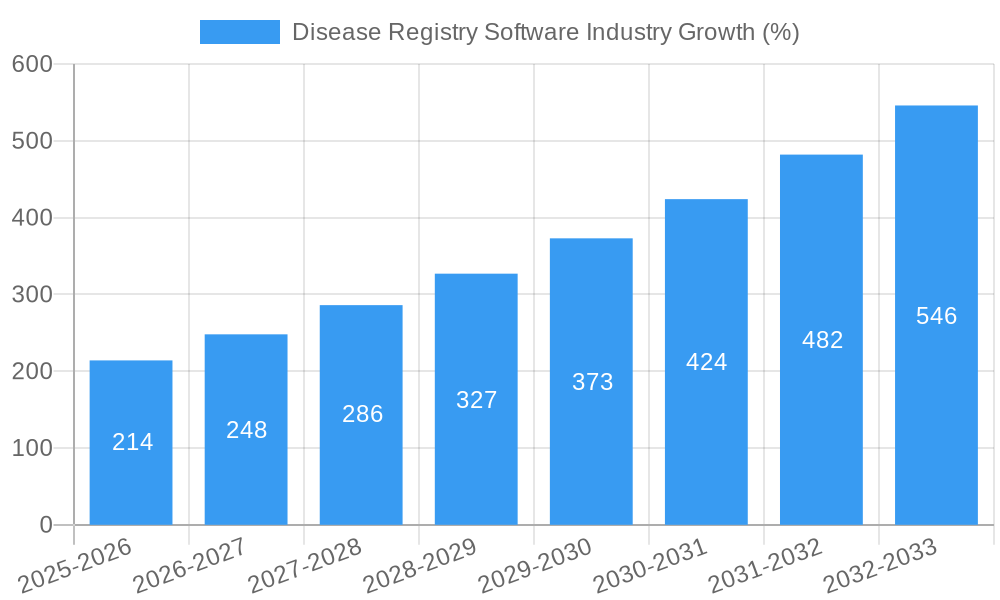
The global Disease Registry Software market, valued at $1.72 billion in 2025, is projected to experience robust growth, driven by a compound annual growth rate (CAGR) of 12.53% from 2025 to 2033. This expansion is fueled by several key factors. Increasing prevalence of chronic diseases necessitates efficient patient data management, leading to wider adoption of disease registry software. Furthermore, government initiatives promoting public health data integration and the rising demand for personalized medicine are significant drivers. The increasing need for improved healthcare outcomes through proactive disease management and the potential for cost savings through better resource allocation further stimulate market growth. The market is segmented by registry type (disease, health service, product), software type (standalone, integrated), and end-user (hospitals, government organizations, pharmaceutical companies, etc.). Competition among established players like IBM, Cerner Corporation, and IQVIA, alongside emerging technology providers, is fostering innovation and driving down costs, making the technology more accessible to a broader range of healthcare organizations.
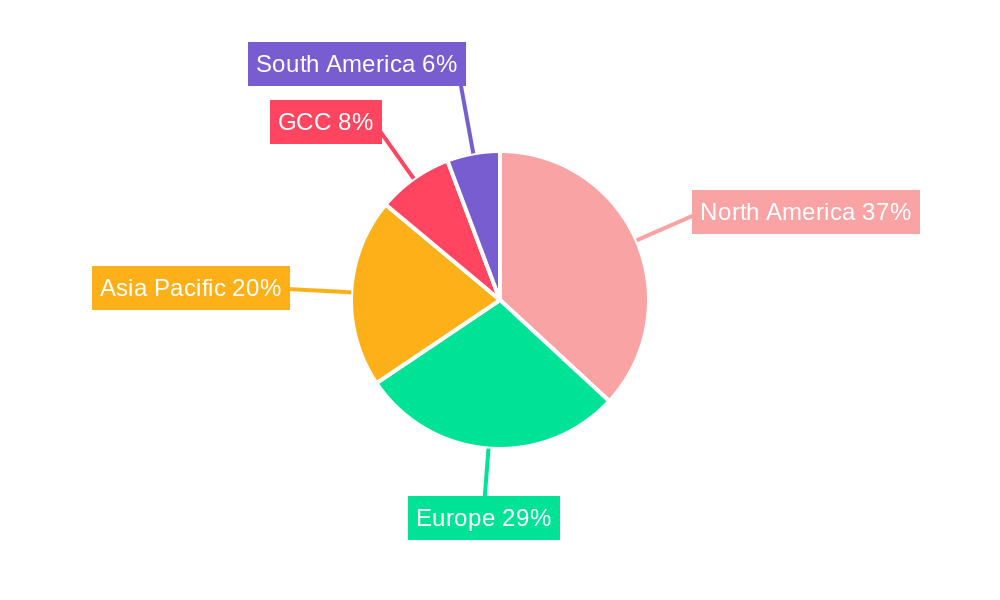
The market's geographic distribution shows a significant presence in North America, driven by advanced healthcare infrastructure and robust funding for research and development. Europe and the Asia-Pacific region are also expected to witness substantial growth, although at potentially slightly lower rates than North America. Factors like the increasing adoption of electronic health records (EHRs) and the growing awareness of the benefits of data-driven decision-making in healthcare are key to this expansion. However, challenges remain, including data security concerns, integration complexities with existing healthcare IT systems, and the need for substantial investments in infrastructure and training. Despite these challenges, the long-term outlook for the Disease Registry Software market remains positive, with significant growth potential across various segments and geographical regions.
Disease Registry Software Industry Market Report: 2019-2033
This comprehensive report provides an in-depth analysis of the Disease Registry Software market, encompassing its current state, future trends, and key players. With a focus on market segmentation (by type of registry, software type, and end-user), this report offers valuable insights for industry professionals, investors, and strategists seeking to understand and capitalize on the growth opportunities within this dynamic sector. The report covers the period from 2019 to 2033, with a base year of 2025 and a forecast period of 2025-2033. The total market size in 2025 is estimated at XX Million.
Disease Registry Software Industry Market Dynamics & Structure
The Disease Registry Software market is characterized by a moderately consolidated structure, with several major players and a growing number of niche players. Technological innovation, particularly in areas like AI and cloud computing, is a key driver. Stringent regulatory frameworks, including HIPAA and GDPR, significantly impact market dynamics. Competitive substitutes, such as manual data collection methods, are gradually being replaced by software solutions. The end-user demographics are expanding, encompassing hospitals, government organizations, TPAs, and pharmaceutical/biotech companies. The industry has witnessed a moderate level of M&A activity in recent years.
- Market Concentration: Moderately consolidated, with the top 5 players holding an estimated XX% market share in 2025.
- Technological Innovation: AI-powered analytics, cloud-based solutions, and improved data security are key drivers.
- Regulatory Framework: HIPAA and GDPR compliance are crucial considerations for vendors and users.
- Competitive Substitutes: Manual data entry and legacy systems are facing displacement by sophisticated software.
- End-User Demographics: Growth is driven by increasing adoption across hospitals, government, pharmaceutical firms, and TPAs.
- M&A Activity: An estimated XX M&A deals occurred between 2019 and 2024, with a projected XX deals for 2025-2033. The average deal size was approximately XX Million. Innovation barriers include high development costs, complex integrations, and the need for specialized expertise.
Disease Registry Software Industry Growth Trends & Insights
The Disease Registry Software market experienced significant growth during the historical period (2019-2024), driven by factors such as increasing disease prevalence, rising healthcare spending, and the growing need for efficient data management. The market is projected to continue its expansion during the forecast period (2025-2033), with a Compound Annual Growth Rate (CAGR) of XX%. This growth is fueled by technological advancements, improved data analytics capabilities, and increasing adoption across various end-user segments. Market penetration is expected to rise from XX% in 2025 to XX% by 2033. Consumer behavior is shifting towards cloud-based solutions, highlighting a preference for scalability, accessibility, and cost-effectiveness. Technological disruptions such as the integration of AI and machine learning are further accelerating market growth.
Dominant Regions, Countries, or Segments in Disease Registry Software Industry
North America currently dominates the Disease Registry Software market, driven by advanced healthcare infrastructure, high technological adoption, and strong regulatory support. Within this region, the United States holds the largest market share. However, other regions, particularly Europe and Asia-Pacific, are experiencing rapid growth, fueled by increasing healthcare spending and growing awareness of the benefits of disease registries.
- Type of Registry: Disease Registries hold the largest market share (XX Million), followed by Health Service Registries (XX Million) and Product Registries (XX Million).
- Type of Software: Integrated software solutions are gaining traction (XX Million), with stand-alone software still holding a significant share (XX Million).
- End User: Pharmaceutical, Biotechnology, and Medical Device Companies are the fastest-growing segment (XX Million), followed by Hospitals and Government Organizations (XX Million each).
- Key Drivers: Stringent data privacy regulations, increasing government funding for research, and expanding disease surveillance programs.
Disease Registry Software Industry Product Landscape
The Disease Registry Software market offers a diverse range of products, encompassing stand-alone and integrated solutions with varying functionalities. These solutions incorporate advanced features such as data visualization tools, real-time data analytics, and secure data storage capabilities. Key innovations focus on improving data quality, streamlining workflows, and enhancing interoperability with existing healthcare systems. Unique selling propositions often involve specialized features tailored to specific disease areas or end-user needs. Technological advancements emphasize seamless data integration, robust security protocols, and user-friendly interfaces.
Key Drivers, Barriers & Challenges in Disease Registry Software Industry
Key Drivers:
- Increasing prevalence of chronic diseases.
- Growing demand for efficient data management solutions.
- Government initiatives promoting disease surveillance and research.
- Technological advancements like AI and cloud computing.
Challenges & Restraints:
- High initial investment costs for software implementation.
- Concerns related to data security and privacy.
- Complexity of integrating software with existing healthcare systems.
- Lack of standardization across different registries. This results in approximately XX Million in lost efficiency annually.
Emerging Opportunities in Disease Registry Software Industry
- Expansion into untapped markets in developing countries.
- Development of specialized solutions for rare diseases.
- Integration of wearable technology and other IoT devices for data collection.
- Growing demand for real-world evidence generation using registry data.
Growth Accelerators in the Disease Registry Software Industry
Technological breakthroughs such as the integration of artificial intelligence and machine learning are significantly accelerating market growth. Strategic partnerships between software vendors and healthcare organizations are expanding market reach and driving innovation. Market expansion strategies targeting emerging economies offer substantial growth potential.
Key Players Shaping the Disease Registry Software Industry Market
- Image Trend Inc
- Ordinal Data Inc
- Velos Inc
- Syneos Health
- McKesson Corporation
- Cerner Corporation
- IQVIA
- Dacima Software Inc
- Global Vision Technologies Inc
- FIGmd Inc
- IBM
- ArborMetrix
Notable Milestones in Disease Registry Software Industry Sector
- April 2022: Quantori, LLC launched a Registry Science Practice.
- January 2022: Seqster partnered with the National Pancreas Foundation (NPF) to create a large pancreatic patient disease database.
In-Depth Disease Registry Software Industry Market Outlook
The Disease Registry Software market is poised for continued growth, driven by technological advancements, increasing demand for efficient data management, and expanding regulatory support. Strategic opportunities lie in developing innovative solutions tailored to specific disease areas, expanding into emerging markets, and fostering collaborations across the healthcare ecosystem. The projected market size in 2033 is estimated at XX Million, representing substantial growth potential for existing and new market entrants.
Disease Registry Software Industry Segmentation
-
1. Type of Registry
- 1.1. Disease Registries
- 1.2. Health Service Registries
- 1.3. Product Registries
-
2. Type of Software
- 2.1. Stand-alone Software
- 2.2. Integrated Software
-
3. End User
- 3.1. Hospitals
- 3.2. Governme
- 3.3. Pharmace
- 3.4. Other End Users
Disease Registry Software Industry Segmentation By Geography
-
1. North America
- 1.1. United States
- 1.2. Canada
- 1.3. Mexico
-
2. Europe
- 2.1. Germany
- 2.2. United Kingdom
- 2.3. France
- 2.4. Italy
- 2.5. Spain
- 2.6. Rest of Europe
-
3. Asia Pacific
- 3.1. China
- 3.2. Japan
- 3.3. India
- 3.4. Australia
- 3.5. South korea
- 3.6. Rest of Asia Pacific
- 4. Middle East
-
5. GCC
- 5.1. South Africa
- 5.2. Rest of Middle East
-
6. South America
- 6.1. Brazil
- 6.2. Argentina
- 6.3. Rest of South America
Disease Registry Software Industry REPORT HIGHLIGHTS
| Aspects | Details |
|---|---|
| Study Period | 2019-2033 |
| Base Year | 2024 |
| Estimated Year | 2025 |
| Forecast Period | 2025-2033 |
| Historical Period | 2019-2024 |
| Growth Rate | CAGR of 12.53% from 2019-2033 |
| Segmentation |
|
Table of Contents
- 1. Introduction
- 1.1. Research Scope
- 1.2. Market Segmentation
- 1.3. Research Methodology
- 1.4. Definitions and Assumptions
- 2. Executive Summary
- 2.1. Introduction
- 3. Market Dynamics
- 3.1. Introduction
- 3.2. Market Drivers
- 3.2.1. Implementation of Government Initiatives to Build Patient Registries; Rising Adoption of Electronic Health Records (EHR); Increasing Use of Patient Registry Data for Post-marketing Surveillance
- 3.3. Market Restrains
- 3.3.1. Privacy and Data Security-related Concerns; Lack of Trained and Skilled Resources
- 3.4. Market Trends
- 3.4.1. Integrated Software Segment is is Expected to Hold a Major Market Share in the Patient Registry Software Market
- 4. Market Factor Analysis
- 4.1. Porters Five Forces
- 4.2. Supply/Value Chain
- 4.3. PESTEL analysis
- 4.4. Market Entropy
- 4.5. Patent/Trademark Analysis
- 5. Global Disease Registry Software Industry Analysis, Insights and Forecast, 2019-2031
- 5.1. Market Analysis, Insights and Forecast - by Type of Registry
- 5.1.1. Disease Registries
- 5.1.2. Health Service Registries
- 5.1.3. Product Registries
- 5.2. Market Analysis, Insights and Forecast - by Type of Software
- 5.2.1. Stand-alone Software
- 5.2.2. Integrated Software
- 5.3. Market Analysis, Insights and Forecast - by End User
- 5.3.1. Hospitals
- 5.3.2. Governme
- 5.3.3. Pharmace
- 5.3.4. Other End Users
- 5.4. Market Analysis, Insights and Forecast - by Region
- 5.4.1. North America
- 5.4.2. Europe
- 5.4.3. Asia Pacific
- 5.4.4. Middle East
- 5.4.5. GCC
- 5.4.6. South America
- 5.1. Market Analysis, Insights and Forecast - by Type of Registry
- 6. North America Disease Registry Software Industry Analysis, Insights and Forecast, 2019-2031
- 6.1. Market Analysis, Insights and Forecast - by Type of Registry
- 6.1.1. Disease Registries
- 6.1.2. Health Service Registries
- 6.1.3. Product Registries
- 6.2. Market Analysis, Insights and Forecast - by Type of Software
- 6.2.1. Stand-alone Software
- 6.2.2. Integrated Software
- 6.3. Market Analysis, Insights and Forecast - by End User
- 6.3.1. Hospitals
- 6.3.2. Governme
- 6.3.3. Pharmace
- 6.3.4. Other End Users
- 6.1. Market Analysis, Insights and Forecast - by Type of Registry
- 7. Europe Disease Registry Software Industry Analysis, Insights and Forecast, 2019-2031
- 7.1. Market Analysis, Insights and Forecast - by Type of Registry
- 7.1.1. Disease Registries
- 7.1.2. Health Service Registries
- 7.1.3. Product Registries
- 7.2. Market Analysis, Insights and Forecast - by Type of Software
- 7.2.1. Stand-alone Software
- 7.2.2. Integrated Software
- 7.3. Market Analysis, Insights and Forecast - by End User
- 7.3.1. Hospitals
- 7.3.2. Governme
- 7.3.3. Pharmace
- 7.3.4. Other End Users
- 7.1. Market Analysis, Insights and Forecast - by Type of Registry
- 8. Asia Pacific Disease Registry Software Industry Analysis, Insights and Forecast, 2019-2031
- 8.1. Market Analysis, Insights and Forecast - by Type of Registry
- 8.1.1. Disease Registries
- 8.1.2. Health Service Registries
- 8.1.3. Product Registries
- 8.2. Market Analysis, Insights and Forecast - by Type of Software
- 8.2.1. Stand-alone Software
- 8.2.2. Integrated Software
- 8.3. Market Analysis, Insights and Forecast - by End User
- 8.3.1. Hospitals
- 8.3.2. Governme
- 8.3.3. Pharmace
- 8.3.4. Other End Users
- 8.1. Market Analysis, Insights and Forecast - by Type of Registry
- 9. Middle East Disease Registry Software Industry Analysis, Insights and Forecast, 2019-2031
- 9.1. Market Analysis, Insights and Forecast - by Type of Registry
- 9.1.1. Disease Registries
- 9.1.2. Health Service Registries
- 9.1.3. Product Registries
- 9.2. Market Analysis, Insights and Forecast - by Type of Software
- 9.2.1. Stand-alone Software
- 9.2.2. Integrated Software
- 9.3. Market Analysis, Insights and Forecast - by End User
- 9.3.1. Hospitals
- 9.3.2. Governme
- 9.3.3. Pharmace
- 9.3.4. Other End Users
- 9.1. Market Analysis, Insights and Forecast - by Type of Registry
- 10. GCC Disease Registry Software Industry Analysis, Insights and Forecast, 2019-2031
- 10.1. Market Analysis, Insights and Forecast - by Type of Registry
- 10.1.1. Disease Registries
- 10.1.2. Health Service Registries
- 10.1.3. Product Registries
- 10.2. Market Analysis, Insights and Forecast - by Type of Software
- 10.2.1. Stand-alone Software
- 10.2.2. Integrated Software
- 10.3. Market Analysis, Insights and Forecast - by End User
- 10.3.1. Hospitals
- 10.3.2. Governme
- 10.3.3. Pharmace
- 10.3.4. Other End Users
- 10.1. Market Analysis, Insights and Forecast - by Type of Registry
- 11. South America Disease Registry Software Industry Analysis, Insights and Forecast, 2019-2031
- 11.1. Market Analysis, Insights and Forecast - by Type of Registry
- 11.1.1. Disease Registries
- 11.1.2. Health Service Registries
- 11.1.3. Product Registries
- 11.2. Market Analysis, Insights and Forecast - by Type of Software
- 11.2.1. Stand-alone Software
- 11.2.2. Integrated Software
- 11.3. Market Analysis, Insights and Forecast - by End User
- 11.3.1. Hospitals
- 11.3.2. Governme
- 11.3.3. Pharmace
- 11.3.4. Other End Users
- 11.1. Market Analysis, Insights and Forecast - by Type of Registry
- 12. North America Disease Registry Software Industry Analysis, Insights and Forecast, 2019-2031
- 12.1. Market Analysis, Insights and Forecast - By Country/Sub-region
- 12.1.1 United States
- 12.1.2 Canada
- 12.1.3 Mexico
- 13. Europe Disease Registry Software Industry Analysis, Insights and Forecast, 2019-2031
- 13.1. Market Analysis, Insights and Forecast - By Country/Sub-region
- 13.1.1 Germany
- 13.1.2 United Kingdom
- 13.1.3 France
- 13.1.4 Italy
- 13.1.5 Spain
- 13.1.6 Rest of Europe
- 14. Asia Pacific Disease Registry Software Industry Analysis, Insights and Forecast, 2019-2031
- 14.1. Market Analysis, Insights and Forecast - By Country/Sub-region
- 14.1.1 China
- 14.1.2 Japan
- 14.1.3 India
- 14.1.4 Australia
- 14.1.5 South korea
- 14.1.6 Rest of Asia Pacific
- 15. GCC Disease Registry Software Industry Analysis, Insights and Forecast, 2019-2031
- 15.1. Market Analysis, Insights and Forecast - By Country/Sub-region
- 15.1.1 South Africa
- 15.1.2 Rest of Middle East
- 16. South America Disease Registry Software Industry Analysis, Insights and Forecast, 2019-2031
- 16.1. Market Analysis, Insights and Forecast - By Country/Sub-region
- 16.1.1 Brazil
- 16.1.2 Argentina
- 16.1.3 Rest of South America
- 17. Competitive Analysis
- 17.1. Global Market Share Analysis 2024
- 17.2. Company Profiles
- 17.2.1 Image Trend Inc
- 17.2.1.1. Overview
- 17.2.1.2. Products
- 17.2.1.3. SWOT Analysis
- 17.2.1.4. Recent Developments
- 17.2.1.5. Financials (Based on Availability)
- 17.2.2 Ordinal Data Inc
- 17.2.2.1. Overview
- 17.2.2.2. Products
- 17.2.2.3. SWOT Analysis
- 17.2.2.4. Recent Developments
- 17.2.2.5. Financials (Based on Availability)
- 17.2.3 Velos Inc
- 17.2.3.1. Overview
- 17.2.3.2. Products
- 17.2.3.3. SWOT Analysis
- 17.2.3.4. Recent Developments
- 17.2.3.5. Financials (Based on Availability)
- 17.2.4 Syneos Health
- 17.2.4.1. Overview
- 17.2.4.2. Products
- 17.2.4.3. SWOT Analysis
- 17.2.4.4. Recent Developments
- 17.2.4.5. Financials (Based on Availability)
- 17.2.5 McKensson Corporation
- 17.2.5.1. Overview
- 17.2.5.2. Products
- 17.2.5.3. SWOT Analysis
- 17.2.5.4. Recent Developments
- 17.2.5.5. Financials (Based on Availability)
- 17.2.6 Cerner Corporation
- 17.2.6.1. Overview
- 17.2.6.2. Products
- 17.2.6.3. SWOT Analysis
- 17.2.6.4. Recent Developments
- 17.2.6.5. Financials (Based on Availability)
- 17.2.7 IQVIA
- 17.2.7.1. Overview
- 17.2.7.2. Products
- 17.2.7.3. SWOT Analysis
- 17.2.7.4. Recent Developments
- 17.2.7.5. Financials (Based on Availability)
- 17.2.8 Dacima Software Inc
- 17.2.8.1. Overview
- 17.2.8.2. Products
- 17.2.8.3. SWOT Analysis
- 17.2.8.4. Recent Developments
- 17.2.8.5. Financials (Based on Availability)
- 17.2.9 Global Vision Technologies Inc
- 17.2.9.1. Overview
- 17.2.9.2. Products
- 17.2.9.3. SWOT Analysis
- 17.2.9.4. Recent Developments
- 17.2.9.5. Financials (Based on Availability)
- 17.2.10 FIGmd Inc
- 17.2.10.1. Overview
- 17.2.10.2. Products
- 17.2.10.3. SWOT Analysis
- 17.2.10.4. Recent Developments
- 17.2.10.5. Financials (Based on Availability)
- 17.2.11 IBM
- 17.2.11.1. Overview
- 17.2.11.2. Products
- 17.2.11.3. SWOT Analysis
- 17.2.11.4. Recent Developments
- 17.2.11.5. Financials (Based on Availability)
- 17.2.12 ArborMetrix
- 17.2.12.1. Overview
- 17.2.12.2. Products
- 17.2.12.3. SWOT Analysis
- 17.2.12.4. Recent Developments
- 17.2.12.5. Financials (Based on Availability)
- 17.2.1 Image Trend Inc
List of Figures
- Figure 1: Global Disease Registry Software Industry Revenue Breakdown (Million, %) by Region 2024 & 2032
- Figure 2: North America Disease Registry Software Industry Revenue (Million), by Country 2024 & 2032
- Figure 3: North America Disease Registry Software Industry Revenue Share (%), by Country 2024 & 2032
- Figure 4: Europe Disease Registry Software Industry Revenue (Million), by Country 2024 & 2032
- Figure 5: Europe Disease Registry Software Industry Revenue Share (%), by Country 2024 & 2032
- Figure 6: Asia Pacific Disease Registry Software Industry Revenue (Million), by Country 2024 & 2032
- Figure 7: Asia Pacific Disease Registry Software Industry Revenue Share (%), by Country 2024 & 2032
- Figure 8: GCC Disease Registry Software Industry Revenue (Million), by Country 2024 & 2032
- Figure 9: GCC Disease Registry Software Industry Revenue Share (%), by Country 2024 & 2032
- Figure 10: South America Disease Registry Software Industry Revenue (Million), by Country 2024 & 2032
- Figure 11: South America Disease Registry Software Industry Revenue Share (%), by Country 2024 & 2032
- Figure 12: North America Disease Registry Software Industry Revenue (Million), by Type of Registry 2024 & 2032
- Figure 13: North America Disease Registry Software Industry Revenue Share (%), by Type of Registry 2024 & 2032
- Figure 14: North America Disease Registry Software Industry Revenue (Million), by Type of Software 2024 & 2032
- Figure 15: North America Disease Registry Software Industry Revenue Share (%), by Type of Software 2024 & 2032
- Figure 16: North America Disease Registry Software Industry Revenue (Million), by End User 2024 & 2032
- Figure 17: North America Disease Registry Software Industry Revenue Share (%), by End User 2024 & 2032
- Figure 18: North America Disease Registry Software Industry Revenue (Million), by Country 2024 & 2032
- Figure 19: North America Disease Registry Software Industry Revenue Share (%), by Country 2024 & 2032
- Figure 20: Europe Disease Registry Software Industry Revenue (Million), by Type of Registry 2024 & 2032
- Figure 21: Europe Disease Registry Software Industry Revenue Share (%), by Type of Registry 2024 & 2032
- Figure 22: Europe Disease Registry Software Industry Revenue (Million), by Type of Software 2024 & 2032
- Figure 23: Europe Disease Registry Software Industry Revenue Share (%), by Type of Software 2024 & 2032
- Figure 24: Europe Disease Registry Software Industry Revenue (Million), by End User 2024 & 2032
- Figure 25: Europe Disease Registry Software Industry Revenue Share (%), by End User 2024 & 2032
- Figure 26: Europe Disease Registry Software Industry Revenue (Million), by Country 2024 & 2032
- Figure 27: Europe Disease Registry Software Industry Revenue Share (%), by Country 2024 & 2032
- Figure 28: Asia Pacific Disease Registry Software Industry Revenue (Million), by Type of Registry 2024 & 2032
- Figure 29: Asia Pacific Disease Registry Software Industry Revenue Share (%), by Type of Registry 2024 & 2032
- Figure 30: Asia Pacific Disease Registry Software Industry Revenue (Million), by Type of Software 2024 & 2032
- Figure 31: Asia Pacific Disease Registry Software Industry Revenue Share (%), by Type of Software 2024 & 2032
- Figure 32: Asia Pacific Disease Registry Software Industry Revenue (Million), by End User 2024 & 2032
- Figure 33: Asia Pacific Disease Registry Software Industry Revenue Share (%), by End User 2024 & 2032
- Figure 34: Asia Pacific Disease Registry Software Industry Revenue (Million), by Country 2024 & 2032
- Figure 35: Asia Pacific Disease Registry Software Industry Revenue Share (%), by Country 2024 & 2032
- Figure 36: Middle East Disease Registry Software Industry Revenue (Million), by Type of Registry 2024 & 2032
- Figure 37: Middle East Disease Registry Software Industry Revenue Share (%), by Type of Registry 2024 & 2032
- Figure 38: Middle East Disease Registry Software Industry Revenue (Million), by Type of Software 2024 & 2032
- Figure 39: Middle East Disease Registry Software Industry Revenue Share (%), by Type of Software 2024 & 2032
- Figure 40: Middle East Disease Registry Software Industry Revenue (Million), by End User 2024 & 2032
- Figure 41: Middle East Disease Registry Software Industry Revenue Share (%), by End User 2024 & 2032
- Figure 42: Middle East Disease Registry Software Industry Revenue (Million), by Country 2024 & 2032
- Figure 43: Middle East Disease Registry Software Industry Revenue Share (%), by Country 2024 & 2032
- Figure 44: GCC Disease Registry Software Industry Revenue (Million), by Type of Registry 2024 & 2032
- Figure 45: GCC Disease Registry Software Industry Revenue Share (%), by Type of Registry 2024 & 2032
- Figure 46: GCC Disease Registry Software Industry Revenue (Million), by Type of Software 2024 & 2032
- Figure 47: GCC Disease Registry Software Industry Revenue Share (%), by Type of Software 2024 & 2032
- Figure 48: GCC Disease Registry Software Industry Revenue (Million), by End User 2024 & 2032
- Figure 49: GCC Disease Registry Software Industry Revenue Share (%), by End User 2024 & 2032
- Figure 50: GCC Disease Registry Software Industry Revenue (Million), by Country 2024 & 2032
- Figure 51: GCC Disease Registry Software Industry Revenue Share (%), by Country 2024 & 2032
- Figure 52: South America Disease Registry Software Industry Revenue (Million), by Type of Registry 2024 & 2032
- Figure 53: South America Disease Registry Software Industry Revenue Share (%), by Type of Registry 2024 & 2032
- Figure 54: South America Disease Registry Software Industry Revenue (Million), by Type of Software 2024 & 2032
- Figure 55: South America Disease Registry Software Industry Revenue Share (%), by Type of Software 2024 & 2032
- Figure 56: South America Disease Registry Software Industry Revenue (Million), by End User 2024 & 2032
- Figure 57: South America Disease Registry Software Industry Revenue Share (%), by End User 2024 & 2032
- Figure 58: South America Disease Registry Software Industry Revenue (Million), by Country 2024 & 2032
- Figure 59: South America Disease Registry Software Industry Revenue Share (%), by Country 2024 & 2032
List of Tables
- Table 1: Global Disease Registry Software Industry Revenue Million Forecast, by Region 2019 & 2032
- Table 2: Global Disease Registry Software Industry Revenue Million Forecast, by Type of Registry 2019 & 2032
- Table 3: Global Disease Registry Software Industry Revenue Million Forecast, by Type of Software 2019 & 2032
- Table 4: Global Disease Registry Software Industry Revenue Million Forecast, by End User 2019 & 2032
- Table 5: Global Disease Registry Software Industry Revenue Million Forecast, by Region 2019 & 2032
- Table 6: Global Disease Registry Software Industry Revenue Million Forecast, by Country 2019 & 2032
- Table 7: United States Disease Registry Software Industry Revenue (Million) Forecast, by Application 2019 & 2032
- Table 8: Canada Disease Registry Software Industry Revenue (Million) Forecast, by Application 2019 & 2032
- Table 9: Mexico Disease Registry Software Industry Revenue (Million) Forecast, by Application 2019 & 2032
- Table 10: Global Disease Registry Software Industry Revenue Million Forecast, by Country 2019 & 2032
- Table 11: Germany Disease Registry Software Industry Revenue (Million) Forecast, by Application 2019 & 2032
- Table 12: United Kingdom Disease Registry Software Industry Revenue (Million) Forecast, by Application 2019 & 2032
- Table 13: France Disease Registry Software Industry Revenue (Million) Forecast, by Application 2019 & 2032
- Table 14: Italy Disease Registry Software Industry Revenue (Million) Forecast, by Application 2019 & 2032
- Table 15: Spain Disease Registry Software Industry Revenue (Million) Forecast, by Application 2019 & 2032
- Table 16: Rest of Europe Disease Registry Software Industry Revenue (Million) Forecast, by Application 2019 & 2032
- Table 17: Global Disease Registry Software Industry Revenue Million Forecast, by Country 2019 & 2032
- Table 18: China Disease Registry Software Industry Revenue (Million) Forecast, by Application 2019 & 2032
- Table 19: Japan Disease Registry Software Industry Revenue (Million) Forecast, by Application 2019 & 2032
- Table 20: India Disease Registry Software Industry Revenue (Million) Forecast, by Application 2019 & 2032
- Table 21: Australia Disease Registry Software Industry Revenue (Million) Forecast, by Application 2019 & 2032
- Table 22: South korea Disease Registry Software Industry Revenue (Million) Forecast, by Application 2019 & 2032
- Table 23: Rest of Asia Pacific Disease Registry Software Industry Revenue (Million) Forecast, by Application 2019 & 2032
- Table 24: Global Disease Registry Software Industry Revenue Million Forecast, by Country 2019 & 2032
- Table 25: South Africa Disease Registry Software Industry Revenue (Million) Forecast, by Application 2019 & 2032
- Table 26: Rest of Middle East Disease Registry Software Industry Revenue (Million) Forecast, by Application 2019 & 2032
- Table 27: Global Disease Registry Software Industry Revenue Million Forecast, by Country 2019 & 2032
- Table 28: Brazil Disease Registry Software Industry Revenue (Million) Forecast, by Application 2019 & 2032
- Table 29: Argentina Disease Registry Software Industry Revenue (Million) Forecast, by Application 2019 & 2032
- Table 30: Rest of South America Disease Registry Software Industry Revenue (Million) Forecast, by Application 2019 & 2032
- Table 31: Global Disease Registry Software Industry Revenue Million Forecast, by Type of Registry 2019 & 2032
- Table 32: Global Disease Registry Software Industry Revenue Million Forecast, by Type of Software 2019 & 2032
- Table 33: Global Disease Registry Software Industry Revenue Million Forecast, by End User 2019 & 2032
- Table 34: Global Disease Registry Software Industry Revenue Million Forecast, by Country 2019 & 2032
- Table 35: United States Disease Registry Software Industry Revenue (Million) Forecast, by Application 2019 & 2032
- Table 36: Canada Disease Registry Software Industry Revenue (Million) Forecast, by Application 2019 & 2032
- Table 37: Mexico Disease Registry Software Industry Revenue (Million) Forecast, by Application 2019 & 2032
- Table 38: Global Disease Registry Software Industry Revenue Million Forecast, by Type of Registry 2019 & 2032
- Table 39: Global Disease Registry Software Industry Revenue Million Forecast, by Type of Software 2019 & 2032
- Table 40: Global Disease Registry Software Industry Revenue Million Forecast, by End User 2019 & 2032
- Table 41: Global Disease Registry Software Industry Revenue Million Forecast, by Country 2019 & 2032
- Table 42: Germany Disease Registry Software Industry Revenue (Million) Forecast, by Application 2019 & 2032
- Table 43: United Kingdom Disease Registry Software Industry Revenue (Million) Forecast, by Application 2019 & 2032
- Table 44: France Disease Registry Software Industry Revenue (Million) Forecast, by Application 2019 & 2032
- Table 45: Italy Disease Registry Software Industry Revenue (Million) Forecast, by Application 2019 & 2032
- Table 46: Spain Disease Registry Software Industry Revenue (Million) Forecast, by Application 2019 & 2032
- Table 47: Rest of Europe Disease Registry Software Industry Revenue (Million) Forecast, by Application 2019 & 2032
- Table 48: Global Disease Registry Software Industry Revenue Million Forecast, by Type of Registry 2019 & 2032
- Table 49: Global Disease Registry Software Industry Revenue Million Forecast, by Type of Software 2019 & 2032
- Table 50: Global Disease Registry Software Industry Revenue Million Forecast, by End User 2019 & 2032
- Table 51: Global Disease Registry Software Industry Revenue Million Forecast, by Country 2019 & 2032
- Table 52: China Disease Registry Software Industry Revenue (Million) Forecast, by Application 2019 & 2032
- Table 53: Japan Disease Registry Software Industry Revenue (Million) Forecast, by Application 2019 & 2032
- Table 54: India Disease Registry Software Industry Revenue (Million) Forecast, by Application 2019 & 2032
- Table 55: Australia Disease Registry Software Industry Revenue (Million) Forecast, by Application 2019 & 2032
- Table 56: South korea Disease Registry Software Industry Revenue (Million) Forecast, by Application 2019 & 2032
- Table 57: Rest of Asia Pacific Disease Registry Software Industry Revenue (Million) Forecast, by Application 2019 & 2032
- Table 58: Global Disease Registry Software Industry Revenue Million Forecast, by Type of Registry 2019 & 2032
- Table 59: Global Disease Registry Software Industry Revenue Million Forecast, by Type of Software 2019 & 2032
- Table 60: Global Disease Registry Software Industry Revenue Million Forecast, by End User 2019 & 2032
- Table 61: Global Disease Registry Software Industry Revenue Million Forecast, by Country 2019 & 2032
- Table 62: Global Disease Registry Software Industry Revenue Million Forecast, by Type of Registry 2019 & 2032
- Table 63: Global Disease Registry Software Industry Revenue Million Forecast, by Type of Software 2019 & 2032
- Table 64: Global Disease Registry Software Industry Revenue Million Forecast, by End User 2019 & 2032
- Table 65: Global Disease Registry Software Industry Revenue Million Forecast, by Country 2019 & 2032
- Table 66: South Africa Disease Registry Software Industry Revenue (Million) Forecast, by Application 2019 & 2032
- Table 67: Rest of Middle East Disease Registry Software Industry Revenue (Million) Forecast, by Application 2019 & 2032
- Table 68: Global Disease Registry Software Industry Revenue Million Forecast, by Type of Registry 2019 & 2032
- Table 69: Global Disease Registry Software Industry Revenue Million Forecast, by Type of Software 2019 & 2032
- Table 70: Global Disease Registry Software Industry Revenue Million Forecast, by End User 2019 & 2032
- Table 71: Global Disease Registry Software Industry Revenue Million Forecast, by Country 2019 & 2032
- Table 72: Brazil Disease Registry Software Industry Revenue (Million) Forecast, by Application 2019 & 2032
- Table 73: Argentina Disease Registry Software Industry Revenue (Million) Forecast, by Application 2019 & 2032
- Table 74: Rest of South America Disease Registry Software Industry Revenue (Million) Forecast, by Application 2019 & 2032
Frequently Asked Questions
1. What is the projected Compound Annual Growth Rate (CAGR) of the Disease Registry Software Industry?
The projected CAGR is approximately 12.53%.
2. Which companies are prominent players in the Disease Registry Software Industry?
Key companies in the market include Image Trend Inc, Ordinal Data Inc, Velos Inc, Syneos Health, McKensson Corporation, Cerner Corporation, IQVIA, Dacima Software Inc, Global Vision Technologies Inc, FIGmd Inc, IBM, ArborMetrix.
3. What are the main segments of the Disease Registry Software Industry?
The market segments include Type of Registry, Type of Software, End User.
4. Can you provide details about the market size?
The market size is estimated to be USD 1.72 Million as of 2022.
5. What are some drivers contributing to market growth?
Implementation of Government Initiatives to Build Patient Registries; Rising Adoption of Electronic Health Records (EHR); Increasing Use of Patient Registry Data for Post-marketing Surveillance.
6. What are the notable trends driving market growth?
Integrated Software Segment is is Expected to Hold a Major Market Share in the Patient Registry Software Market.
7. Are there any restraints impacting market growth?
Privacy and Data Security-related Concerns; Lack of Trained and Skilled Resources.
8. Can you provide examples of recent developments in the market?
In April 2022, Quantori, LLC launched a Registry Science Practice focusing on the creation of registry programs for patients, clinicians, and researchers.
9. What pricing options are available for accessing the report?
Pricing options include single-user, multi-user, and enterprise licenses priced at USD 4750, USD 5250, and USD 8750 respectively.
10. Is the market size provided in terms of value or volume?
The market size is provided in terms of value, measured in Million.
11. Are there any specific market keywords associated with the report?
Yes, the market keyword associated with the report is "Disease Registry Software Industry," which aids in identifying and referencing the specific market segment covered.
12. How do I determine which pricing option suits my needs best?
The pricing options vary based on user requirements and access needs. Individual users may opt for single-user licenses, while businesses requiring broader access may choose multi-user or enterprise licenses for cost-effective access to the report.
13. Are there any additional resources or data provided in the Disease Registry Software Industry report?
While the report offers comprehensive insights, it's advisable to review the specific contents or supplementary materials provided to ascertain if additional resources or data are available.
14. How can I stay updated on further developments or reports in the Disease Registry Software Industry?
To stay informed about further developments, trends, and reports in the Disease Registry Software Industry, consider subscribing to industry newsletters, following relevant companies and organizations, or regularly checking reputable industry news sources and publications.
Methodology
Step 1 - Identification of Relevant Samples Size from Population Database


Step 2 - Approaches for Defining Global Market Size (Value, Volume* & Price*)

Note*: In applicable scenarios
Step 3 - Data Sources
Primary Research
- Web Analytics
- Survey Reports
- Research Institute
- Latest Research Reports
- Opinion Leaders
Secondary Research
- Annual Reports
- White Paper
- Latest Press Release
- Industry Association
- Paid Database
- Investor Presentations

Step 4 - Data Triangulation
Involves using different sources of information in order to increase the validity of a study
These sources are likely to be stakeholders in a program - participants, other researchers, program staff, other community members, and so on.
Then we put all data in single framework & apply various statistical tools to find out the dynamic on the market.
During the analysis stage, feedback from the stakeholder groups would be compared to determine areas of agreement as well as areas of divergence
