

Key Insights
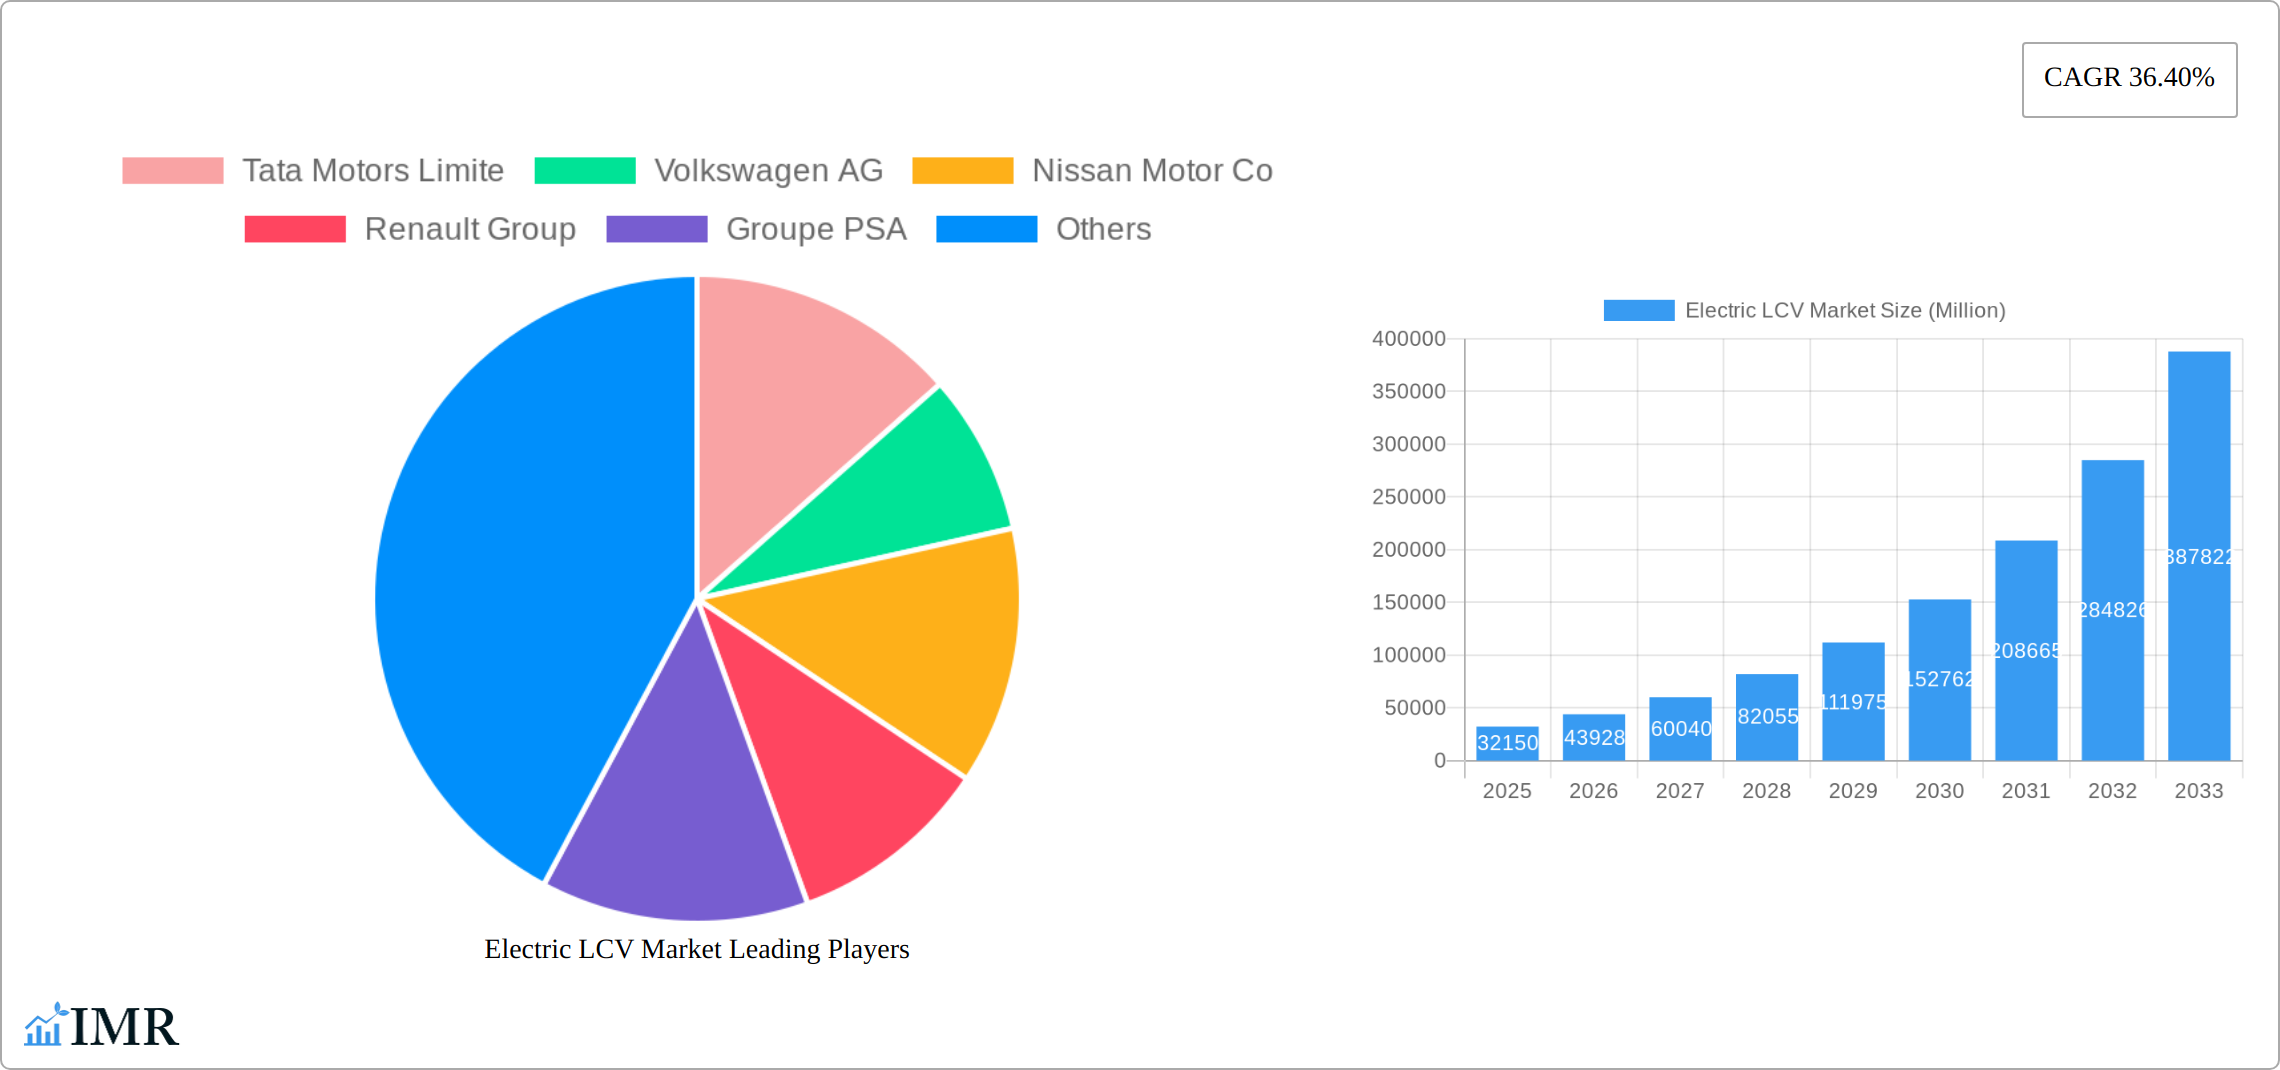
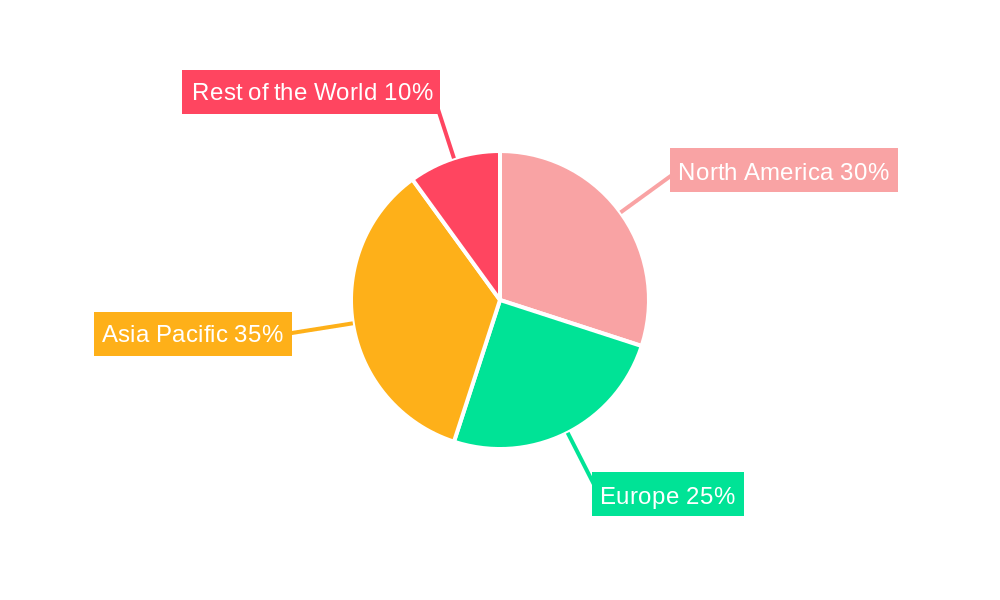
The Electric Light Commercial Vehicle (LCV) market is experiencing explosive growth, projected to reach \$32.15 billion in 2025 and exhibiting a remarkable Compound Annual Growth Rate (CAGR) of 36.40% from 2025 to 2033. Several factors fuel this expansion. Stringent emission regulations globally are pushing businesses to adopt cleaner transportation solutions, making electric LCVs a compelling alternative to traditional diesel-powered vehicles. Furthermore, advancements in battery technology, resulting in increased range and reduced charging times, are significantly improving the practicality and appeal of electric LCVs. The declining cost of battery production also contributes to the market's affordability and accessibility. The market is segmented by propulsion type (BEV, HEV, FCEV), vehicle type (van, pickup truck), and power output (less than 100 kW, 100-250 kW, more than 250 kW), reflecting the diverse needs of various business applications. Key players like Tata Motors, Volkswagen, Nissan, and Tesla are actively investing in research and development, expanding their product portfolios, and establishing robust charging infrastructure to capitalize on this burgeoning market. Regional variations exist, with North America and Europe representing substantial markets, while the Asia-Pacific region, particularly India and China, demonstrates significant growth potential due to increasing urbanization and burgeoning e-commerce sectors.
The continued growth trajectory hinges on several factors. Government incentives, including subsidies and tax breaks for electric vehicle adoption, are crucial in driving market penetration. Advancements in battery technology, focusing on longer range, faster charging, and improved durability, will be critical for wider acceptance. The development of comprehensive charging infrastructure, addressing range anxiety concerns, is essential for sustained growth. The success of the electric LCV market will also depend on the industry's ability to effectively address concerns regarding total cost of ownership, including initial vehicle cost, maintenance, and charging expenses. The competitiveness of electric LCVs compared to their internal combustion engine counterparts will continue to evolve as battery technology improves and charging infrastructure expands. The market will also see increasing innovation in areas such as autonomous driving capabilities and connectivity features.
Electric LCV Market: A Comprehensive Report (2019-2033)
This comprehensive report provides an in-depth analysis of the Electric Light Commercial Vehicle (LCV) market, encompassing market dynamics, growth trends, regional dominance, product landscapes, key players, and future outlooks. The study covers the period from 2019 to 2033, with 2025 as the base year and a forecast period of 2025-2033. This report serves as an indispensable resource for industry professionals, investors, and stakeholders seeking to navigate this rapidly evolving market. The parent market is the broader LCV market, while the child markets include segments by propulsion type (BEV, HEV, FCEV), vehicle type (van, pick-up truck), and power output (less than 100 kW, 100-250 kW, more than 250 kW). The global electric LCV market is expected to reach xx million units by 2033.
Electric LCV Market Dynamics & Structure
The Electric LCV market is characterized by increasing market concentration, with a few major players holding significant market share. Technological innovation, particularly in battery technology and charging infrastructure, is a key driver. Stringent emission regulations globally are accelerating the adoption of electric LCVs. Competitive substitutes include traditional internal combustion engine (ICE) vehicles, but their market share is steadily declining due to environmental concerns and cost advantages of electric vehicles in certain applications. The end-user demographics are diverse, ranging from delivery companies and logistics firms to construction businesses and municipalities. M&A activity in the sector is significant, with established automakers acquiring smaller electric vehicle startups to expand their portfolios and gain access to new technologies.
- Market Concentration: Top 5 players hold approximately xx% of the market share in 2025.
- Technological Innovation: Focus on improving battery range, reducing charging time, and enhancing vehicle performance.
- Regulatory Frameworks: Stringent emission standards are driving the transition to electric vehicles in many regions.
- Competitive Substitutes: Traditional ICE LCVs are facing increasing competition from electric alternatives.
- End-User Demographics: Diverse user base including delivery services, construction, and municipalities.
- M&A Trends: Significant consolidation through mergers and acquisitions amongst both established and new players. xx M&A deals were recorded between 2020 and 2024.
Electric LCV Market Growth Trends & Insights
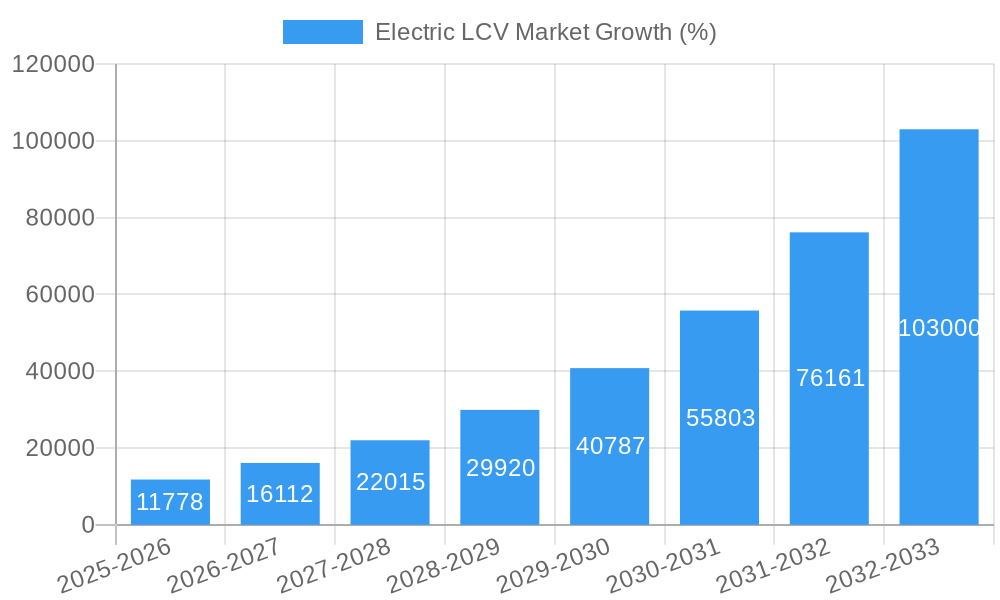
The Electric LCV market exhibits robust growth, driven by several factors. The market size has grown from xx million units in 2019 to xx million units in 2024, experiencing a CAGR of xx% during the historical period. This growth is expected to continue at a CAGR of xx% during the forecast period (2025-2033), reaching xx million units by 2033. Technological disruptions, such as advancements in battery technology and autonomous driving capabilities, are further accelerating market adoption. Consumer behavior is shifting towards environmentally friendly vehicles, driven by increased awareness of climate change and government incentives. The increasing affordability of electric LCVs compared to their ICE counterparts is another key contributing factor. Market penetration is expected to reach xx% by 2033.
Dominant Regions, Countries, or Segments in Electric LCV Market
The market is dominated by [Region Name], owing to supportive government policies, a well-established charging infrastructure, and strong consumer demand for electric vehicles. [Country Name] within [Region Name] holds a significant market share, followed by [Country Name] and [Country Name].
- By Propulsion Type: BEVs represent the largest segment, driven by their zero-tailpipe emissions.
- By Vehicle Type: Vans dominate the market due to high demand from delivery and logistics industries.
- By Power Output: The 100-250 kW segment is expected to witness the highest growth due to its balance of performance and cost-effectiveness.
- Key Drivers: Government subsidies, tax incentives, stringent emission regulations, and growing environmental awareness.
Electric LCV Market Product Landscape
The electric LCV market offers a diverse range of vehicles catering to different needs. Innovations focus on extended range, fast charging capabilities, and improved payload capacities. Many models incorporate advanced driver-assistance systems (ADAS) and telematics solutions for optimized fleet management. Unique selling propositions include reduced operating costs, lower maintenance needs, and environmental benefits. Continuous technological advancements are driving the development of more efficient and affordable electric LCVs.
Key Drivers, Barriers & Challenges in Electric LCV Market
Key Drivers:
- Increasing environmental regulations.
- Falling battery prices.
- Government incentives and subsidies.
- Growing demand for last-mile delivery solutions.
Challenges & Restraints:
- Limited charging infrastructure in certain regions.
- High initial purchase costs.
- Range anxiety amongst consumers.
- Concerns regarding battery lifespan and recycling. This impacts the market by restricting xx% of potential adoption in 2025.
Emerging Opportunities in Electric LCV Market
- Expansion into developing markets with high growth potential.
- Development of specialized electric LCVs for niche applications.
- Integration of advanced technologies such as autonomous driving and IoT.
- Growing demand for electric delivery vehicles in urban areas.
Growth Accelerators in the Electric LCV Market Industry
Technological advancements in battery technology, charging infrastructure, and vehicle design are key growth accelerators. Strategic partnerships between automakers, technology companies, and energy providers are facilitating market expansion. Government support through policies and incentives is crucial for sustained growth. Increased consumer awareness and acceptance of electric vehicles are further strengthening market momentum.
Key Players Shaping the Electric LCV Market Market
- Tata Motors Limited
- Volkswagen AG
- Nissan Motor Co
- Renault Group
- Groupe PSA
- Mahindra and Mahindra Ltd
- BYD Group
- Tesla Inc
- Arrival Ltd
- Rivian Automotive
- BAIC Group
Notable Milestones in Electric LCV Market Sector
- 2021-Q4: Launch of the new Tata Nexon EV.
- 2022-Q1: Volkswagen announces major investment in electric LCV production.
- 2023-Q2: Government of [Country Name] introduces a new incentive program for electric LCVs.
- 2024-Q3: BYD begins exporting its electric LCVs to [Region Name].
In-Depth Electric LCV Market Market Outlook
The future of the Electric LCV market is bright, with significant growth potential driven by technological advancements, supportive government policies, and growing environmental awareness. Strategic investments in charging infrastructure and battery technology will be crucial for sustained market expansion. The increasing adoption of electric LCVs across various industries presents lucrative opportunities for both established and new market entrants. The market is poised for significant expansion, offering attractive prospects for innovation and growth.
Electric LCV Market Segmentation
-
1. Propulsion Type
- 1.1. BEV
- 1.2. HEV
- 1.3. FCEV
-
2. Vehicle Type
- 2.1. Van
- 2.2. Pick-up Truck
-
3. Power Output
- 3.1. Less Than 100 kW
- 3.2. 100 -250 kW
- 3.3. More Than 250 kW
Electric LCV Market Segmentation By Geography
-
1. North America
- 1.1. United States
- 1.2. Canada
- 1.3. Rest of North America
-
2. Europe
- 2.1. Germany
- 2.2. United Kingdom
- 2.3. France
- 2.4. Rest of Europe
-
3. Asia Pacific
- 3.1. India
- 3.2. China
- 3.3. Japan
- 3.4. South Korea
- 3.5. Rest of Asia Pacific
-
4. Rest of the World
- 4.1. Brazil
- 4.2. Mexico
- 4.3. United Arab Emirates
- 4.4. Other Countries
Electric LCV Market REPORT HIGHLIGHTS
| Aspects | Details |
|---|---|
| Study Period | 2019-2033 |
| Base Year | 2024 |
| Estimated Year | 2025 |
| Forecast Period | 2025-2033 |
| Historical Period | 2019-2024 |
| Growth Rate | CAGR of 36.40% from 2019-2033 |
| Segmentation |
|
Table of Contents
- 1. Introduction
- 1.1. Research Scope
- 1.2. Market Segmentation
- 1.3. Research Methodology
- 1.4. Definitions and Assumptions
- 2. Executive Summary
- 2.1. Introduction
- 3. Market Dynamics
- 3.1. Introduction
- 3.2. Market Drivers
- 3.2.1. Growing Travel and Tourism Industry is Driving the Car Rental Market
- 3.3. Market Restrains
- 3.3.1. Increasing Popularity of Ride-Sharing Services Pose Challenges for the Conventional Car Rental Market
- 3.4. Market Trends
- 3.4.1. Electric Van is Leading the Electric LCV Market
- 4. Market Factor Analysis
- 4.1. Porters Five Forces
- 4.2. Supply/Value Chain
- 4.3. PESTEL analysis
- 4.4. Market Entropy
- 4.5. Patent/Trademark Analysis
- 5. Global Electric LCV Market Analysis, Insights and Forecast, 2019-2031
- 5.1. Market Analysis, Insights and Forecast - by Propulsion Type
- 5.1.1. BEV
- 5.1.2. HEV
- 5.1.3. FCEV
- 5.2. Market Analysis, Insights and Forecast - by Vehicle Type
- 5.2.1. Van
- 5.2.2. Pick-up Truck
- 5.3. Market Analysis, Insights and Forecast - by Power Output
- 5.3.1. Less Than 100 kW
- 5.3.2. 100 -250 kW
- 5.3.3. More Than 250 kW
- 5.4. Market Analysis, Insights and Forecast - by Region
- 5.4.1. North America
- 5.4.2. Europe
- 5.4.3. Asia Pacific
- 5.4.4. Rest of the World
- 5.1. Market Analysis, Insights and Forecast - by Propulsion Type
- 6. North America Electric LCV Market Analysis, Insights and Forecast, 2019-2031
- 6.1. Market Analysis, Insights and Forecast - by Propulsion Type
- 6.1.1. BEV
- 6.1.2. HEV
- 6.1.3. FCEV
- 6.2. Market Analysis, Insights and Forecast - by Vehicle Type
- 6.2.1. Van
- 6.2.2. Pick-up Truck
- 6.3. Market Analysis, Insights and Forecast - by Power Output
- 6.3.1. Less Than 100 kW
- 6.3.2. 100 -250 kW
- 6.3.3. More Than 250 kW
- 6.1. Market Analysis, Insights and Forecast - by Propulsion Type
- 7. Europe Electric LCV Market Analysis, Insights and Forecast, 2019-2031
- 7.1. Market Analysis, Insights and Forecast - by Propulsion Type
- 7.1.1. BEV
- 7.1.2. HEV
- 7.1.3. FCEV
- 7.2. Market Analysis, Insights and Forecast - by Vehicle Type
- 7.2.1. Van
- 7.2.2. Pick-up Truck
- 7.3. Market Analysis, Insights and Forecast - by Power Output
- 7.3.1. Less Than 100 kW
- 7.3.2. 100 -250 kW
- 7.3.3. More Than 250 kW
- 7.1. Market Analysis, Insights and Forecast - by Propulsion Type
- 8. Asia Pacific Electric LCV Market Analysis, Insights and Forecast, 2019-2031
- 8.1. Market Analysis, Insights and Forecast - by Propulsion Type
- 8.1.1. BEV
- 8.1.2. HEV
- 8.1.3. FCEV
- 8.2. Market Analysis, Insights and Forecast - by Vehicle Type
- 8.2.1. Van
- 8.2.2. Pick-up Truck
- 8.3. Market Analysis, Insights and Forecast - by Power Output
- 8.3.1. Less Than 100 kW
- 8.3.2. 100 -250 kW
- 8.3.3. More Than 250 kW
- 8.1. Market Analysis, Insights and Forecast - by Propulsion Type
- 9. Rest of the World Electric LCV Market Analysis, Insights and Forecast, 2019-2031
- 9.1. Market Analysis, Insights and Forecast - by Propulsion Type
- 9.1.1. BEV
- 9.1.2. HEV
- 9.1.3. FCEV
- 9.2. Market Analysis, Insights and Forecast - by Vehicle Type
- 9.2.1. Van
- 9.2.2. Pick-up Truck
- 9.3. Market Analysis, Insights and Forecast - by Power Output
- 9.3.1. Less Than 100 kW
- 9.3.2. 100 -250 kW
- 9.3.3. More Than 250 kW
- 9.1. Market Analysis, Insights and Forecast - by Propulsion Type
- 10. North America Electric LCV Market Analysis, Insights and Forecast, 2019-2031
- 10.1. Market Analysis, Insights and Forecast - By Country/Sub-region
- 10.1.1 United States
- 10.1.2 Canada
- 10.1.3 Rest of North America
- 11. Europe Electric LCV Market Analysis, Insights and Forecast, 2019-2031
- 11.1. Market Analysis, Insights and Forecast - By Country/Sub-region
- 11.1.1 Germany
- 11.1.2 United Kingdom
- 11.1.3 France
- 11.1.4 Rest of Europe
- 12. Asia Pacific Electric LCV Market Analysis, Insights and Forecast, 2019-2031
- 12.1. Market Analysis, Insights and Forecast - By Country/Sub-region
- 12.1.1 India
- 12.1.2 China
- 12.1.3 Japan
- 12.1.4 South Korea
- 12.1.5 Rest of Asia Pacific
- 13. Rest of the World Electric LCV Market Analysis, Insights and Forecast, 2019-2031
- 13.1. Market Analysis, Insights and Forecast - By Country/Sub-region
- 13.1.1 Brazil
- 13.1.2 Mexico
- 13.1.3 United Arab Emirates
- 13.1.4 Other Countries
- 14. Competitive Analysis
- 14.1. Global Market Share Analysis 2024
- 14.2. Company Profiles
- 14.2.1 Tata Motors Limite
- 14.2.1.1. Overview
- 14.2.1.2. Products
- 14.2.1.3. SWOT Analysis
- 14.2.1.4. Recent Developments
- 14.2.1.5. Financials (Based on Availability)
- 14.2.2 Volkswagen AG
- 14.2.2.1. Overview
- 14.2.2.2. Products
- 14.2.2.3. SWOT Analysis
- 14.2.2.4. Recent Developments
- 14.2.2.5. Financials (Based on Availability)
- 14.2.3 Nissan Motor Co
- 14.2.3.1. Overview
- 14.2.3.2. Products
- 14.2.3.3. SWOT Analysis
- 14.2.3.4. Recent Developments
- 14.2.3.5. Financials (Based on Availability)
- 14.2.4 Renault Group
- 14.2.4.1. Overview
- 14.2.4.2. Products
- 14.2.4.3. SWOT Analysis
- 14.2.4.4. Recent Developments
- 14.2.4.5. Financials (Based on Availability)
- 14.2.5 Groupe PSA
- 14.2.5.1. Overview
- 14.2.5.2. Products
- 14.2.5.3. SWOT Analysis
- 14.2.5.4. Recent Developments
- 14.2.5.5. Financials (Based on Availability)
- 14.2.6 Mahindra and Mahindra Ltd
- 14.2.6.1. Overview
- 14.2.6.2. Products
- 14.2.6.3. SWOT Analysis
- 14.2.6.4. Recent Developments
- 14.2.6.5. Financials (Based on Availability)
- 14.2.7 BYD Group
- 14.2.7.1. Overview
- 14.2.7.2. Products
- 14.2.7.3. SWOT Analysis
- 14.2.7.4. Recent Developments
- 14.2.7.5. Financials (Based on Availability)
- 14.2.8 Tesla Inc
- 14.2.8.1. Overview
- 14.2.8.2. Products
- 14.2.8.3. SWOT Analysis
- 14.2.8.4. Recent Developments
- 14.2.8.5. Financials (Based on Availability)
- 14.2.9 Arrival Ltd
- 14.2.9.1. Overview
- 14.2.9.2. Products
- 14.2.9.3. SWOT Analysis
- 14.2.9.4. Recent Developments
- 14.2.9.5. Financials (Based on Availability)
- 14.2.10 Rivian Automotive
- 14.2.10.1. Overview
- 14.2.10.2. Products
- 14.2.10.3. SWOT Analysis
- 14.2.10.4. Recent Developments
- 14.2.10.5. Financials (Based on Availability)
- 14.2.11 BAIC Group
- 14.2.11.1. Overview
- 14.2.11.2. Products
- 14.2.11.3. SWOT Analysis
- 14.2.11.4. Recent Developments
- 14.2.11.5. Financials (Based on Availability)
- 14.2.1 Tata Motors Limite
List of Figures
- Figure 1: Global Electric LCV Market Revenue Breakdown (Million, %) by Region 2024 & 2032
- Figure 2: North America Electric LCV Market Revenue (Million), by Country 2024 & 2032
- Figure 3: North America Electric LCV Market Revenue Share (%), by Country 2024 & 2032
- Figure 4: Europe Electric LCV Market Revenue (Million), by Country 2024 & 2032
- Figure 5: Europe Electric LCV Market Revenue Share (%), by Country 2024 & 2032
- Figure 6: Asia Pacific Electric LCV Market Revenue (Million), by Country 2024 & 2032
- Figure 7: Asia Pacific Electric LCV Market Revenue Share (%), by Country 2024 & 2032
- Figure 8: Rest of the World Electric LCV Market Revenue (Million), by Country 2024 & 2032
- Figure 9: Rest of the World Electric LCV Market Revenue Share (%), by Country 2024 & 2032
- Figure 10: North America Electric LCV Market Revenue (Million), by Propulsion Type 2024 & 2032
- Figure 11: North America Electric LCV Market Revenue Share (%), by Propulsion Type 2024 & 2032
- Figure 12: North America Electric LCV Market Revenue (Million), by Vehicle Type 2024 & 2032
- Figure 13: North America Electric LCV Market Revenue Share (%), by Vehicle Type 2024 & 2032
- Figure 14: North America Electric LCV Market Revenue (Million), by Power Output 2024 & 2032
- Figure 15: North America Electric LCV Market Revenue Share (%), by Power Output 2024 & 2032
- Figure 16: North America Electric LCV Market Revenue (Million), by Country 2024 & 2032
- Figure 17: North America Electric LCV Market Revenue Share (%), by Country 2024 & 2032
- Figure 18: Europe Electric LCV Market Revenue (Million), by Propulsion Type 2024 & 2032
- Figure 19: Europe Electric LCV Market Revenue Share (%), by Propulsion Type 2024 & 2032
- Figure 20: Europe Electric LCV Market Revenue (Million), by Vehicle Type 2024 & 2032
- Figure 21: Europe Electric LCV Market Revenue Share (%), by Vehicle Type 2024 & 2032
- Figure 22: Europe Electric LCV Market Revenue (Million), by Power Output 2024 & 2032
- Figure 23: Europe Electric LCV Market Revenue Share (%), by Power Output 2024 & 2032
- Figure 24: Europe Electric LCV Market Revenue (Million), by Country 2024 & 2032
- Figure 25: Europe Electric LCV Market Revenue Share (%), by Country 2024 & 2032
- Figure 26: Asia Pacific Electric LCV Market Revenue (Million), by Propulsion Type 2024 & 2032
- Figure 27: Asia Pacific Electric LCV Market Revenue Share (%), by Propulsion Type 2024 & 2032
- Figure 28: Asia Pacific Electric LCV Market Revenue (Million), by Vehicle Type 2024 & 2032
- Figure 29: Asia Pacific Electric LCV Market Revenue Share (%), by Vehicle Type 2024 & 2032
- Figure 30: Asia Pacific Electric LCV Market Revenue (Million), by Power Output 2024 & 2032
- Figure 31: Asia Pacific Electric LCV Market Revenue Share (%), by Power Output 2024 & 2032
- Figure 32: Asia Pacific Electric LCV Market Revenue (Million), by Country 2024 & 2032
- Figure 33: Asia Pacific Electric LCV Market Revenue Share (%), by Country 2024 & 2032
- Figure 34: Rest of the World Electric LCV Market Revenue (Million), by Propulsion Type 2024 & 2032
- Figure 35: Rest of the World Electric LCV Market Revenue Share (%), by Propulsion Type 2024 & 2032
- Figure 36: Rest of the World Electric LCV Market Revenue (Million), by Vehicle Type 2024 & 2032
- Figure 37: Rest of the World Electric LCV Market Revenue Share (%), by Vehicle Type 2024 & 2032
- Figure 38: Rest of the World Electric LCV Market Revenue (Million), by Power Output 2024 & 2032
- Figure 39: Rest of the World Electric LCV Market Revenue Share (%), by Power Output 2024 & 2032
- Figure 40: Rest of the World Electric LCV Market Revenue (Million), by Country 2024 & 2032
- Figure 41: Rest of the World Electric LCV Market Revenue Share (%), by Country 2024 & 2032
List of Tables
- Table 1: Global Electric LCV Market Revenue Million Forecast, by Region 2019 & 2032
- Table 2: Global Electric LCV Market Revenue Million Forecast, by Propulsion Type 2019 & 2032
- Table 3: Global Electric LCV Market Revenue Million Forecast, by Vehicle Type 2019 & 2032
- Table 4: Global Electric LCV Market Revenue Million Forecast, by Power Output 2019 & 2032
- Table 5: Global Electric LCV Market Revenue Million Forecast, by Region 2019 & 2032
- Table 6: Global Electric LCV Market Revenue Million Forecast, by Country 2019 & 2032
- Table 7: United States Electric LCV Market Revenue (Million) Forecast, by Application 2019 & 2032
- Table 8: Canada Electric LCV Market Revenue (Million) Forecast, by Application 2019 & 2032
- Table 9: Rest of North America Electric LCV Market Revenue (Million) Forecast, by Application 2019 & 2032
- Table 10: Global Electric LCV Market Revenue Million Forecast, by Country 2019 & 2032
- Table 11: Germany Electric LCV Market Revenue (Million) Forecast, by Application 2019 & 2032
- Table 12: United Kingdom Electric LCV Market Revenue (Million) Forecast, by Application 2019 & 2032
- Table 13: France Electric LCV Market Revenue (Million) Forecast, by Application 2019 & 2032
- Table 14: Rest of Europe Electric LCV Market Revenue (Million) Forecast, by Application 2019 & 2032
- Table 15: Global Electric LCV Market Revenue Million Forecast, by Country 2019 & 2032
- Table 16: India Electric LCV Market Revenue (Million) Forecast, by Application 2019 & 2032
- Table 17: China Electric LCV Market Revenue (Million) Forecast, by Application 2019 & 2032
- Table 18: Japan Electric LCV Market Revenue (Million) Forecast, by Application 2019 & 2032
- Table 19: South Korea Electric LCV Market Revenue (Million) Forecast, by Application 2019 & 2032
- Table 20: Rest of Asia Pacific Electric LCV Market Revenue (Million) Forecast, by Application 2019 & 2032
- Table 21: Global Electric LCV Market Revenue Million Forecast, by Country 2019 & 2032
- Table 22: Brazil Electric LCV Market Revenue (Million) Forecast, by Application 2019 & 2032
- Table 23: Mexico Electric LCV Market Revenue (Million) Forecast, by Application 2019 & 2032
- Table 24: United Arab Emirates Electric LCV Market Revenue (Million) Forecast, by Application 2019 & 2032
- Table 25: Other Countries Electric LCV Market Revenue (Million) Forecast, by Application 2019 & 2032
- Table 26: Global Electric LCV Market Revenue Million Forecast, by Propulsion Type 2019 & 2032
- Table 27: Global Electric LCV Market Revenue Million Forecast, by Vehicle Type 2019 & 2032
- Table 28: Global Electric LCV Market Revenue Million Forecast, by Power Output 2019 & 2032
- Table 29: Global Electric LCV Market Revenue Million Forecast, by Country 2019 & 2032
- Table 30: United States Electric LCV Market Revenue (Million) Forecast, by Application 2019 & 2032
- Table 31: Canada Electric LCV Market Revenue (Million) Forecast, by Application 2019 & 2032
- Table 32: Rest of North America Electric LCV Market Revenue (Million) Forecast, by Application 2019 & 2032
- Table 33: Global Electric LCV Market Revenue Million Forecast, by Propulsion Type 2019 & 2032
- Table 34: Global Electric LCV Market Revenue Million Forecast, by Vehicle Type 2019 & 2032
- Table 35: Global Electric LCV Market Revenue Million Forecast, by Power Output 2019 & 2032
- Table 36: Global Electric LCV Market Revenue Million Forecast, by Country 2019 & 2032
- Table 37: Germany Electric LCV Market Revenue (Million) Forecast, by Application 2019 & 2032
- Table 38: United Kingdom Electric LCV Market Revenue (Million) Forecast, by Application 2019 & 2032
- Table 39: France Electric LCV Market Revenue (Million) Forecast, by Application 2019 & 2032
- Table 40: Rest of Europe Electric LCV Market Revenue (Million) Forecast, by Application 2019 & 2032
- Table 41: Global Electric LCV Market Revenue Million Forecast, by Propulsion Type 2019 & 2032
- Table 42: Global Electric LCV Market Revenue Million Forecast, by Vehicle Type 2019 & 2032
- Table 43: Global Electric LCV Market Revenue Million Forecast, by Power Output 2019 & 2032
- Table 44: Global Electric LCV Market Revenue Million Forecast, by Country 2019 & 2032
- Table 45: India Electric LCV Market Revenue (Million) Forecast, by Application 2019 & 2032
- Table 46: China Electric LCV Market Revenue (Million) Forecast, by Application 2019 & 2032
- Table 47: Japan Electric LCV Market Revenue (Million) Forecast, by Application 2019 & 2032
- Table 48: South Korea Electric LCV Market Revenue (Million) Forecast, by Application 2019 & 2032
- Table 49: Rest of Asia Pacific Electric LCV Market Revenue (Million) Forecast, by Application 2019 & 2032
- Table 50: Global Electric LCV Market Revenue Million Forecast, by Propulsion Type 2019 & 2032
- Table 51: Global Electric LCV Market Revenue Million Forecast, by Vehicle Type 2019 & 2032
- Table 52: Global Electric LCV Market Revenue Million Forecast, by Power Output 2019 & 2032
- Table 53: Global Electric LCV Market Revenue Million Forecast, by Country 2019 & 2032
- Table 54: Brazil Electric LCV Market Revenue (Million) Forecast, by Application 2019 & 2032
- Table 55: Mexico Electric LCV Market Revenue (Million) Forecast, by Application 2019 & 2032
- Table 56: United Arab Emirates Electric LCV Market Revenue (Million) Forecast, by Application 2019 & 2032
- Table 57: Other Countries Electric LCV Market Revenue (Million) Forecast, by Application 2019 & 2032
Frequently Asked Questions
1. What is the projected Compound Annual Growth Rate (CAGR) of the Electric LCV Market?
The projected CAGR is approximately 36.40%.
2. Which companies are prominent players in the Electric LCV Market?
Key companies in the market include Tata Motors Limite, Volkswagen AG, Nissan Motor Co, Renault Group, Groupe PSA, Mahindra and Mahindra Ltd, BYD Group, Tesla Inc, Arrival Ltd, Rivian Automotive, BAIC Group.
3. What are the main segments of the Electric LCV Market?
The market segments include Propulsion Type, Vehicle Type, Power Output.
4. Can you provide details about the market size?
The market size is estimated to be USD 32.15 Million as of 2022.
5. What are some drivers contributing to market growth?
Growing Travel and Tourism Industry is Driving the Car Rental Market.
6. What are the notable trends driving market growth?
Electric Van is Leading the Electric LCV Market.
7. Are there any restraints impacting market growth?
Increasing Popularity of Ride-Sharing Services Pose Challenges for the Conventional Car Rental Market.
8. Can you provide examples of recent developments in the market?
N/A
9. What pricing options are available for accessing the report?
Pricing options include single-user, multi-user, and enterprise licenses priced at USD 4750, USD 5250, and USD 8750 respectively.
10. Is the market size provided in terms of value or volume?
The market size is provided in terms of value, measured in Million.
11. Are there any specific market keywords associated with the report?
Yes, the market keyword associated with the report is "Electric LCV Market," which aids in identifying and referencing the specific market segment covered.
12. How do I determine which pricing option suits my needs best?
The pricing options vary based on user requirements and access needs. Individual users may opt for single-user licenses, while businesses requiring broader access may choose multi-user or enterprise licenses for cost-effective access to the report.
13. Are there any additional resources or data provided in the Electric LCV Market report?
While the report offers comprehensive insights, it's advisable to review the specific contents or supplementary materials provided to ascertain if additional resources or data are available.
14. How can I stay updated on further developments or reports in the Electric LCV Market?
To stay informed about further developments, trends, and reports in the Electric LCV Market, consider subscribing to industry newsletters, following relevant companies and organizations, or regularly checking reputable industry news sources and publications.
Methodology
Step 1 - Identification of Relevant Samples Size from Population Database


Step 2 - Approaches for Defining Global Market Size (Value, Volume* & Price*)

Note*: In applicable scenarios
Step 3 - Data Sources
Primary Research
- Web Analytics
- Survey Reports
- Research Institute
- Latest Research Reports
- Opinion Leaders
Secondary Research
- Annual Reports
- White Paper
- Latest Press Release
- Industry Association
- Paid Database
- Investor Presentations

Step 4 - Data Triangulation
Involves using different sources of information in order to increase the validity of a study
These sources are likely to be stakeholders in a program - participants, other researchers, program staff, other community members, and so on.
Then we put all data in single framework & apply various statistical tools to find out the dynamic on the market.
During the analysis stage, feedback from the stakeholder groups would be compared to determine areas of agreement as well as areas of divergence
