

Key Insights
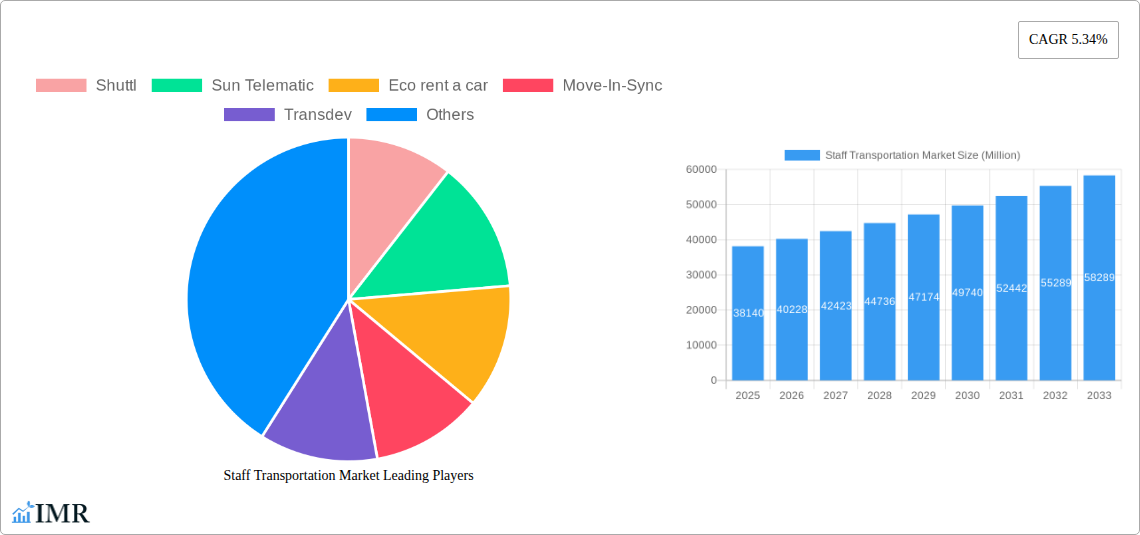
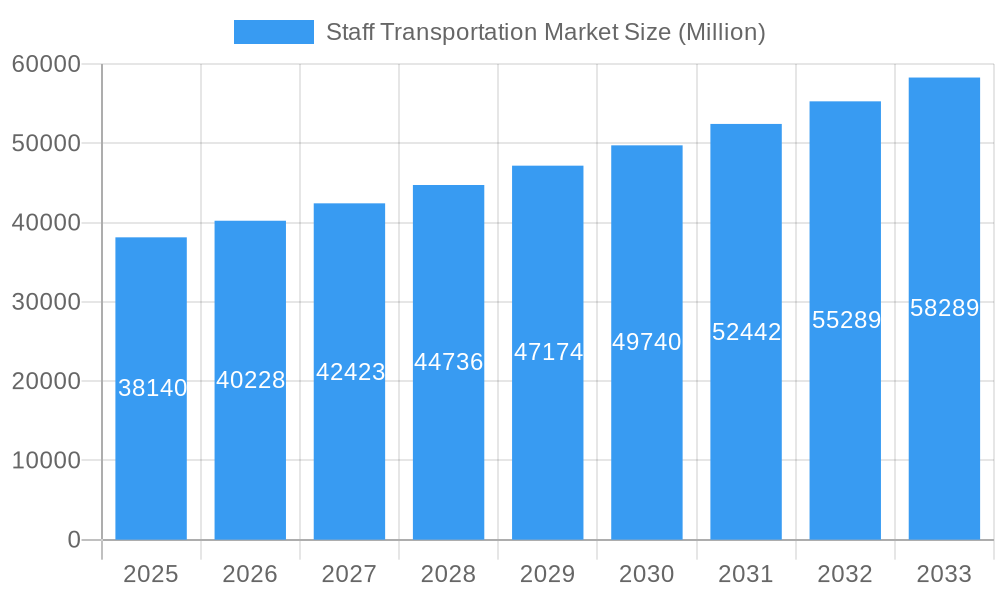
The global staff transportation market, valued at $38.14 billion in 2025, is projected to experience robust growth, driven by a compound annual growth rate (CAGR) of 5.34% from 2025 to 2033. This expansion is fueled by several key factors. The increasing adoption of Mobility as a Service (MaaS) solutions offers businesses cost-effective and efficient staff transportation alternatives, reducing reliance on individual vehicle ownership and associated expenses like parking and fuel. Furthermore, the growing awareness of corporate social responsibility and the need to reduce carbon footprints is driving demand for sustainable transportation options, such as electric vehicle fleets and optimized routing software. The rise of Software as a Service (SaaS) platforms for managing employee transportation logistics also contributes to market growth by providing real-time tracking, scheduling, and cost management capabilities. However, fluctuating fuel prices and economic downturns can pose challenges to market growth. The market is segmented by service type (MaaS, SaaS), ownership (company-owned, outsourced), transportation mode (cars, vans, buses), and region, with North America and Europe currently holding significant market shares. The competitive landscape features established players like Transdev and smaller, specialized providers catering to specific niche markets.
Staff Transportation Market Market Size (In Billion)
The future of the staff transportation market hinges on technological advancements and evolving business needs. The integration of artificial intelligence (AI) and machine learning (ML) for route optimization, predictive maintenance, and improved safety features will further shape the market trajectory. Furthermore, the increasing demand for flexible and on-demand transportation solutions will influence the adoption of innovative services. Government regulations promoting sustainable transportation and initiatives to alleviate traffic congestion will also play a significant role in driving market growth. The continuous expansion of the global workforce and the increasing importance of employee well-being and productivity will further contribute to the overall market expansion in the coming years. Companies are increasingly recognizing the value proposition of efficient and reliable staff transportation in attracting and retaining talent.
Staff Transportation Market Company Market Share
Staff Transportation Market: A Comprehensive Report (2019-2033)
This in-depth report provides a comprehensive analysis of the Staff Transportation Market, encompassing market dynamics, growth trends, regional insights, product landscapes, and key players. The study period covers 2019-2033, with a base year of 2025 and a forecast period of 2025-2033. The report segments the market by service type (MaaS, SaaS), ownership (company-owned, outsourced, rentals), passenger vehicle type (cars, vans, buses), and key geographic regions. The market size is projected to reach XX Million by 2033.
Staff Transportation Market Dynamics & Structure
The staff transportation market is characterized by moderate concentration, with several large players and a significant number of smaller, regional operators. Technological advancements, particularly in electric vehicles and transportation management software, are key drivers of innovation. Stringent regulatory frameworks concerning safety and emissions influence market dynamics. Competitive substitutes include ride-hailing services and private vehicle usage. The end-user demographic is largely comprised of businesses of all sizes, across diverse sectors. M&A activity has been moderate, with a total of xx deals recorded between 2019 and 2024.
- Market Concentration: Moderately concentrated, with a Herfindahl-Hirschman Index (HHI) of xx.
- Technological Innovation: Focus on electric vehicles, SaaS solutions for route optimization and fleet management.
- Regulatory Landscape: Evolving regulations regarding emissions, safety standards, and data privacy.
- Competitive Substitutes: Ride-sharing services, employee-owned vehicles.
- End-User Demographics: Diverse across industry sectors, ranging from SMEs to large corporations.
- M&A Activity: xx deals between 2019 and 2024, with an average deal value of xx Million.
Staff Transportation Market Growth Trends & Insights
The staff transportation market has witnessed consistent growth over the past five years, driven by increasing corporate demand for efficient and reliable employee commuting solutions. The adoption of MaaS solutions and SaaS-based fleet management systems is accelerating market expansion. Technological disruptions, such as the introduction of electric and autonomous vehicles, are reshaping the market landscape. Changing consumer preferences, prioritizing convenience, sustainability, and cost-effectiveness, further fuel market growth. The market is projected to exhibit a CAGR of xx% during the forecast period (2025-2033), reaching a market size of xx Million by 2033. Market penetration of electric buses in staff transportation is expected to reach xx% by 2033.
Dominant Regions, Countries, or Segments in Staff Transportation Market
North America and Europe currently dominate the staff transportation market, driven by high corporate density and advanced technological infrastructure. The Outsourced Transportation Service segment holds the largest market share, owing to cost-effectiveness and operational efficiency. Within passenger vehicle types, buses are the dominant mode for larger organizations. MaaS solutions are gaining traction in urban areas with robust public transport networks.
- Key Drivers:
- Strong economic growth in developed regions.
- Government initiatives promoting sustainable transportation.
- Increasing adoption of technology-driven solutions.
- Dominant Segments:
- Region: North America (xx% market share in 2025).
- Service Type: Outsourced Transportation Service (xx% market share in 2025).
- Passenger Vehicle Type: Buses (xx% market share in 2025).
Staff Transportation Market Product Landscape
The staff transportation market offers a range of services, from basic shuttle services to sophisticated MaaS solutions integrating various modes of transport. Product innovations focus on enhancing efficiency, safety, and sustainability. Key features include real-time tracking, route optimization, and integration with employee scheduling systems. Electric vehicle adoption is rapidly transforming the product landscape, offering environmentally friendly and cost-effective solutions.
Key Drivers, Barriers & Challenges in Staff Transportation Market
Key Drivers:
- Increasing urbanization and traffic congestion.
- Growing corporate focus on employee well-being and productivity.
- Technological advancements in vehicle electrification and fleet management.
- Government incentives for sustainable transportation.
Key Challenges:
- High initial investment costs associated with electric vehicle adoption.
- Regulatory hurdles and licensing requirements.
- Competition from existing public transportation and ride-sharing services.
- Fluctuations in fuel prices and labor costs.
Emerging Opportunities in Staff Transportation Market
- Expansion into underserved markets in developing economies.
- Integration of autonomous vehicles to enhance efficiency and safety.
- Development of customized staff transportation solutions for niche industries.
- Growing demand for on-demand and flexible transportation options.
Growth Accelerators in the Staff Transportation Market Industry
Long-term growth is anticipated due to continued technological advancements, strategic partnerships between transportation providers and technology companies, and expansion into new geographical markets. Government regulations promoting sustainable transportation and a growing focus on employee well-being are also significant growth catalysts.
Notable Milestones in Staff Transportation Market Sector
- December 2021: Transdev launched the largest electric bus fleet in the Nordic region (145 buses).
- September 2021: Uber India launched a corporate shuttle service.
- June 2022: Switch Mobility unveiled the EiV12 electric bus for staff transportation.
In-Depth Staff Transportation Market Market Outlook
The staff transportation market is poised for significant growth in the coming years, driven by increasing demand for efficient, sustainable, and cost-effective employee commuting solutions. Strategic partnerships, technological advancements, and expansion into new markets present significant opportunities for players in this sector. The market's long-term outlook is positive, with continued growth expected across various segments and regions.
Staff Transportation Market Segmentation
-
1. Ownership
- 1.1. Company-owned Transportation Service
- 1.2. Outsourced Transportation Service
- 1.3. Rentals
- 1.4. Pick and Drop Transportation Service
-
2. Passenger Vehicle Type
- 2.1. Cars
- 2.2. Vans
- 2.3. Bus
-
3. Service Type
- 3.1. Mobility as a Service (MaaS)
- 3.2. Software as a Service (SaaS)
Staff Transportation Market Segmentation By Geography
-
1. North America
- 1.1. United States
- 1.2. Canada
- 1.3. Rest of North America
-
2. Europe
- 2.1. Germany
- 2.2. United Kingdom
- 2.3. France
- 2.4. Rest of Europe
-
3. Asia Pacific
- 3.1. India
- 3.2. China
- 3.3. Japan
- 3.4. Rest of Asia Pacific
-
4. South America
- 4.1. Brazil
- 4.2. Argentina
- 4.3. Rest of the South America
-
5. Middle East and Africa
- 5.1. United Arab Emirates
- 5.2. Saudi Arabia
- 5.3. Rest of the Middle East and Africa
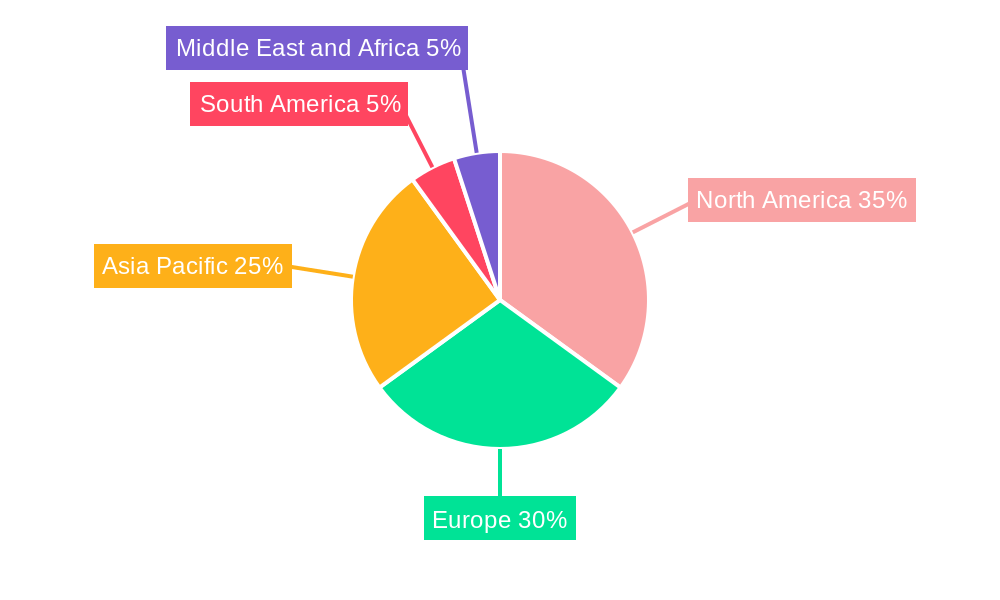
Staff Transportation Market Regional Market Share
Geographic Coverage of Staff Transportation Market
Staff Transportation Market REPORT HIGHLIGHTS
| Aspects | Details |
|---|---|
| Study Period | 2020-2034 |
| Base Year | 2025 |
| Estimated Year | 2026 |
| Forecast Period | 2026-2034 |
| Historical Period | 2020-2025 |
| Growth Rate | CAGR of 5.34% from 2020-2034 |
| Segmentation |
|
Table of Contents
- 1. Introduction
- 1.1. Research Scope
- 1.2. Market Segmentation
- 1.3. Research Objective
- 1.4. Definitions and Assumptions
- 2. Executive Summary
- 2.1. Market Snapshot
- 3. Market Dynamics
- 3.1. Market Drivers
- 3.2. Market Restrains
- 3.3. Market Trends
- 3.4. Market Opportunities
- 4. Market Factor Analysis
- 4.1. Porters Five Forces
- 4.1.1. Bargaining Power of Suppliers
- 4.1.2. Bargaining Power of Buyers
- 4.1.3. Threat of New Entrants
- 4.1.4. Threat of Substitutes
- 4.1.5. Competitive Rivalry
- 4.2. PESTEL analysis
- 4.3. BCG Analysis
- 4.3.1. Stars (High Growth, High Market Share)
- 4.3.2. Cash Cows (Low Growth, High Market Share)
- 4.3.3. Question Mark (High Growth, Low Market Share)
- 4.3.4. Dogs (Low Growth, Low Market Share)
- 4.4. Ansoff Matrix Analysis
- 4.5. Supply Chain Analysis
- 4.6. Regulatory Landscape
- 4.7. Current Market Potential and Opportunity Assessment (TAM–SAM–SOM Framework)
- 4.8. IMR Analyst Note
- 4.1. Porters Five Forces
- 5. Market Analysis, Insights and Forecast 2021-2033
- 5.1. Market Analysis, Insights and Forecast - by Ownership
- 5.1.1. Company-owned Transportation Service
- 5.1.2. Outsourced Transportation Service
- 5.1.3. Rentals
- 5.1.4. Pick and Drop Transportation Service
- 5.2. Market Analysis, Insights and Forecast - by Passenger Vehicle Type
- 5.2.1. Cars
- 5.2.2. Vans
- 5.2.3. Bus
- 5.3. Market Analysis, Insights and Forecast - by Service Type
- 5.3.1. Mobility as a Service (MaaS)
- 5.3.2. Software as a Service (SaaS)
- 5.4. Market Analysis, Insights and Forecast - by Region
- 5.4.1. North America
- 5.4.2. Europe
- 5.4.3. Asia Pacific
- 5.4.4. South America
- 5.4.5. Middle East and Africa
- 5.1. Market Analysis, Insights and Forecast - by Ownership
- 6. Global Staff Transportation Market Analysis, Insights and Forecast, 2021-2033
- 6.1. Market Analysis, Insights and Forecast - by Ownership
- 6.1.1. Company-owned Transportation Service
- 6.1.2. Outsourced Transportation Service
- 6.1.3. Rentals
- 6.1.4. Pick and Drop Transportation Service
- 6.2. Market Analysis, Insights and Forecast - by Passenger Vehicle Type
- 6.2.1. Cars
- 6.2.2. Vans
- 6.2.3. Bus
- 6.3. Market Analysis, Insights and Forecast - by Service Type
- 6.3.1. Mobility as a Service (MaaS)
- 6.3.2. Software as a Service (SaaS)
- 6.1. Market Analysis, Insights and Forecast - by Ownership
- 7. North America Staff Transportation Market Analysis, Insights and Forecast, 2020-2032
- 7.1. Market Analysis, Insights and Forecast - by Ownership
- 7.1.1. Company-owned Transportation Service
- 7.1.2. Outsourced Transportation Service
- 7.1.3. Rentals
- 7.1.4. Pick and Drop Transportation Service
- 7.2. Market Analysis, Insights and Forecast - by Passenger Vehicle Type
- 7.2.1. Cars
- 7.2.2. Vans
- 7.2.3. Bus
- 7.3. Market Analysis, Insights and Forecast - by Service Type
- 7.3.1. Mobility as a Service (MaaS)
- 7.3.2. Software as a Service (SaaS)
- 7.1. Market Analysis, Insights and Forecast - by Ownership
- 8. Europe Staff Transportation Market Analysis, Insights and Forecast, 2020-2032
- 8.1. Market Analysis, Insights and Forecast - by Ownership
- 8.1.1. Company-owned Transportation Service
- 8.1.2. Outsourced Transportation Service
- 8.1.3. Rentals
- 8.1.4. Pick and Drop Transportation Service
- 8.2. Market Analysis, Insights and Forecast - by Passenger Vehicle Type
- 8.2.1. Cars
- 8.2.2. Vans
- 8.2.3. Bus
- 8.3. Market Analysis, Insights and Forecast - by Service Type
- 8.3.1. Mobility as a Service (MaaS)
- 8.3.2. Software as a Service (SaaS)
- 8.1. Market Analysis, Insights and Forecast - by Ownership
- 9. Asia Pacific Staff Transportation Market Analysis, Insights and Forecast, 2020-2032
- 9.1. Market Analysis, Insights and Forecast - by Ownership
- 9.1.1. Company-owned Transportation Service
- 9.1.2. Outsourced Transportation Service
- 9.1.3. Rentals
- 9.1.4. Pick and Drop Transportation Service
- 9.2. Market Analysis, Insights and Forecast - by Passenger Vehicle Type
- 9.2.1. Cars
- 9.2.2. Vans
- 9.2.3. Bus
- 9.3. Market Analysis, Insights and Forecast - by Service Type
- 9.3.1. Mobility as a Service (MaaS)
- 9.3.2. Software as a Service (SaaS)
- 9.1. Market Analysis, Insights and Forecast - by Ownership
- 10. South America Staff Transportation Market Analysis, Insights and Forecast, 2020-2032
- 10.1. Market Analysis, Insights and Forecast - by Ownership
- 10.1.1. Company-owned Transportation Service
- 10.1.2. Outsourced Transportation Service
- 10.1.3. Rentals
- 10.1.4. Pick and Drop Transportation Service
- 10.2. Market Analysis, Insights and Forecast - by Passenger Vehicle Type
- 10.2.1. Cars
- 10.2.2. Vans
- 10.2.3. Bus
- 10.3. Market Analysis, Insights and Forecast - by Service Type
- 10.3.1. Mobility as a Service (MaaS)
- 10.3.2. Software as a Service (SaaS)
- 10.1. Market Analysis, Insights and Forecast - by Ownership
- 11. Middle East and Africa Staff Transportation Market Analysis, Insights and Forecast, 2020-2032
- 11.1. Market Analysis, Insights and Forecast - by Ownership
- 11.1.1. Company-owned Transportation Service
- 11.1.2. Outsourced Transportation Service
- 11.1.3. Rentals
- 11.1.4. Pick and Drop Transportation Service
- 11.2. Market Analysis, Insights and Forecast - by Passenger Vehicle Type
- 11.2.1. Cars
- 11.2.2. Vans
- 11.2.3. Bus
- 11.3. Market Analysis, Insights and Forecast - by Service Type
- 11.3.1. Mobility as a Service (MaaS)
- 11.3.2. Software as a Service (SaaS)
- 11.1. Market Analysis, Insights and Forecast - by Ownership
- 12. Competitive Analysis
- 12.1. Company Profiles
- 12.1.1 Shuttl
- 12.1.1.1. Company Overview
- 12.1.1.2. Products
- 12.1.1.3. Company Financials
- 12.1.1.4. SWOT Analysis
- 12.1.2 Sun Telematic
- 12.1.2.1. Company Overview
- 12.1.2.2. Products
- 12.1.2.3. Company Financials
- 12.1.2.4. SWOT Analysis
- 12.1.3 Eco rent a car
- 12.1.3.1. Company Overview
- 12.1.3.2. Products
- 12.1.3.3. Company Financials
- 12.1.3.4. SWOT Analysis
- 12.1.4 Move-In-Sync
- 12.1.4.1. Company Overview
- 12.1.4.2. Products
- 12.1.4.3. Company Financials
- 12.1.4.4. SWOT Analysis
- 12.1.5 Transdev
- 12.1.5.1. Company Overview
- 12.1.5.2. Products
- 12.1.5.3. Company Financials
- 12.1.5.4. SWOT Analysis
- 12.1.6 Prairie Bus Line Limited
- 12.1.6.1. Company Overview
- 12.1.6.2. Products
- 12.1.6.3. Company Financials
- 12.1.6.4. SWOT Analysis
- 12.1.7 Janani Tours
- 12.1.7.1. Company Overview
- 12.1.7.2. Products
- 12.1.7.3. Company Financials
- 12.1.7.4. SWOT Analysis
- 12.1.8 Busbank (Global Charter Services Ltd )
- 12.1.8.1. Company Overview
- 12.1.8.2. Products
- 12.1.8.3. Company Financials
- 12.1.8.4. SWOT Analysis
- 12.1.9 First Class Tours
- 12.1.9.1. Company Overview
- 12.1.9.2. Products
- 12.1.9.3. Company Financials
- 12.1.9.4. SWOT Analysis
- 12.1.1 Shuttl
- 12.2. Market Entropy
- 12.2.1 Company's Key Areas Served
- 12.2.2 Recent Developments
- 12.3. Company Market Share Analysis 2025
- 12.3.1 Top 5 Companies Market Share Analysis
- 12.3.2 Top 3 Companies Market Share Analysis
- 12.4. List of Potential Customers
- 13. Research Methodology
List of Figures
- Figure 1: Global Staff Transportation Market Revenue Breakdown (Million, %) by Region 2025 & 2033
- Figure 2: North America Staff Transportation Market Revenue (Million), by Ownership 2025 & 2033
- Figure 3: North America Staff Transportation Market Revenue Share (%), by Ownership 2025 & 2033
- Figure 4: North America Staff Transportation Market Revenue (Million), by Passenger Vehicle Type 2025 & 2033
- Figure 5: North America Staff Transportation Market Revenue Share (%), by Passenger Vehicle Type 2025 & 2033
- Figure 6: North America Staff Transportation Market Revenue (Million), by Service Type 2025 & 2033
- Figure 7: North America Staff Transportation Market Revenue Share (%), by Service Type 2025 & 2033
- Figure 8: North America Staff Transportation Market Revenue (Million), by Country 2025 & 2033
- Figure 9: North America Staff Transportation Market Revenue Share (%), by Country 2025 & 2033
- Figure 10: Europe Staff Transportation Market Revenue (Million), by Ownership 2025 & 2033
- Figure 11: Europe Staff Transportation Market Revenue Share (%), by Ownership 2025 & 2033
- Figure 12: Europe Staff Transportation Market Revenue (Million), by Passenger Vehicle Type 2025 & 2033
- Figure 13: Europe Staff Transportation Market Revenue Share (%), by Passenger Vehicle Type 2025 & 2033
- Figure 14: Europe Staff Transportation Market Revenue (Million), by Service Type 2025 & 2033
- Figure 15: Europe Staff Transportation Market Revenue Share (%), by Service Type 2025 & 2033
- Figure 16: Europe Staff Transportation Market Revenue (Million), by Country 2025 & 2033
- Figure 17: Europe Staff Transportation Market Revenue Share (%), by Country 2025 & 2033
- Figure 18: Asia Pacific Staff Transportation Market Revenue (Million), by Ownership 2025 & 2033
- Figure 19: Asia Pacific Staff Transportation Market Revenue Share (%), by Ownership 2025 & 2033
- Figure 20: Asia Pacific Staff Transportation Market Revenue (Million), by Passenger Vehicle Type 2025 & 2033
- Figure 21: Asia Pacific Staff Transportation Market Revenue Share (%), by Passenger Vehicle Type 2025 & 2033
- Figure 22: Asia Pacific Staff Transportation Market Revenue (Million), by Service Type 2025 & 2033
- Figure 23: Asia Pacific Staff Transportation Market Revenue Share (%), by Service Type 2025 & 2033
- Figure 24: Asia Pacific Staff Transportation Market Revenue (Million), by Country 2025 & 2033
- Figure 25: Asia Pacific Staff Transportation Market Revenue Share (%), by Country 2025 & 2033
- Figure 26: South America Staff Transportation Market Revenue (Million), by Ownership 2025 & 2033
- Figure 27: South America Staff Transportation Market Revenue Share (%), by Ownership 2025 & 2033
- Figure 28: South America Staff Transportation Market Revenue (Million), by Passenger Vehicle Type 2025 & 2033
- Figure 29: South America Staff Transportation Market Revenue Share (%), by Passenger Vehicle Type 2025 & 2033
- Figure 30: South America Staff Transportation Market Revenue (Million), by Service Type 2025 & 2033
- Figure 31: South America Staff Transportation Market Revenue Share (%), by Service Type 2025 & 2033
- Figure 32: South America Staff Transportation Market Revenue (Million), by Country 2025 & 2033
- Figure 33: South America Staff Transportation Market Revenue Share (%), by Country 2025 & 2033
- Figure 34: Middle East and Africa Staff Transportation Market Revenue (Million), by Ownership 2025 & 2033
- Figure 35: Middle East and Africa Staff Transportation Market Revenue Share (%), by Ownership 2025 & 2033
- Figure 36: Middle East and Africa Staff Transportation Market Revenue (Million), by Passenger Vehicle Type 2025 & 2033
- Figure 37: Middle East and Africa Staff Transportation Market Revenue Share (%), by Passenger Vehicle Type 2025 & 2033
- Figure 38: Middle East and Africa Staff Transportation Market Revenue (Million), by Service Type 2025 & 2033
- Figure 39: Middle East and Africa Staff Transportation Market Revenue Share (%), by Service Type 2025 & 2033
- Figure 40: Middle East and Africa Staff Transportation Market Revenue (Million), by Country 2025 & 2033
- Figure 41: Middle East and Africa Staff Transportation Market Revenue Share (%), by Country 2025 & 2033
List of Tables
- Table 1: Global Staff Transportation Market Revenue Million Forecast, by Ownership 2020 & 2033
- Table 2: Global Staff Transportation Market Revenue Million Forecast, by Passenger Vehicle Type 2020 & 2033
- Table 3: Global Staff Transportation Market Revenue Million Forecast, by Service Type 2020 & 2033
- Table 4: Global Staff Transportation Market Revenue Million Forecast, by Region 2020 & 2033
- Table 5: Global Staff Transportation Market Revenue Million Forecast, by Ownership 2020 & 2033
- Table 6: Global Staff Transportation Market Revenue Million Forecast, by Passenger Vehicle Type 2020 & 2033
- Table 7: Global Staff Transportation Market Revenue Million Forecast, by Service Type 2020 & 2033
- Table 8: Global Staff Transportation Market Revenue Million Forecast, by Country 2020 & 2033
- Table 9: United States Staff Transportation Market Revenue (Million) Forecast, by Application 2020 & 2033
- Table 10: Canada Staff Transportation Market Revenue (Million) Forecast, by Application 2020 & 2033
- Table 11: Rest of North America Staff Transportation Market Revenue (Million) Forecast, by Application 2020 & 2033
- Table 12: Global Staff Transportation Market Revenue Million Forecast, by Ownership 2020 & 2033
- Table 13: Global Staff Transportation Market Revenue Million Forecast, by Passenger Vehicle Type 2020 & 2033
- Table 14: Global Staff Transportation Market Revenue Million Forecast, by Service Type 2020 & 2033
- Table 15: Global Staff Transportation Market Revenue Million Forecast, by Country 2020 & 2033
- Table 16: Germany Staff Transportation Market Revenue (Million) Forecast, by Application 2020 & 2033
- Table 17: United Kingdom Staff Transportation Market Revenue (Million) Forecast, by Application 2020 & 2033
- Table 18: France Staff Transportation Market Revenue (Million) Forecast, by Application 2020 & 2033
- Table 19: Rest of Europe Staff Transportation Market Revenue (Million) Forecast, by Application 2020 & 2033
- Table 20: Global Staff Transportation Market Revenue Million Forecast, by Ownership 2020 & 2033
- Table 21: Global Staff Transportation Market Revenue Million Forecast, by Passenger Vehicle Type 2020 & 2033
- Table 22: Global Staff Transportation Market Revenue Million Forecast, by Service Type 2020 & 2033
- Table 23: Global Staff Transportation Market Revenue Million Forecast, by Country 2020 & 2033
- Table 24: India Staff Transportation Market Revenue (Million) Forecast, by Application 2020 & 2033
- Table 25: China Staff Transportation Market Revenue (Million) Forecast, by Application 2020 & 2033
- Table 26: Japan Staff Transportation Market Revenue (Million) Forecast, by Application 2020 & 2033
- Table 27: Rest of Asia Pacific Staff Transportation Market Revenue (Million) Forecast, by Application 2020 & 2033
- Table 28: Global Staff Transportation Market Revenue Million Forecast, by Ownership 2020 & 2033
- Table 29: Global Staff Transportation Market Revenue Million Forecast, by Passenger Vehicle Type 2020 & 2033
- Table 30: Global Staff Transportation Market Revenue Million Forecast, by Service Type 2020 & 2033
- Table 31: Global Staff Transportation Market Revenue Million Forecast, by Country 2020 & 2033
- Table 32: Brazil Staff Transportation Market Revenue (Million) Forecast, by Application 2020 & 2033
- Table 33: Argentina Staff Transportation Market Revenue (Million) Forecast, by Application 2020 & 2033
- Table 34: Rest of the South America Staff Transportation Market Revenue (Million) Forecast, by Application 2020 & 2033
- Table 35: Global Staff Transportation Market Revenue Million Forecast, by Ownership 2020 & 2033
- Table 36: Global Staff Transportation Market Revenue Million Forecast, by Passenger Vehicle Type 2020 & 2033
- Table 37: Global Staff Transportation Market Revenue Million Forecast, by Service Type 2020 & 2033
- Table 38: Global Staff Transportation Market Revenue Million Forecast, by Country 2020 & 2033
- Table 39: United Arab Emirates Staff Transportation Market Revenue (Million) Forecast, by Application 2020 & 2033
- Table 40: Saudi Arabia Staff Transportation Market Revenue (Million) Forecast, by Application 2020 & 2033
- Table 41: Rest of the Middle East and Africa Staff Transportation Market Revenue (Million) Forecast, by Application 2020 & 2033
Frequently Asked Questions
1. What is the projected Compound Annual Growth Rate (CAGR) of the Staff Transportation Market?
The projected CAGR is approximately 5.34%.
2. Which companies are prominent players in the Staff Transportation Market?
Key companies in the market include Shuttl, Sun Telematic, Eco rent a car, Move-In-Sync, Transdev, Prairie Bus Line Limited, Janani Tours, Busbank (Global Charter Services Ltd ), First Class Tours.
3. What are the main segments of the Staff Transportation Market?
The market segments include Ownership, Passenger Vehicle Type, Service Type.
4. Can you provide details about the market size?
The market size is estimated to be USD 38.14 Million as of 2022.
5. What are some drivers contributing to market growth?
Stringent Emission Regulations are Fueling the Market Growth.
6. What are the notable trends driving market growth?
Increasing Internet Usage and Technological Advancements to Drive Demand in the Market.
7. Are there any restraints impacting market growth?
High Cost of Electric Commercial Vehicle May Hamper the Growth.
8. Can you provide examples of recent developments in the market?
June 2022: Switch Mobility, the electric vehicle division of Hinduja Group flagship Ashok Leyland, unveiled the EiV12 electric bus, aiming to capture a significant share of the electric vehicle market with a slew of customer-friendly features. The company intends to serve inter-city, and intra-city, staff transportation with this launch.
9. What pricing options are available for accessing the report?
Pricing options include single-user, multi-user, and enterprise licenses priced at USD 4750, USD 5250, and USD 8750 respectively.
10. Is the market size provided in terms of value or volume?
The market size is provided in terms of value, measured in Million.
11. Are there any specific market keywords associated with the report?
Yes, the market keyword associated with the report is "Staff Transportation Market," which aids in identifying and referencing the specific market segment covered.
12. How do I determine which pricing option suits my needs best?
The pricing options vary based on user requirements and access needs. Individual users may opt for single-user licenses, while businesses requiring broader access may choose multi-user or enterprise licenses for cost-effective access to the report.
13. Are there any additional resources or data provided in the Staff Transportation Market report?
While the report offers comprehensive insights, it's advisable to review the specific contents or supplementary materials provided to ascertain if additional resources or data are available.
14. How can I stay updated on further developments or reports in the Staff Transportation Market?
To stay informed about further developments, trends, and reports in the Staff Transportation Market, consider subscribing to industry newsletters, following relevant companies and organizations, or regularly checking reputable industry news sources and publications.
Methodology
Step 1 - Identification of Relevant Samples Size from Population Database


Step 2 - Approaches for Defining Global Market Size (Value, Volume* & Price*)

Note*: In applicable scenarios
Step 3 - Data Sources
Primary Research
- Web Analytics
- Survey Reports
- Research Institute
- Latest Research Reports
- Opinion Leaders
Secondary Research
- Annual Reports
- White Paper
- Latest Press Release
- Industry Association
- Paid Database
- Investor Presentations

Step 4 - Data Triangulation
Involves using different sources of information in order to increase the validity of a study
These sources are likely to be stakeholders in a program - participants, other researchers, program staff, other community members, and so on.
Then we put all data in single framework & apply various statistical tools to find out the dynamic on the market.
During the analysis stage, feedback from the stakeholder groups would be compared to determine areas of agreement as well as areas of divergence