

Key Insights
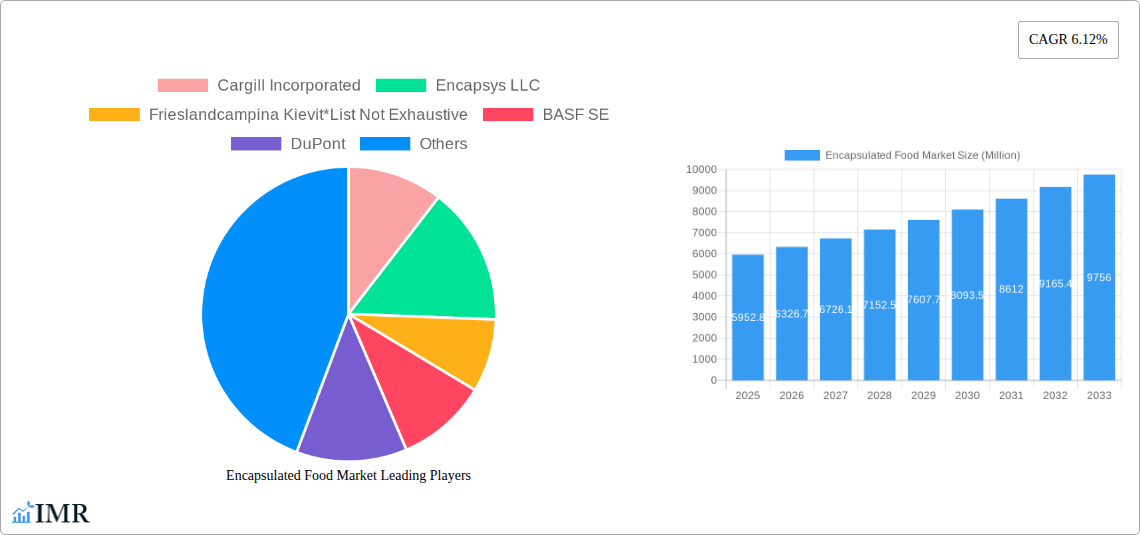
The global encapsulated food market, valued at $5,952.8 million in 2025, is projected to experience robust growth, driven by increasing consumer demand for healthier and more convenient food products. The market's Compound Annual Growth Rate (CAGR) of 6.12% from 2025 to 2033 reflects a significant expansion, fueled by several key factors. The rising prevalence of chronic diseases and growing awareness of the health benefits associated with targeted nutrient delivery are major drivers. Technological advancements in encapsulation techniques, particularly in microencapsulation and nanoencapsulation, are enabling the creation of more stable, bioavailable, and controlled-release food products. This is further enhanced by the expanding application of encapsulated ingredients across various food categories, including functional foods, dietary supplements, and fortified beverages. The diverse range of core materials, including vitamins, minerals, probiotics, and essential oils, contributes to market diversification and growth potential. The preference for natural and clean-label ingredients is also influencing market trends, with increasing demand for polysaccharide and protein-based encapsulation materials. Geographic expansion, particularly in developing economies with rising disposable incomes, also promises considerable growth potential.
Market segmentation reveals substantial opportunities across different technologies, materials, and core phases. Microencapsulation currently dominates the technology segment, but nanoencapsulation is witnessing significant growth due to its superior delivery capabilities. The polysaccharide and protein-based shell materials are expected to continue leading the material type segment owing to their biocompatibility and cost-effectiveness. Vitamins and probiotics remain major drivers in the core phase segment. However, the market is witnessing a surge in demand for other core phase materials, such as organic acids and prebiotics, reflecting the evolving consumer preferences and increasing focus on gut health. Key players in the encapsulated food market are strategically investing in research and development, innovation, and mergers and acquisitions to strengthen their market position and cater to the growing demand. The competitive landscape is characterized by both large multinational corporations and specialized smaller companies focusing on specific niche applications.
Encapsulated Food Market: A Comprehensive Report (2019-2033)
This comprehensive report provides a detailed analysis of the encapsulated food market, encompassing market dynamics, growth trends, regional dominance, product landscape, key players, and future outlook. The study period spans from 2019 to 2033, with 2025 serving as the base and estimated year. The report offers valuable insights for industry professionals, investors, and stakeholders seeking to understand and capitalize on the opportunities within this dynamic market. The parent market is the Food Additives Market and the child market is the Encapsulated Food Market.
Encapsulated Food Market Market Dynamics & Structure
The global encapsulated food market, valued at xx million units in 2025, is characterized by moderate concentration with several key players holding significant market share. Technological innovation, particularly in microencapsulation and nanoencapsulation techniques, is a primary growth driver. Stringent regulatory frameworks governing food safety and labeling influence product development and market access. Competitive pressures from substitute technologies and ingredients are also evident. M&A activity in the sector has been relatively moderate (xx deals in the last 5 years), primarily focused on expanding product portfolios and geographical reach. End-user demographics, notably the increasing demand for functional foods and fortified products, are fueling market growth.
- Market Concentration: Moderately concentrated, with top 5 players holding approximately xx% market share in 2025.
- Technological Innovation: Significant advancements in encapsulation technologies, including hybrid approaches, are improving product efficacy and shelf life.
- Regulatory Landscape: Stringent regulations regarding food additives and labeling impact market entry and product formulation.
- Competitive Substitutes: Traditional methods of food fortification pose competitive pressure.
- M&A Activity: xx M&A deals recorded between 2020 and 2024, focusing on geographical expansion and product diversification.
- End-User Demographics: Growing demand for functional foods and convenience drives market expansion.
Encapsulated Food Market Growth Trends & Insights
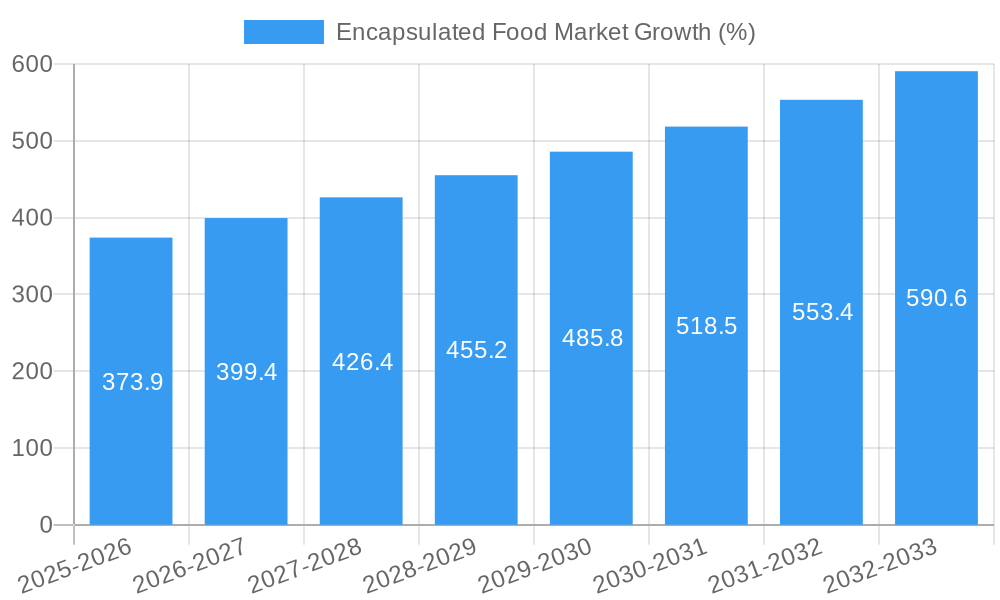
The encapsulated food market exhibits a robust growth trajectory, driven by increasing consumer awareness of health and wellness, coupled with the rising demand for functional foods and fortified products. The market experienced a CAGR of xx% during the historical period (2019-2024) and is projected to maintain a CAGR of xx% during the forecast period (2025-2033), reaching a value of xx million units by 2033. Technological disruptions, particularly the advancement of nanoencapsulation and hybrid technologies, are enhancing product quality and expanding applications. Shifting consumer preferences towards natural and clean-label ingredients are influencing product development strategies. Market penetration is expected to increase significantly, particularly in developing economies, driven by rising disposable incomes and changing dietary habits. This analysis incorporates data from various market research firms and industry reports, providing a comprehensive overview of market evolution and adoption rates.
Dominant Regions, Countries, or Segments in Encapsulated Food Market
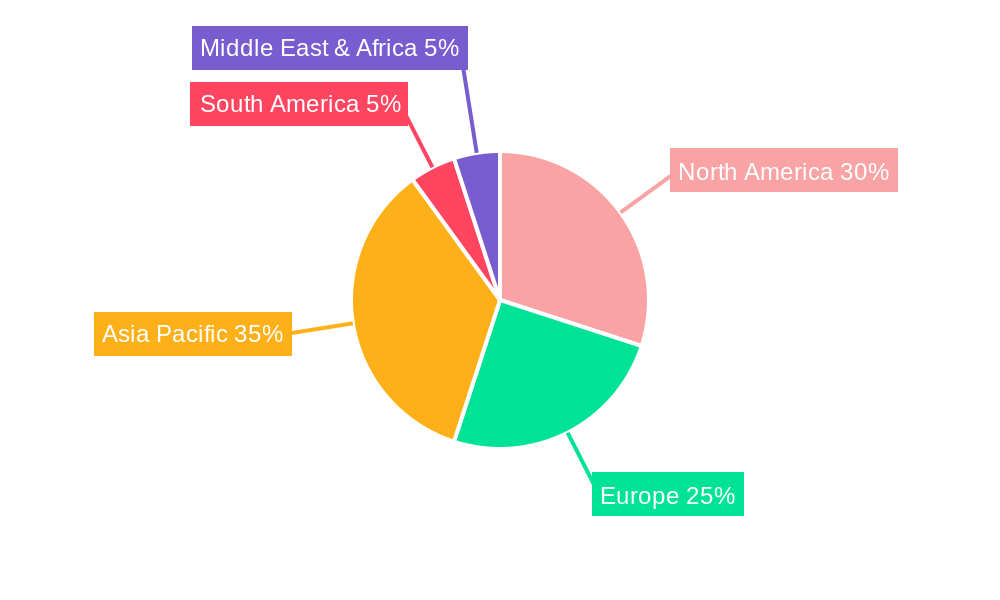
North America currently holds the largest market share in the encapsulated food market, driven by strong demand for functional foods and advanced encapsulation technologies. Within the segments, microencapsulation dominates by technology, followed by hybrid technologies, while polysaccharides are the leading material type. Vitamins and minerals constitute the largest core phase segment, followed by probiotics and prebiotics. Key growth drivers include the increasing prevalence of chronic diseases, rising consumer health awareness, and favorable government regulations.
- North America: High market share attributed to strong demand for functional foods and advanced technologies.
- Europe: Significant market growth due to rising health consciousness and regulatory support.
- Asia-Pacific: Fastest-growing region driven by increasing disposable incomes and changing dietary habits.
- By Technology: Microencapsulation holds the largest share, followed by hybrid and then nanoencapsulation.
- By Material Type: Polysaccharides remain the dominant material, followed by proteins and lipids.
- By Core Phase: Vitamins and minerals are the most widely encapsulated components.
Encapsulated Food Market Product Landscape
The encapsulated food market showcases continuous innovation in product formulations and delivery systems. Products are designed to enhance nutrient stability, bioavailability, and mask undesirable flavors or odors. Technological advancements such as layer-by-layer encapsulation and the use of novel shell materials are improving product performance and expanding applications. Unique selling propositions include extended shelf life, improved controlled release, and enhanced sensory properties.
Key Drivers, Barriers & Challenges in Encapsulated Food Market
Key Drivers:
- Rising consumer demand for functional foods and fortified products.
- Technological advancements in encapsulation techniques.
- Increasing prevalence of chronic diseases.
- Favorable government regulations supporting food fortification.
Challenges & Restraints:
- High initial investment costs associated with encapsulation technologies.
- Stringent regulatory requirements for food additives and labeling.
- Potential challenges related to scale-up and manufacturing processes.
- Competition from alternative food fortification methods.
Emerging Opportunities in Encapsulated Food Market
- Expanding applications in the nutraceutical and pharmaceutical industries.
- Development of novel encapsulation materials with enhanced functionality.
- Growing interest in personalized nutrition and targeted delivery systems.
- Increased demand for sustainable and eco-friendly encapsulation technologies.
Growth Accelerators in the Encapsulated Food Market Industry
Strategic partnerships between ingredient suppliers and food manufacturers are accelerating market growth. Technological advancements in encapsulation technologies are expanding application possibilities and improving product efficacy. Market expansion into developing economies, driven by rising disposable incomes and health awareness, represents a significant growth opportunity.
Key Players Shaping the Encapsulated Food Market Market
- Cargill Incorporated
- Encapsys LLC
- Frieslandcampina Kievit
- BASF SE
- DuPont
- ADVANCED BIONUTRITION CORP
- Ingredion Incorporated
- GAT Food Essentials GmbH
Notable Milestones in Encapsulated Food Market Sector
- 2021: Launch of a novel microencapsulation technology by Cargill Incorporated.
- 2022: Acquisition of a smaller encapsulation company by BASF SE.
- 2023: Introduction of a new line of encapsulated probiotics by FrieslandCampina Kievit.
- 2024: Approval of a new encapsulation technology by a major regulatory body.
In-Depth Encapsulated Food Market Market Outlook
The encapsulated food market is poised for continued growth, driven by technological innovation, expanding applications, and increasing consumer demand for healthier food products. Strategic partnerships, market expansion into new regions, and the development of sustainable and eco-friendly technologies will further accelerate market expansion. The long-term outlook remains positive, with significant opportunities for both established players and new entrants.
Encapsulated Food Market Segmentation
-
1. Technology
- 1.1. Microencapsulation
- 1.2. Nano encapsulation
- 1.3. Hybrid technologies
-
2. Material Type
- 2.1. Polysaccharides
- 2.2. Proteins
- 2.3. Lipids
- 2.4. Emulsifiers
- 2.5. Other Shell Materials
-
3. Core Phase
- 3.1. Vitamins
- 3.2. Minerals
- 3.3. Enzymes
- 3.4. Organic Acids
- 3.5. Additives
- 3.6. Probiotics
- 3.7. Prebiotics
- 3.8. Essential oils
- 3.9. Other Core Phase Materials
Encapsulated Food Market Segmentation By Geography
-
1. North America
- 1.1. United States
- 1.2. Canada
- 1.3. Mexico
- 1.4. Rest of North America
-
2. Europe
- 2.1. United Kingdom
- 2.2. Germany
- 2.3. France
- 2.4. Russia
- 2.5. Italy
- 2.6. Spain
- 2.7. Rest of Europe
-
3. Asia Pacific
- 3.1. India
- 3.2. China
- 3.3. Japan
- 3.4. Australia
- 3.5. Rest of Asia Pacific
-
4. South America
- 4.1. Brazil
- 4.2. Argentina
- 4.3. Rest of South America
- 5. Middle East
-
6. South Africa
- 6.1. Saudi Arabia
- 6.2. Rest of Middle East
Encapsulated Food Market REPORT HIGHLIGHTS
| Aspects | Details |
|---|---|
| Study Period | 2019-2033 |
| Base Year | 2024 |
| Estimated Year | 2025 |
| Forecast Period | 2025-2033 |
| Historical Period | 2019-2024 |
| Growth Rate | CAGR of 6.12% from 2019-2033 |
| Segmentation |
|
Table of Contents
- 1. Introduction
- 1.1. Research Scope
- 1.2. Market Segmentation
- 1.3. Research Methodology
- 1.4. Definitions and Assumptions
- 2. Executive Summary
- 2.1. Introduction
- 3. Market Dynamics
- 3.1. Introduction
- 3.2. Market Drivers
- 3.2.1. Awareness of Health Benefits Associated with Tocotrienol; Escalating Demand for Anti-Aging Products Containing Tocotrienol
- 3.3. Market Restrains
- 3.3.1. Availability of Substitutes
- 3.4. Market Trends
- 3.4.1. Growing Demand of Dietary Supplement
- 4. Market Factor Analysis
- 4.1. Porters Five Forces
- 4.2. Supply/Value Chain
- 4.3. PESTEL analysis
- 4.4. Market Entropy
- 4.5. Patent/Trademark Analysis
- 5. Global Encapsulated Food Market Analysis, Insights and Forecast, 2019-2031
- 5.1. Market Analysis, Insights and Forecast - by Technology
- 5.1.1. Microencapsulation
- 5.1.2. Nano encapsulation
- 5.1.3. Hybrid technologies
- 5.2. Market Analysis, Insights and Forecast - by Material Type
- 5.2.1. Polysaccharides
- 5.2.2. Proteins
- 5.2.3. Lipids
- 5.2.4. Emulsifiers
- 5.2.5. Other Shell Materials
- 5.3. Market Analysis, Insights and Forecast - by Core Phase
- 5.3.1. Vitamins
- 5.3.2. Minerals
- 5.3.3. Enzymes
- 5.3.4. Organic Acids
- 5.3.5. Additives
- 5.3.6. Probiotics
- 5.3.7. Prebiotics
- 5.3.8. Essential oils
- 5.3.9. Other Core Phase Materials
- 5.4. Market Analysis, Insights and Forecast - by Region
- 5.4.1. North America
- 5.4.2. Europe
- 5.4.3. Asia Pacific
- 5.4.4. South America
- 5.4.5. Middle East
- 5.4.6. South Africa
- 5.1. Market Analysis, Insights and Forecast - by Technology
- 6. North America Encapsulated Food Market Analysis, Insights and Forecast, 2019-2031
- 6.1. Market Analysis, Insights and Forecast - by Technology
- 6.1.1. Microencapsulation
- 6.1.2. Nano encapsulation
- 6.1.3. Hybrid technologies
- 6.2. Market Analysis, Insights and Forecast - by Material Type
- 6.2.1. Polysaccharides
- 6.2.2. Proteins
- 6.2.3. Lipids
- 6.2.4. Emulsifiers
- 6.2.5. Other Shell Materials
- 6.3. Market Analysis, Insights and Forecast - by Core Phase
- 6.3.1. Vitamins
- 6.3.2. Minerals
- 6.3.3. Enzymes
- 6.3.4. Organic Acids
- 6.3.5. Additives
- 6.3.6. Probiotics
- 6.3.7. Prebiotics
- 6.3.8. Essential oils
- 6.3.9. Other Core Phase Materials
- 6.1. Market Analysis, Insights and Forecast - by Technology
- 7. Europe Encapsulated Food Market Analysis, Insights and Forecast, 2019-2031
- 7.1. Market Analysis, Insights and Forecast - by Technology
- 7.1.1. Microencapsulation
- 7.1.2. Nano encapsulation
- 7.1.3. Hybrid technologies
- 7.2. Market Analysis, Insights and Forecast - by Material Type
- 7.2.1. Polysaccharides
- 7.2.2. Proteins
- 7.2.3. Lipids
- 7.2.4. Emulsifiers
- 7.2.5. Other Shell Materials
- 7.3. Market Analysis, Insights and Forecast - by Core Phase
- 7.3.1. Vitamins
- 7.3.2. Minerals
- 7.3.3. Enzymes
- 7.3.4. Organic Acids
- 7.3.5. Additives
- 7.3.6. Probiotics
- 7.3.7. Prebiotics
- 7.3.8. Essential oils
- 7.3.9. Other Core Phase Materials
- 7.1. Market Analysis, Insights and Forecast - by Technology
- 8. Asia Pacific Encapsulated Food Market Analysis, Insights and Forecast, 2019-2031
- 8.1. Market Analysis, Insights and Forecast - by Technology
- 8.1.1. Microencapsulation
- 8.1.2. Nano encapsulation
- 8.1.3. Hybrid technologies
- 8.2. Market Analysis, Insights and Forecast - by Material Type
- 8.2.1. Polysaccharides
- 8.2.2. Proteins
- 8.2.3. Lipids
- 8.2.4. Emulsifiers
- 8.2.5. Other Shell Materials
- 8.3. Market Analysis, Insights and Forecast - by Core Phase
- 8.3.1. Vitamins
- 8.3.2. Minerals
- 8.3.3. Enzymes
- 8.3.4. Organic Acids
- 8.3.5. Additives
- 8.3.6. Probiotics
- 8.3.7. Prebiotics
- 8.3.8. Essential oils
- 8.3.9. Other Core Phase Materials
- 8.1. Market Analysis, Insights and Forecast - by Technology
- 9. South America Encapsulated Food Market Analysis, Insights and Forecast, 2019-2031
- 9.1. Market Analysis, Insights and Forecast - by Technology
- 9.1.1. Microencapsulation
- 9.1.2. Nano encapsulation
- 9.1.3. Hybrid technologies
- 9.2. Market Analysis, Insights and Forecast - by Material Type
- 9.2.1. Polysaccharides
- 9.2.2. Proteins
- 9.2.3. Lipids
- 9.2.4. Emulsifiers
- 9.2.5. Other Shell Materials
- 9.3. Market Analysis, Insights and Forecast - by Core Phase
- 9.3.1. Vitamins
- 9.3.2. Minerals
- 9.3.3. Enzymes
- 9.3.4. Organic Acids
- 9.3.5. Additives
- 9.3.6. Probiotics
- 9.3.7. Prebiotics
- 9.3.8. Essential oils
- 9.3.9. Other Core Phase Materials
- 9.1. Market Analysis, Insights and Forecast - by Technology
- 10. Middle East Encapsulated Food Market Analysis, Insights and Forecast, 2019-2031
- 10.1. Market Analysis, Insights and Forecast - by Technology
- 10.1.1. Microencapsulation
- 10.1.2. Nano encapsulation
- 10.1.3. Hybrid technologies
- 10.2. Market Analysis, Insights and Forecast - by Material Type
- 10.2.1. Polysaccharides
- 10.2.2. Proteins
- 10.2.3. Lipids
- 10.2.4. Emulsifiers
- 10.2.5. Other Shell Materials
- 10.3. Market Analysis, Insights and Forecast - by Core Phase
- 10.3.1. Vitamins
- 10.3.2. Minerals
- 10.3.3. Enzymes
- 10.3.4. Organic Acids
- 10.3.5. Additives
- 10.3.6. Probiotics
- 10.3.7. Prebiotics
- 10.3.8. Essential oils
- 10.3.9. Other Core Phase Materials
- 10.1. Market Analysis, Insights and Forecast - by Technology
- 11. South Africa Encapsulated Food Market Analysis, Insights and Forecast, 2019-2031
- 11.1. Market Analysis, Insights and Forecast - by Technology
- 11.1.1. Microencapsulation
- 11.1.2. Nano encapsulation
- 11.1.3. Hybrid technologies
- 11.2. Market Analysis, Insights and Forecast - by Material Type
- 11.2.1. Polysaccharides
- 11.2.2. Proteins
- 11.2.3. Lipids
- 11.2.4. Emulsifiers
- 11.2.5. Other Shell Materials
- 11.3. Market Analysis, Insights and Forecast - by Core Phase
- 11.3.1. Vitamins
- 11.3.2. Minerals
- 11.3.3. Enzymes
- 11.3.4. Organic Acids
- 11.3.5. Additives
- 11.3.6. Probiotics
- 11.3.7. Prebiotics
- 11.3.8. Essential oils
- 11.3.9. Other Core Phase Materials
- 11.1. Market Analysis, Insights and Forecast - by Technology
- 12. North America Encapsulated Food Market Analysis, Insights and Forecast, 2019-2031
- 12.1. Market Analysis, Insights and Forecast - By Country/Sub-region
- 12.1.1 United States
- 12.1.2 Canada
- 12.1.3 Mexico
- 12.1.4 Rest of North America
- 13. Europe Encapsulated Food Market Analysis, Insights and Forecast, 2019-2031
- 13.1. Market Analysis, Insights and Forecast - By Country/Sub-region
- 13.1.1 United Kingdom
- 13.1.2 Germany
- 13.1.3 France
- 13.1.4 Russia
- 13.1.5 Italy
- 13.1.6 Spain
- 13.1.7 Rest of Europe
- 14. Asia Pacific Encapsulated Food Market Analysis, Insights and Forecast, 2019-2031
- 14.1. Market Analysis, Insights and Forecast - By Country/Sub-region
- 14.1.1 India
- 14.1.2 China
- 14.1.3 Japan
- 14.1.4 Australia
- 14.1.5 Rest of Asia Pacific
- 15. South America Encapsulated Food Market Analysis, Insights and Forecast, 2019-2031
- 15.1. Market Analysis, Insights and Forecast - By Country/Sub-region
- 15.1.1 Brazil
- 15.1.2 Argentina
- 15.1.3 Rest of South America
- 16. Middle East & Africa Encapsulated Food Market Analysis, Insights and Forecast, 2019-2031
- 16.1. Market Analysis, Insights and Forecast - By Country/Sub-region
- 16.1.1 UAE
- 16.1.2 South Africa
- 16.1.3 Saudi Arabia
- 16.1.4 Rest of MEA
- 17. Competitive Analysis
- 17.1. Global Market Share Analysis 2024
- 17.2. Company Profiles
- 17.2.1 Cargill Incorporated
- 17.2.1.1. Overview
- 17.2.1.2. Products
- 17.2.1.3. SWOT Analysis
- 17.2.1.4. Recent Developments
- 17.2.1.5. Financials (Based on Availability)
- 17.2.2 Encapsys LLC
- 17.2.2.1. Overview
- 17.2.2.2. Products
- 17.2.2.3. SWOT Analysis
- 17.2.2.4. Recent Developments
- 17.2.2.5. Financials (Based on Availability)
- 17.2.3 Frieslandcampina Kievit*List Not Exhaustive
- 17.2.3.1. Overview
- 17.2.3.2. Products
- 17.2.3.3. SWOT Analysis
- 17.2.3.4. Recent Developments
- 17.2.3.5. Financials (Based on Availability)
- 17.2.4 BASF SE
- 17.2.4.1. Overview
- 17.2.4.2. Products
- 17.2.4.3. SWOT Analysis
- 17.2.4.4. Recent Developments
- 17.2.4.5. Financials (Based on Availability)
- 17.2.5 DuPont
- 17.2.5.1. Overview
- 17.2.5.2. Products
- 17.2.5.3. SWOT Analysis
- 17.2.5.4. Recent Developments
- 17.2.5.5. Financials (Based on Availability)
- 17.2.6 ADVANCED BIONUTRITION CORP
- 17.2.6.1. Overview
- 17.2.6.2. Products
- 17.2.6.3. SWOT Analysis
- 17.2.6.4. Recent Developments
- 17.2.6.5. Financials (Based on Availability)
- 17.2.7 Ingredion Incorporated
- 17.2.7.1. Overview
- 17.2.7.2. Products
- 17.2.7.3. SWOT Analysis
- 17.2.7.4. Recent Developments
- 17.2.7.5. Financials (Based on Availability)
- 17.2.8 GAT Food Essentials GmbH
- 17.2.8.1. Overview
- 17.2.8.2. Products
- 17.2.8.3. SWOT Analysis
- 17.2.8.4. Recent Developments
- 17.2.8.5. Financials (Based on Availability)
- 17.2.1 Cargill Incorporated
List of Figures
- Figure 1: Global Encapsulated Food Market Revenue Breakdown (Million, %) by Region 2024 & 2032
- Figure 2: Global Encapsulated Food Market Volume Breakdown (Tons, %) by Region 2024 & 2032
- Figure 3: North America Encapsulated Food Market Revenue (Million), by Country 2024 & 2032
- Figure 4: North America Encapsulated Food Market Volume (Tons), by Country 2024 & 2032
- Figure 5: North America Encapsulated Food Market Revenue Share (%), by Country 2024 & 2032
- Figure 6: North America Encapsulated Food Market Volume Share (%), by Country 2024 & 2032
- Figure 7: Europe Encapsulated Food Market Revenue (Million), by Country 2024 & 2032
- Figure 8: Europe Encapsulated Food Market Volume (Tons), by Country 2024 & 2032
- Figure 9: Europe Encapsulated Food Market Revenue Share (%), by Country 2024 & 2032
- Figure 10: Europe Encapsulated Food Market Volume Share (%), by Country 2024 & 2032
- Figure 11: Asia Pacific Encapsulated Food Market Revenue (Million), by Country 2024 & 2032
- Figure 12: Asia Pacific Encapsulated Food Market Volume (Tons), by Country 2024 & 2032
- Figure 13: Asia Pacific Encapsulated Food Market Revenue Share (%), by Country 2024 & 2032
- Figure 14: Asia Pacific Encapsulated Food Market Volume Share (%), by Country 2024 & 2032
- Figure 15: South America Encapsulated Food Market Revenue (Million), by Country 2024 & 2032
- Figure 16: South America Encapsulated Food Market Volume (Tons), by Country 2024 & 2032
- Figure 17: South America Encapsulated Food Market Revenue Share (%), by Country 2024 & 2032
- Figure 18: South America Encapsulated Food Market Volume Share (%), by Country 2024 & 2032
- Figure 19: Middle East & Africa Encapsulated Food Market Revenue (Million), by Country 2024 & 2032
- Figure 20: Middle East & Africa Encapsulated Food Market Volume (Tons), by Country 2024 & 2032
- Figure 21: Middle East & Africa Encapsulated Food Market Revenue Share (%), by Country 2024 & 2032
- Figure 22: Middle East & Africa Encapsulated Food Market Volume Share (%), by Country 2024 & 2032
- Figure 23: North America Encapsulated Food Market Revenue (Million), by Technology 2024 & 2032
- Figure 24: North America Encapsulated Food Market Volume (Tons), by Technology 2024 & 2032
- Figure 25: North America Encapsulated Food Market Revenue Share (%), by Technology 2024 & 2032
- Figure 26: North America Encapsulated Food Market Volume Share (%), by Technology 2024 & 2032
- Figure 27: North America Encapsulated Food Market Revenue (Million), by Material Type 2024 & 2032
- Figure 28: North America Encapsulated Food Market Volume (Tons), by Material Type 2024 & 2032
- Figure 29: North America Encapsulated Food Market Revenue Share (%), by Material Type 2024 & 2032
- Figure 30: North America Encapsulated Food Market Volume Share (%), by Material Type 2024 & 2032
- Figure 31: North America Encapsulated Food Market Revenue (Million), by Core Phase 2024 & 2032
- Figure 32: North America Encapsulated Food Market Volume (Tons), by Core Phase 2024 & 2032
- Figure 33: North America Encapsulated Food Market Revenue Share (%), by Core Phase 2024 & 2032
- Figure 34: North America Encapsulated Food Market Volume Share (%), by Core Phase 2024 & 2032
- Figure 35: North America Encapsulated Food Market Revenue (Million), by Country 2024 & 2032
- Figure 36: North America Encapsulated Food Market Volume (Tons), by Country 2024 & 2032
- Figure 37: North America Encapsulated Food Market Revenue Share (%), by Country 2024 & 2032
- Figure 38: North America Encapsulated Food Market Volume Share (%), by Country 2024 & 2032
- Figure 39: Europe Encapsulated Food Market Revenue (Million), by Technology 2024 & 2032
- Figure 40: Europe Encapsulated Food Market Volume (Tons), by Technology 2024 & 2032
- Figure 41: Europe Encapsulated Food Market Revenue Share (%), by Technology 2024 & 2032
- Figure 42: Europe Encapsulated Food Market Volume Share (%), by Technology 2024 & 2032
- Figure 43: Europe Encapsulated Food Market Revenue (Million), by Material Type 2024 & 2032
- Figure 44: Europe Encapsulated Food Market Volume (Tons), by Material Type 2024 & 2032
- Figure 45: Europe Encapsulated Food Market Revenue Share (%), by Material Type 2024 & 2032
- Figure 46: Europe Encapsulated Food Market Volume Share (%), by Material Type 2024 & 2032
- Figure 47: Europe Encapsulated Food Market Revenue (Million), by Core Phase 2024 & 2032
- Figure 48: Europe Encapsulated Food Market Volume (Tons), by Core Phase 2024 & 2032
- Figure 49: Europe Encapsulated Food Market Revenue Share (%), by Core Phase 2024 & 2032
- Figure 50: Europe Encapsulated Food Market Volume Share (%), by Core Phase 2024 & 2032
- Figure 51: Europe Encapsulated Food Market Revenue (Million), by Country 2024 & 2032
- Figure 52: Europe Encapsulated Food Market Volume (Tons), by Country 2024 & 2032
- Figure 53: Europe Encapsulated Food Market Revenue Share (%), by Country 2024 & 2032
- Figure 54: Europe Encapsulated Food Market Volume Share (%), by Country 2024 & 2032
- Figure 55: Asia Pacific Encapsulated Food Market Revenue (Million), by Technology 2024 & 2032
- Figure 56: Asia Pacific Encapsulated Food Market Volume (Tons), by Technology 2024 & 2032
- Figure 57: Asia Pacific Encapsulated Food Market Revenue Share (%), by Technology 2024 & 2032
- Figure 58: Asia Pacific Encapsulated Food Market Volume Share (%), by Technology 2024 & 2032
- Figure 59: Asia Pacific Encapsulated Food Market Revenue (Million), by Material Type 2024 & 2032
- Figure 60: Asia Pacific Encapsulated Food Market Volume (Tons), by Material Type 2024 & 2032
- Figure 61: Asia Pacific Encapsulated Food Market Revenue Share (%), by Material Type 2024 & 2032
- Figure 62: Asia Pacific Encapsulated Food Market Volume Share (%), by Material Type 2024 & 2032
- Figure 63: Asia Pacific Encapsulated Food Market Revenue (Million), by Core Phase 2024 & 2032
- Figure 64: Asia Pacific Encapsulated Food Market Volume (Tons), by Core Phase 2024 & 2032
- Figure 65: Asia Pacific Encapsulated Food Market Revenue Share (%), by Core Phase 2024 & 2032
- Figure 66: Asia Pacific Encapsulated Food Market Volume Share (%), by Core Phase 2024 & 2032
- Figure 67: Asia Pacific Encapsulated Food Market Revenue (Million), by Country 2024 & 2032
- Figure 68: Asia Pacific Encapsulated Food Market Volume (Tons), by Country 2024 & 2032
- Figure 69: Asia Pacific Encapsulated Food Market Revenue Share (%), by Country 2024 & 2032
- Figure 70: Asia Pacific Encapsulated Food Market Volume Share (%), by Country 2024 & 2032
- Figure 71: South America Encapsulated Food Market Revenue (Million), by Technology 2024 & 2032
- Figure 72: South America Encapsulated Food Market Volume (Tons), by Technology 2024 & 2032
- Figure 73: South America Encapsulated Food Market Revenue Share (%), by Technology 2024 & 2032
- Figure 74: South America Encapsulated Food Market Volume Share (%), by Technology 2024 & 2032
- Figure 75: South America Encapsulated Food Market Revenue (Million), by Material Type 2024 & 2032
- Figure 76: South America Encapsulated Food Market Volume (Tons), by Material Type 2024 & 2032
- Figure 77: South America Encapsulated Food Market Revenue Share (%), by Material Type 2024 & 2032
- Figure 78: South America Encapsulated Food Market Volume Share (%), by Material Type 2024 & 2032
- Figure 79: South America Encapsulated Food Market Revenue (Million), by Core Phase 2024 & 2032
- Figure 80: South America Encapsulated Food Market Volume (Tons), by Core Phase 2024 & 2032
- Figure 81: South America Encapsulated Food Market Revenue Share (%), by Core Phase 2024 & 2032
- Figure 82: South America Encapsulated Food Market Volume Share (%), by Core Phase 2024 & 2032
- Figure 83: South America Encapsulated Food Market Revenue (Million), by Country 2024 & 2032
- Figure 84: South America Encapsulated Food Market Volume (Tons), by Country 2024 & 2032
- Figure 85: South America Encapsulated Food Market Revenue Share (%), by Country 2024 & 2032
- Figure 86: South America Encapsulated Food Market Volume Share (%), by Country 2024 & 2032
- Figure 87: Middle East Encapsulated Food Market Revenue (Million), by Technology 2024 & 2032
- Figure 88: Middle East Encapsulated Food Market Volume (Tons), by Technology 2024 & 2032
- Figure 89: Middle East Encapsulated Food Market Revenue Share (%), by Technology 2024 & 2032
- Figure 90: Middle East Encapsulated Food Market Volume Share (%), by Technology 2024 & 2032
- Figure 91: Middle East Encapsulated Food Market Revenue (Million), by Material Type 2024 & 2032
- Figure 92: Middle East Encapsulated Food Market Volume (Tons), by Material Type 2024 & 2032
- Figure 93: Middle East Encapsulated Food Market Revenue Share (%), by Material Type 2024 & 2032
- Figure 94: Middle East Encapsulated Food Market Volume Share (%), by Material Type 2024 & 2032
- Figure 95: Middle East Encapsulated Food Market Revenue (Million), by Core Phase 2024 & 2032
- Figure 96: Middle East Encapsulated Food Market Volume (Tons), by Core Phase 2024 & 2032
- Figure 97: Middle East Encapsulated Food Market Revenue Share (%), by Core Phase 2024 & 2032
- Figure 98: Middle East Encapsulated Food Market Volume Share (%), by Core Phase 2024 & 2032
- Figure 99: Middle East Encapsulated Food Market Revenue (Million), by Country 2024 & 2032
- Figure 100: Middle East Encapsulated Food Market Volume (Tons), by Country 2024 & 2032
- Figure 101: Middle East Encapsulated Food Market Revenue Share (%), by Country 2024 & 2032
- Figure 102: Middle East Encapsulated Food Market Volume Share (%), by Country 2024 & 2032
- Figure 103: South Africa Encapsulated Food Market Revenue (Million), by Technology 2024 & 2032
- Figure 104: South Africa Encapsulated Food Market Volume (Tons), by Technology 2024 & 2032
- Figure 105: South Africa Encapsulated Food Market Revenue Share (%), by Technology 2024 & 2032
- Figure 106: South Africa Encapsulated Food Market Volume Share (%), by Technology 2024 & 2032
- Figure 107: South Africa Encapsulated Food Market Revenue (Million), by Material Type 2024 & 2032
- Figure 108: South Africa Encapsulated Food Market Volume (Tons), by Material Type 2024 & 2032
- Figure 109: South Africa Encapsulated Food Market Revenue Share (%), by Material Type 2024 & 2032
- Figure 110: South Africa Encapsulated Food Market Volume Share (%), by Material Type 2024 & 2032
- Figure 111: South Africa Encapsulated Food Market Revenue (Million), by Core Phase 2024 & 2032
- Figure 112: South Africa Encapsulated Food Market Volume (Tons), by Core Phase 2024 & 2032
- Figure 113: South Africa Encapsulated Food Market Revenue Share (%), by Core Phase 2024 & 2032
- Figure 114: South Africa Encapsulated Food Market Volume Share (%), by Core Phase 2024 & 2032
- Figure 115: South Africa Encapsulated Food Market Revenue (Million), by Country 2024 & 2032
- Figure 116: South Africa Encapsulated Food Market Volume (Tons), by Country 2024 & 2032
- Figure 117: South Africa Encapsulated Food Market Revenue Share (%), by Country 2024 & 2032
- Figure 118: South Africa Encapsulated Food Market Volume Share (%), by Country 2024 & 2032
List of Tables
- Table 1: Global Encapsulated Food Market Revenue Million Forecast, by Region 2019 & 2032
- Table 2: Global Encapsulated Food Market Volume Tons Forecast, by Region 2019 & 2032
- Table 3: Global Encapsulated Food Market Revenue Million Forecast, by Technology 2019 & 2032
- Table 4: Global Encapsulated Food Market Volume Tons Forecast, by Technology 2019 & 2032
- Table 5: Global Encapsulated Food Market Revenue Million Forecast, by Material Type 2019 & 2032
- Table 6: Global Encapsulated Food Market Volume Tons Forecast, by Material Type 2019 & 2032
- Table 7: Global Encapsulated Food Market Revenue Million Forecast, by Core Phase 2019 & 2032
- Table 8: Global Encapsulated Food Market Volume Tons Forecast, by Core Phase 2019 & 2032
- Table 9: Global Encapsulated Food Market Revenue Million Forecast, by Region 2019 & 2032
- Table 10: Global Encapsulated Food Market Volume Tons Forecast, by Region 2019 & 2032
- Table 11: Global Encapsulated Food Market Revenue Million Forecast, by Country 2019 & 2032
- Table 12: Global Encapsulated Food Market Volume Tons Forecast, by Country 2019 & 2032
- Table 13: United States Encapsulated Food Market Revenue (Million) Forecast, by Application 2019 & 2032
- Table 14: United States Encapsulated Food Market Volume (Tons) Forecast, by Application 2019 & 2032
- Table 15: Canada Encapsulated Food Market Revenue (Million) Forecast, by Application 2019 & 2032
- Table 16: Canada Encapsulated Food Market Volume (Tons) Forecast, by Application 2019 & 2032
- Table 17: Mexico Encapsulated Food Market Revenue (Million) Forecast, by Application 2019 & 2032
- Table 18: Mexico Encapsulated Food Market Volume (Tons) Forecast, by Application 2019 & 2032
- Table 19: Rest of North America Encapsulated Food Market Revenue (Million) Forecast, by Application 2019 & 2032
- Table 20: Rest of North America Encapsulated Food Market Volume (Tons) Forecast, by Application 2019 & 2032
- Table 21: Global Encapsulated Food Market Revenue Million Forecast, by Country 2019 & 2032
- Table 22: Global Encapsulated Food Market Volume Tons Forecast, by Country 2019 & 2032
- Table 23: United Kingdom Encapsulated Food Market Revenue (Million) Forecast, by Application 2019 & 2032
- Table 24: United Kingdom Encapsulated Food Market Volume (Tons) Forecast, by Application 2019 & 2032
- Table 25: Germany Encapsulated Food Market Revenue (Million) Forecast, by Application 2019 & 2032
- Table 26: Germany Encapsulated Food Market Volume (Tons) Forecast, by Application 2019 & 2032
- Table 27: France Encapsulated Food Market Revenue (Million) Forecast, by Application 2019 & 2032
- Table 28: France Encapsulated Food Market Volume (Tons) Forecast, by Application 2019 & 2032
- Table 29: Russia Encapsulated Food Market Revenue (Million) Forecast, by Application 2019 & 2032
- Table 30: Russia Encapsulated Food Market Volume (Tons) Forecast, by Application 2019 & 2032
- Table 31: Italy Encapsulated Food Market Revenue (Million) Forecast, by Application 2019 & 2032
- Table 32: Italy Encapsulated Food Market Volume (Tons) Forecast, by Application 2019 & 2032
- Table 33: Spain Encapsulated Food Market Revenue (Million) Forecast, by Application 2019 & 2032
- Table 34: Spain Encapsulated Food Market Volume (Tons) Forecast, by Application 2019 & 2032
- Table 35: Rest of Europe Encapsulated Food Market Revenue (Million) Forecast, by Application 2019 & 2032
- Table 36: Rest of Europe Encapsulated Food Market Volume (Tons) Forecast, by Application 2019 & 2032
- Table 37: Global Encapsulated Food Market Revenue Million Forecast, by Country 2019 & 2032
- Table 38: Global Encapsulated Food Market Volume Tons Forecast, by Country 2019 & 2032
- Table 39: India Encapsulated Food Market Revenue (Million) Forecast, by Application 2019 & 2032
- Table 40: India Encapsulated Food Market Volume (Tons) Forecast, by Application 2019 & 2032
- Table 41: China Encapsulated Food Market Revenue (Million) Forecast, by Application 2019 & 2032
- Table 42: China Encapsulated Food Market Volume (Tons) Forecast, by Application 2019 & 2032
- Table 43: Japan Encapsulated Food Market Revenue (Million) Forecast, by Application 2019 & 2032
- Table 44: Japan Encapsulated Food Market Volume (Tons) Forecast, by Application 2019 & 2032
- Table 45: Australia Encapsulated Food Market Revenue (Million) Forecast, by Application 2019 & 2032
- Table 46: Australia Encapsulated Food Market Volume (Tons) Forecast, by Application 2019 & 2032
- Table 47: Rest of Asia Pacific Encapsulated Food Market Revenue (Million) Forecast, by Application 2019 & 2032
- Table 48: Rest of Asia Pacific Encapsulated Food Market Volume (Tons) Forecast, by Application 2019 & 2032
- Table 49: Global Encapsulated Food Market Revenue Million Forecast, by Country 2019 & 2032
- Table 50: Global Encapsulated Food Market Volume Tons Forecast, by Country 2019 & 2032
- Table 51: Brazil Encapsulated Food Market Revenue (Million) Forecast, by Application 2019 & 2032
- Table 52: Brazil Encapsulated Food Market Volume (Tons) Forecast, by Application 2019 & 2032
- Table 53: Argentina Encapsulated Food Market Revenue (Million) Forecast, by Application 2019 & 2032
- Table 54: Argentina Encapsulated Food Market Volume (Tons) Forecast, by Application 2019 & 2032
- Table 55: Rest of South America Encapsulated Food Market Revenue (Million) Forecast, by Application 2019 & 2032
- Table 56: Rest of South America Encapsulated Food Market Volume (Tons) Forecast, by Application 2019 & 2032
- Table 57: Global Encapsulated Food Market Revenue Million Forecast, by Country 2019 & 2032
- Table 58: Global Encapsulated Food Market Volume Tons Forecast, by Country 2019 & 2032
- Table 59: UAE Encapsulated Food Market Revenue (Million) Forecast, by Application 2019 & 2032
- Table 60: UAE Encapsulated Food Market Volume (Tons) Forecast, by Application 2019 & 2032
- Table 61: South Africa Encapsulated Food Market Revenue (Million) Forecast, by Application 2019 & 2032
- Table 62: South Africa Encapsulated Food Market Volume (Tons) Forecast, by Application 2019 & 2032
- Table 63: Saudi Arabia Encapsulated Food Market Revenue (Million) Forecast, by Application 2019 & 2032
- Table 64: Saudi Arabia Encapsulated Food Market Volume (Tons) Forecast, by Application 2019 & 2032
- Table 65: Rest of MEA Encapsulated Food Market Revenue (Million) Forecast, by Application 2019 & 2032
- Table 66: Rest of MEA Encapsulated Food Market Volume (Tons) Forecast, by Application 2019 & 2032
- Table 67: Global Encapsulated Food Market Revenue Million Forecast, by Technology 2019 & 2032
- Table 68: Global Encapsulated Food Market Volume Tons Forecast, by Technology 2019 & 2032
- Table 69: Global Encapsulated Food Market Revenue Million Forecast, by Material Type 2019 & 2032
- Table 70: Global Encapsulated Food Market Volume Tons Forecast, by Material Type 2019 & 2032
- Table 71: Global Encapsulated Food Market Revenue Million Forecast, by Core Phase 2019 & 2032
- Table 72: Global Encapsulated Food Market Volume Tons Forecast, by Core Phase 2019 & 2032
- Table 73: Global Encapsulated Food Market Revenue Million Forecast, by Country 2019 & 2032
- Table 74: Global Encapsulated Food Market Volume Tons Forecast, by Country 2019 & 2032
- Table 75: United States Encapsulated Food Market Revenue (Million) Forecast, by Application 2019 & 2032
- Table 76: United States Encapsulated Food Market Volume (Tons) Forecast, by Application 2019 & 2032
- Table 77: Canada Encapsulated Food Market Revenue (Million) Forecast, by Application 2019 & 2032
- Table 78: Canada Encapsulated Food Market Volume (Tons) Forecast, by Application 2019 & 2032
- Table 79: Mexico Encapsulated Food Market Revenue (Million) Forecast, by Application 2019 & 2032
- Table 80: Mexico Encapsulated Food Market Volume (Tons) Forecast, by Application 2019 & 2032
- Table 81: Rest of North America Encapsulated Food Market Revenue (Million) Forecast, by Application 2019 & 2032
- Table 82: Rest of North America Encapsulated Food Market Volume (Tons) Forecast, by Application 2019 & 2032
- Table 83: Global Encapsulated Food Market Revenue Million Forecast, by Technology 2019 & 2032
- Table 84: Global Encapsulated Food Market Volume Tons Forecast, by Technology 2019 & 2032
- Table 85: Global Encapsulated Food Market Revenue Million Forecast, by Material Type 2019 & 2032
- Table 86: Global Encapsulated Food Market Volume Tons Forecast, by Material Type 2019 & 2032
- Table 87: Global Encapsulated Food Market Revenue Million Forecast, by Core Phase 2019 & 2032
- Table 88: Global Encapsulated Food Market Volume Tons Forecast, by Core Phase 2019 & 2032
- Table 89: Global Encapsulated Food Market Revenue Million Forecast, by Country 2019 & 2032
- Table 90: Global Encapsulated Food Market Volume Tons Forecast, by Country 2019 & 2032
- Table 91: United Kingdom Encapsulated Food Market Revenue (Million) Forecast, by Application 2019 & 2032
- Table 92: United Kingdom Encapsulated Food Market Volume (Tons) Forecast, by Application 2019 & 2032
- Table 93: Germany Encapsulated Food Market Revenue (Million) Forecast, by Application 2019 & 2032
- Table 94: Germany Encapsulated Food Market Volume (Tons) Forecast, by Application 2019 & 2032
- Table 95: France Encapsulated Food Market Revenue (Million) Forecast, by Application 2019 & 2032
- Table 96: France Encapsulated Food Market Volume (Tons) Forecast, by Application 2019 & 2032
- Table 97: Russia Encapsulated Food Market Revenue (Million) Forecast, by Application 2019 & 2032
- Table 98: Russia Encapsulated Food Market Volume (Tons) Forecast, by Application 2019 & 2032
- Table 99: Italy Encapsulated Food Market Revenue (Million) Forecast, by Application 2019 & 2032
- Table 100: Italy Encapsulated Food Market Volume (Tons) Forecast, by Application 2019 & 2032
- Table 101: Spain Encapsulated Food Market Revenue (Million) Forecast, by Application 2019 & 2032
- Table 102: Spain Encapsulated Food Market Volume (Tons) Forecast, by Application 2019 & 2032
- Table 103: Rest of Europe Encapsulated Food Market Revenue (Million) Forecast, by Application 2019 & 2032
- Table 104: Rest of Europe Encapsulated Food Market Volume (Tons) Forecast, by Application 2019 & 2032
- Table 105: Global Encapsulated Food Market Revenue Million Forecast, by Technology 2019 & 2032
- Table 106: Global Encapsulated Food Market Volume Tons Forecast, by Technology 2019 & 2032
- Table 107: Global Encapsulated Food Market Revenue Million Forecast, by Material Type 2019 & 2032
- Table 108: Global Encapsulated Food Market Volume Tons Forecast, by Material Type 2019 & 2032
- Table 109: Global Encapsulated Food Market Revenue Million Forecast, by Core Phase 2019 & 2032
- Table 110: Global Encapsulated Food Market Volume Tons Forecast, by Core Phase 2019 & 2032
- Table 111: Global Encapsulated Food Market Revenue Million Forecast, by Country 2019 & 2032
- Table 112: Global Encapsulated Food Market Volume Tons Forecast, by Country 2019 & 2032
- Table 113: India Encapsulated Food Market Revenue (Million) Forecast, by Application 2019 & 2032
- Table 114: India Encapsulated Food Market Volume (Tons) Forecast, by Application 2019 & 2032
- Table 115: China Encapsulated Food Market Revenue (Million) Forecast, by Application 2019 & 2032
- Table 116: China Encapsulated Food Market Volume (Tons) Forecast, by Application 2019 & 2032
- Table 117: Japan Encapsulated Food Market Revenue (Million) Forecast, by Application 2019 & 2032
- Table 118: Japan Encapsulated Food Market Volume (Tons) Forecast, by Application 2019 & 2032
- Table 119: Australia Encapsulated Food Market Revenue (Million) Forecast, by Application 2019 & 2032
- Table 120: Australia Encapsulated Food Market Volume (Tons) Forecast, by Application 2019 & 2032
- Table 121: Rest of Asia Pacific Encapsulated Food Market Revenue (Million) Forecast, by Application 2019 & 2032
- Table 122: Rest of Asia Pacific Encapsulated Food Market Volume (Tons) Forecast, by Application 2019 & 2032
- Table 123: Global Encapsulated Food Market Revenue Million Forecast, by Technology 2019 & 2032
- Table 124: Global Encapsulated Food Market Volume Tons Forecast, by Technology 2019 & 2032
- Table 125: Global Encapsulated Food Market Revenue Million Forecast, by Material Type 2019 & 2032
- Table 126: Global Encapsulated Food Market Volume Tons Forecast, by Material Type 2019 & 2032
- Table 127: Global Encapsulated Food Market Revenue Million Forecast, by Core Phase 2019 & 2032
- Table 128: Global Encapsulated Food Market Volume Tons Forecast, by Core Phase 2019 & 2032
- Table 129: Global Encapsulated Food Market Revenue Million Forecast, by Country 2019 & 2032
- Table 130: Global Encapsulated Food Market Volume Tons Forecast, by Country 2019 & 2032
- Table 131: Brazil Encapsulated Food Market Revenue (Million) Forecast, by Application 2019 & 2032
- Table 132: Brazil Encapsulated Food Market Volume (Tons) Forecast, by Application 2019 & 2032
- Table 133: Argentina Encapsulated Food Market Revenue (Million) Forecast, by Application 2019 & 2032
- Table 134: Argentina Encapsulated Food Market Volume (Tons) Forecast, by Application 2019 & 2032
- Table 135: Rest of South America Encapsulated Food Market Revenue (Million) Forecast, by Application 2019 & 2032
- Table 136: Rest of South America Encapsulated Food Market Volume (Tons) Forecast, by Application 2019 & 2032
- Table 137: Global Encapsulated Food Market Revenue Million Forecast, by Technology 2019 & 2032
- Table 138: Global Encapsulated Food Market Volume Tons Forecast, by Technology 2019 & 2032
- Table 139: Global Encapsulated Food Market Revenue Million Forecast, by Material Type 2019 & 2032
- Table 140: Global Encapsulated Food Market Volume Tons Forecast, by Material Type 2019 & 2032
- Table 141: Global Encapsulated Food Market Revenue Million Forecast, by Core Phase 2019 & 2032
- Table 142: Global Encapsulated Food Market Volume Tons Forecast, by Core Phase 2019 & 2032
- Table 143: Global Encapsulated Food Market Revenue Million Forecast, by Country 2019 & 2032
- Table 144: Global Encapsulated Food Market Volume Tons Forecast, by Country 2019 & 2032
- Table 145: Global Encapsulated Food Market Revenue Million Forecast, by Technology 2019 & 2032
- Table 146: Global Encapsulated Food Market Volume Tons Forecast, by Technology 2019 & 2032
- Table 147: Global Encapsulated Food Market Revenue Million Forecast, by Material Type 2019 & 2032
- Table 148: Global Encapsulated Food Market Volume Tons Forecast, by Material Type 2019 & 2032
- Table 149: Global Encapsulated Food Market Revenue Million Forecast, by Core Phase 2019 & 2032
- Table 150: Global Encapsulated Food Market Volume Tons Forecast, by Core Phase 2019 & 2032
- Table 151: Global Encapsulated Food Market Revenue Million Forecast, by Country 2019 & 2032
- Table 152: Global Encapsulated Food Market Volume Tons Forecast, by Country 2019 & 2032
- Table 153: Saudi Arabia Encapsulated Food Market Revenue (Million) Forecast, by Application 2019 & 2032
- Table 154: Saudi Arabia Encapsulated Food Market Volume (Tons) Forecast, by Application 2019 & 2032
- Table 155: Rest of Middle East Encapsulated Food Market Revenue (Million) Forecast, by Application 2019 & 2032
- Table 156: Rest of Middle East Encapsulated Food Market Volume (Tons) Forecast, by Application 2019 & 2032
Frequently Asked Questions
1. What is the projected Compound Annual Growth Rate (CAGR) of the Encapsulated Food Market?
The projected CAGR is approximately 6.12%.
2. Which companies are prominent players in the Encapsulated Food Market?
Key companies in the market include Cargill Incorporated, Encapsys LLC, Frieslandcampina Kievit*List Not Exhaustive, BASF SE, DuPont, ADVANCED BIONUTRITION CORP, Ingredion Incorporated, GAT Food Essentials GmbH.
3. What are the main segments of the Encapsulated Food Market?
The market segments include Technology, Material Type, Core Phase.
4. Can you provide details about the market size?
The market size is estimated to be USD 5,952.8 Million as of 2022.
5. What are some drivers contributing to market growth?
Awareness of Health Benefits Associated with Tocotrienol; Escalating Demand for Anti-Aging Products Containing Tocotrienol.
6. What are the notable trends driving market growth?
Growing Demand of Dietary Supplement.
7. Are there any restraints impacting market growth?
Availability of Substitutes.
8. Can you provide examples of recent developments in the market?
N/A
9. What pricing options are available for accessing the report?
Pricing options include single-user, multi-user, and enterprise licenses priced at USD 4750, USD 5250, and USD 8750 respectively.
10. Is the market size provided in terms of value or volume?
The market size is provided in terms of value, measured in Million and volume, measured in Tons.
11. Are there any specific market keywords associated with the report?
Yes, the market keyword associated with the report is "Encapsulated Food Market," which aids in identifying and referencing the specific market segment covered.
12. How do I determine which pricing option suits my needs best?
The pricing options vary based on user requirements and access needs. Individual users may opt for single-user licenses, while businesses requiring broader access may choose multi-user or enterprise licenses for cost-effective access to the report.
13. Are there any additional resources or data provided in the Encapsulated Food Market report?
While the report offers comprehensive insights, it's advisable to review the specific contents or supplementary materials provided to ascertain if additional resources or data are available.
14. How can I stay updated on further developments or reports in the Encapsulated Food Market?
To stay informed about further developments, trends, and reports in the Encapsulated Food Market, consider subscribing to industry newsletters, following relevant companies and organizations, or regularly checking reputable industry news sources and publications.
Methodology
Step 1 - Identification of Relevant Samples Size from Population Database


Step 2 - Approaches for Defining Global Market Size (Value, Volume* & Price*)

Note*: In applicable scenarios
Step 3 - Data Sources
Primary Research
- Web Analytics
- Survey Reports
- Research Institute
- Latest Research Reports
- Opinion Leaders
Secondary Research
- Annual Reports
- White Paper
- Latest Press Release
- Industry Association
- Paid Database
- Investor Presentations

Step 4 - Data Triangulation
Involves using different sources of information in order to increase the validity of a study
These sources are likely to be stakeholders in a program - participants, other researchers, program staff, other community members, and so on.
Then we put all data in single framework & apply various statistical tools to find out the dynamic on the market.
During the analysis stage, feedback from the stakeholder groups would be compared to determine areas of agreement as well as areas of divergence
