

Key Insights
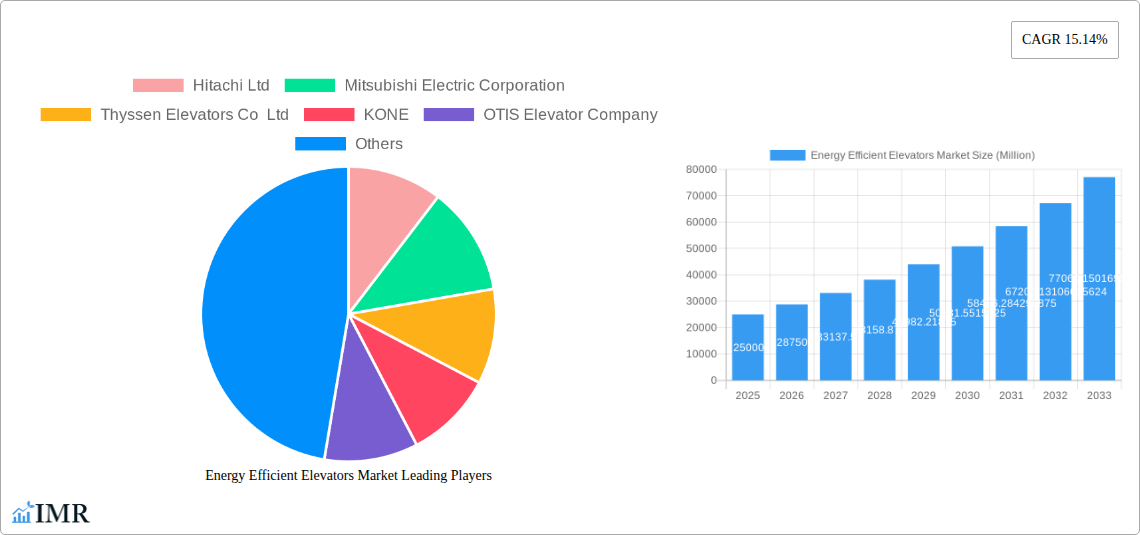
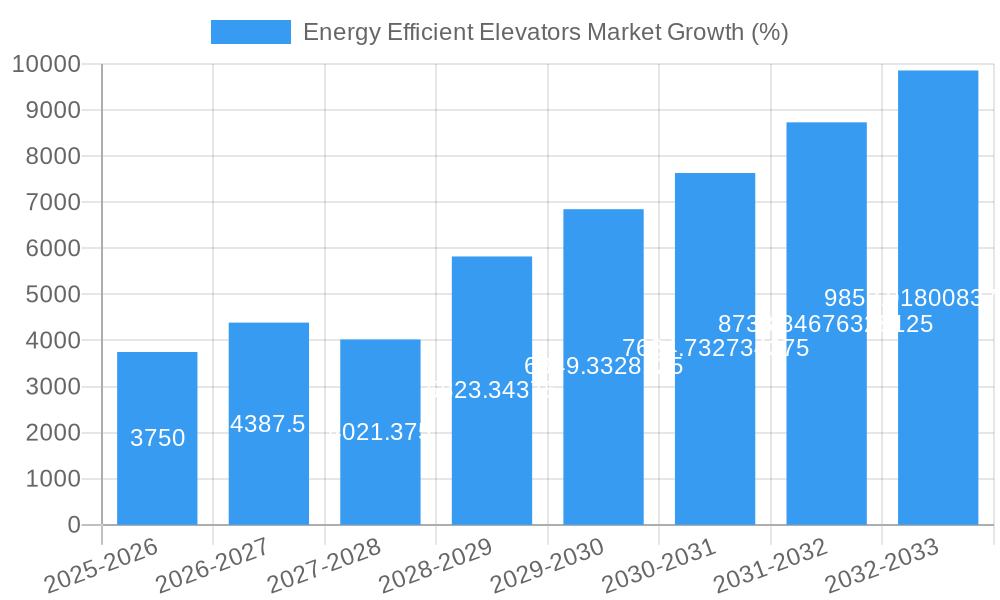
The global energy-efficient elevators market is experiencing robust growth, driven by increasing urbanization, stringent energy regulations, and a rising focus on sustainability. The market's Compound Annual Growth Rate (CAGR) of 15.14% from 2019 to 2024 indicates a significant expansion, projected to continue into the forecast period (2025-2033). Key market drivers include the escalating demand for energy-saving technologies in commercial and residential buildings, coupled with advancements in elevator control systems, including regenerative drives and energy-efficient motors. Government initiatives promoting green building practices and incentives for energy-efficient equipment further fuel market expansion. Segmentation reveals strong growth across various control systems (elevator control, access control, building management systems) and automation systems (motors & drivers, sensors & controllers). Geographically, North America and Europe currently hold significant market shares, but the Asia-Pacific region is poised for rapid growth due to extensive infrastructure development and rising construction activity in countries like China and India. Major players like Hitachi, Mitsubishi Electric, Thyssenkrupp, KONE, and Otis are actively investing in research and development to enhance energy efficiency and introduce innovative solutions, further shaping market dynamics.
The market's growth trajectory is expected to be influenced by factors such as fluctuating raw material prices and global economic conditions. However, the long-term outlook remains positive, driven by the ongoing need for sustainable building solutions and the increasing adoption of smart building technologies. The integration of energy-efficient elevators into smart building management systems provides opportunities for enhanced operational efficiency and cost savings. The market will likely see further consolidation among key players through mergers and acquisitions, as companies strive to expand their product portfolios and geographical reach. Residential segment is expected to show significant growth due to increasing disposable income and preference for energy efficient appliances. This market segment is also witnessing innovation with introduction of technologies like machine learning and AI based elevator controls that further optimize energy consumption.
Energy Efficient Elevators Market: A Comprehensive Report (2019-2033)
This comprehensive report provides an in-depth analysis of the Energy Efficient Elevators market, encompassing market dynamics, growth trends, regional dominance, product landscape, and key players. The report covers the period from 2019 to 2033, with a focus on the forecast period 2025-2033 and a base year of 2025. The study segments the market by Control Systems (Elevator Control System, Access Control System), Automation Systems (Motors and Drivers, Sensors and Controllers, Building Management Systems), and End-User (Industrial, Commercial, Residential, Other). The market size is presented in million units.
Energy Efficient Elevators Market Dynamics & Structure
This section analyzes the market's competitive landscape, technological advancements, regulatory influences, and market trends. We delve into market concentration, exploring the market share of key players like Hitachi Ltd, Mitsubishi Electric Corporation, Thyssen Elevators Co Ltd, KONE, OTIS Elevator Company, Fujitec Co Ltd, Honeywell International, Hyundai elevators Co Ltd, and Schindler group. The report quantifies the level of market consolidation and identifies any emerging players. Furthermore, we examine the impact of technological innovation, including the development of regenerative drives and machine-room-less elevators, on market growth. Regulatory frameworks related to energy efficiency standards and building codes are assessed, along with the influence of government incentives and policies. The analysis considers the presence and impact of competitive substitutes, such as stairlifts and escalators, and explores M&A activity within the sector, including deal volumes and their effect on market structure. The report offers a detailed understanding of end-user demographics and their evolving preferences influencing the market. Innovation barriers, such as high R&D costs and standardization challenges, are discussed qualitatively.
- Market Concentration: xx% controlled by top 5 players in 2024.
- M&A Activity (2019-2024): xx deals, with an average deal value of $xx million.
- Regulatory Landscape: Analysis of key energy efficiency standards and their impact.
- Technological Innovation: Focus on regenerative drives, machine-room-less technology, and AI-powered systems.
Energy Efficient Elevators Market Growth Trends & Insights
This section provides a detailed analysis of the Energy Efficient Elevators market's growth trajectory using comprehensive data and industry expertise. It traces the market size evolution from 2019 to 2024, offering insights into past performance and setting the stage for future projections. We analyze adoption rates across different end-user segments, highlighting variations in penetration levels and growth potential. The impact of technological disruptions, such as the introduction of IoT-enabled elevators and advanced control systems, is thoroughly examined. The report offers insights into consumer behavior shifts, considering the increasing demand for energy-efficient solutions and the growing focus on sustainability. The analysis is supported by quantitative metrics, including Compound Annual Growth Rate (CAGR) and market penetration rates, providing a robust forecast for market size and growth during the period 2025-2033.
Dominant Regions, Countries, or Segments in Energy Efficient Elevators Market
This section identifies the leading regions, countries, and market segments driving the growth of the Energy Efficient Elevators market. A comprehensive analysis examines market share and growth potential across different geographical regions and end-user segments (Industrial, Commercial, Residential, and Other). We pinpoint the key drivers of market dominance, including economic policies, infrastructure development, and technological advancements. The leading segments (e.g., Control Systems, Automation Systems) are analyzed based on their market share, growth rate, and future outlook.
- Leading Region: [Region Name] – driving factors include [specific factors].
- Leading Country: [Country Name] – due to [specific reasons].
- Leading Segment: [Segment Name] – supported by [specific reasons].
- Key Growth Drivers (per region/segment): Detailed analysis of economic policies, infrastructure projects, and building regulations.
Energy Efficient Elevators Market Product Landscape
This section examines the innovations and advancements in energy-efficient elevator technologies. It explores the diverse applications of these elevators across various sectors and assesses their performance metrics. We highlight the unique selling propositions (USPs) offered by different manufacturers, focusing on features like energy recovery systems, intelligent control algorithms, and reduced maintenance requirements. The analysis includes details on the latest technological breakthroughs, emphasizing their role in enhancing efficiency and user experience.
Key Drivers, Barriers & Challenges in Energy Efficient Elevators Market
This section identifies the key factors driving market growth, including technological advancements, favorable economic conditions, and supportive government policies. We provide concrete examples of these drivers, quantifying their impact where possible. Conversely, we also analyze significant challenges and restraints hindering market expansion, including supply chain disruptions, regulatory hurdles, and intense competition. We quantify the impact of these challenges on market growth.
- Key Drivers: Increased energy costs, stringent regulations, and growing awareness of sustainability.
- Key Barriers: High initial investment costs, complexity of installation, and potential supply chain issues.
Emerging Opportunities in Energy Efficient Elevators Market
This section explores promising areas for growth, including untapped market segments, innovative applications of energy-efficient elevator technologies, and shifts in consumer preferences. We identify opportunities in developing economies with rapid urbanization and highlight the potential for integration with smart building technologies.
- Untapped Markets: Focus on developing countries with rapid urbanization and modernization of infrastructure.
- Innovative Applications: Exploration of integration with renewable energy sources and smart building systems.
Growth Accelerators in the Energy Efficient Elevators Market Industry
This section focuses on long-term growth drivers, emphasizing technological breakthroughs, strategic partnerships, and market expansion strategies adopted by key players. We analyze the impact of these factors on sustainable market growth.
Key Players Shaping the Energy Efficient Elevators Market Market
- Hitachi Ltd
- Mitsubishi Electric Corporation
- Thyssen Elevators Co Ltd
- KONE
- OTIS Elevator Company
- Fujitec Co Ltd
- Honeywell international
- Hyundai elevators Co Ltd
- Schindler group
Notable Milestones in Energy Efficient Elevators Market Sector
- [Year/Month]: [Milestone description and impact on market dynamics].
- [Year/Month]: [Milestone description and impact on market dynamics].
- [Year/Month]: [Milestone description and impact on market dynamics].
In-Depth Energy Efficient Elevators Market Market Outlook
This section provides a summary of the key growth accelerators identified throughout the report, emphasizing the future potential of the Energy Efficient Elevators market. It highlights the strategic opportunities for both established players and new entrants. The concluding remarks emphasize the long-term prospects for sustained growth within this dynamic market segment.
Energy Efficient Elevators Market Segmentation
-
1. Control Systems
- 1.1. Elevator Control System
-
1.2. Access Control System
- 1.2.1. Card-based Access Control Systems
- 1.2.2. Biometric Access Control Solutions
- 1.2.3. Keypad-based Access Control Systems
-
2. Automation Systems
- 2.1. Motors and Drivers
- 2.2. Sensors and Controllers
- 2.3. Building Management Systems
-
3. End User
- 3.1. Industrial
- 3.2. Commercial
- 3.3. Residential
- 3.4. Other End Users
Energy Efficient Elevators Market Segmentation By Geography
-
1. North America
- 1.1. United States
- 1.2. Canada
-
2. Europe
- 2.1. Germany
- 2.2. United Kingdom
- 2.3. France
- 2.4. Russia
- 2.5. Rest of Europe
-
3. Asia Pacific
- 3.1. China
- 3.2. Japan
- 3.3. India
- 3.4. Rest of Asia Pacific
-
4. Latin America
- 4.1. Brazil
- 4.2. Mexico
- 4.3. Argentina
- 4.4. Rest of Latin America
-
5. Middle East and Africa
- 5.1. Saudi Arabia
- 5.2. United Arab Emirates
- 5.3. South Africa
- 5.4. Rest of Middle East and Africa

Energy Efficient Elevators Market REPORT HIGHLIGHTS
| Aspects | Details |
|---|---|
| Study Period | 2019-2033 |
| Base Year | 2024 |
| Estimated Year | 2025 |
| Forecast Period | 2025-2033 |
| Historical Period | 2019-2024 |
| Growth Rate | CAGR of 15.14% from 2019-2033 |
| Segmentation |
|
Table of Contents
- 1. Introduction
- 1.1. Research Scope
- 1.2. Market Segmentation
- 1.3. Research Methodology
- 1.4. Definitions and Assumptions
- 2. Executive Summary
- 2.1. Introduction
- 3. Market Dynamics
- 3.1. Introduction
- 3.2. Market Drivers
- 3.2.1. ; Increasing Demand for Energy Efficient Systems; Due to Mounting Electricity Prices in High-traffic Applications
- 3.3. Market Restrains
- 3.3.1. ; Lack of Information and Awareness in Electricity Consumption Rate and Lack of Technological Efficiency
- 3.4. Market Trends
- 3.4.1. Industrial Sector to Significantly Contribute to the Market Demand
- 4. Market Factor Analysis
- 4.1. Porters Five Forces
- 4.2. Supply/Value Chain
- 4.3. PESTEL analysis
- 4.4. Market Entropy
- 4.5. Patent/Trademark Analysis
- 5. Global Energy Efficient Elevators Market Analysis, Insights and Forecast, 2019-2031
- 5.1. Market Analysis, Insights and Forecast - by Control Systems
- 5.1.1. Elevator Control System
- 5.1.2. Access Control System
- 5.1.2.1. Card-based Access Control Systems
- 5.1.2.2. Biometric Access Control Solutions
- 5.1.2.3. Keypad-based Access Control Systems
- 5.2. Market Analysis, Insights and Forecast - by Automation Systems
- 5.2.1. Motors and Drivers
- 5.2.2. Sensors and Controllers
- 5.2.3. Building Management Systems
- 5.3. Market Analysis, Insights and Forecast - by End User
- 5.3.1. Industrial
- 5.3.2. Commercial
- 5.3.3. Residential
- 5.3.4. Other End Users
- 5.4. Market Analysis, Insights and Forecast - by Region
- 5.4.1. North America
- 5.4.2. Europe
- 5.4.3. Asia Pacific
- 5.4.4. Latin America
- 5.4.5. Middle East and Africa
- 5.1. Market Analysis, Insights and Forecast - by Control Systems
- 6. North America Energy Efficient Elevators Market Analysis, Insights and Forecast, 2019-2031
- 6.1. Market Analysis, Insights and Forecast - by Control Systems
- 6.1.1. Elevator Control System
- 6.1.2. Access Control System
- 6.1.2.1. Card-based Access Control Systems
- 6.1.2.2. Biometric Access Control Solutions
- 6.1.2.3. Keypad-based Access Control Systems
- 6.2. Market Analysis, Insights and Forecast - by Automation Systems
- 6.2.1. Motors and Drivers
- 6.2.2. Sensors and Controllers
- 6.2.3. Building Management Systems
- 6.3. Market Analysis, Insights and Forecast - by End User
- 6.3.1. Industrial
- 6.3.2. Commercial
- 6.3.3. Residential
- 6.3.4. Other End Users
- 6.1. Market Analysis, Insights and Forecast - by Control Systems
- 7. Europe Energy Efficient Elevators Market Analysis, Insights and Forecast, 2019-2031
- 7.1. Market Analysis, Insights and Forecast - by Control Systems
- 7.1.1. Elevator Control System
- 7.1.2. Access Control System
- 7.1.2.1. Card-based Access Control Systems
- 7.1.2.2. Biometric Access Control Solutions
- 7.1.2.3. Keypad-based Access Control Systems
- 7.2. Market Analysis, Insights and Forecast - by Automation Systems
- 7.2.1. Motors and Drivers
- 7.2.2. Sensors and Controllers
- 7.2.3. Building Management Systems
- 7.3. Market Analysis, Insights and Forecast - by End User
- 7.3.1. Industrial
- 7.3.2. Commercial
- 7.3.3. Residential
- 7.3.4. Other End Users
- 7.1. Market Analysis, Insights and Forecast - by Control Systems
- 8. Asia Pacific Energy Efficient Elevators Market Analysis, Insights and Forecast, 2019-2031
- 8.1. Market Analysis, Insights and Forecast - by Control Systems
- 8.1.1. Elevator Control System
- 8.1.2. Access Control System
- 8.1.2.1. Card-based Access Control Systems
- 8.1.2.2. Biometric Access Control Solutions
- 8.1.2.3. Keypad-based Access Control Systems
- 8.2. Market Analysis, Insights and Forecast - by Automation Systems
- 8.2.1. Motors and Drivers
- 8.2.2. Sensors and Controllers
- 8.2.3. Building Management Systems
- 8.3. Market Analysis, Insights and Forecast - by End User
- 8.3.1. Industrial
- 8.3.2. Commercial
- 8.3.3. Residential
- 8.3.4. Other End Users
- 8.1. Market Analysis, Insights and Forecast - by Control Systems
- 9. Latin America Energy Efficient Elevators Market Analysis, Insights and Forecast, 2019-2031
- 9.1. Market Analysis, Insights and Forecast - by Control Systems
- 9.1.1. Elevator Control System
- 9.1.2. Access Control System
- 9.1.2.1. Card-based Access Control Systems
- 9.1.2.2. Biometric Access Control Solutions
- 9.1.2.3. Keypad-based Access Control Systems
- 9.2. Market Analysis, Insights and Forecast - by Automation Systems
- 9.2.1. Motors and Drivers
- 9.2.2. Sensors and Controllers
- 9.2.3. Building Management Systems
- 9.3. Market Analysis, Insights and Forecast - by End User
- 9.3.1. Industrial
- 9.3.2. Commercial
- 9.3.3. Residential
- 9.3.4. Other End Users
- 9.1. Market Analysis, Insights and Forecast - by Control Systems
- 10. Middle East and Africa Energy Efficient Elevators Market Analysis, Insights and Forecast, 2019-2031
- 10.1. Market Analysis, Insights and Forecast - by Control Systems
- 10.1.1. Elevator Control System
- 10.1.2. Access Control System
- 10.1.2.1. Card-based Access Control Systems
- 10.1.2.2. Biometric Access Control Solutions
- 10.1.2.3. Keypad-based Access Control Systems
- 10.2. Market Analysis, Insights and Forecast - by Automation Systems
- 10.2.1. Motors and Drivers
- 10.2.2. Sensors and Controllers
- 10.2.3. Building Management Systems
- 10.3. Market Analysis, Insights and Forecast - by End User
- 10.3.1. Industrial
- 10.3.2. Commercial
- 10.3.3. Residential
- 10.3.4. Other End Users
- 10.1. Market Analysis, Insights and Forecast - by Control Systems
- 11. North America Energy Efficient Elevators Market Analysis, Insights and Forecast, 2019-2031
- 11.1. Market Analysis, Insights and Forecast - By Country/Sub-region
- 11.1.1 United States
- 11.1.2 Canada
- 11.1.3 Mexico
- 12. Europe Energy Efficient Elevators Market Analysis, Insights and Forecast, 2019-2031
- 12.1. Market Analysis, Insights and Forecast - By Country/Sub-region
- 12.1.1 Germany
- 12.1.2 United Kingdom
- 12.1.3 France
- 12.1.4 Spain
- 12.1.5 Italy
- 12.1.6 Spain
- 12.1.7 Belgium
- 12.1.8 Netherland
- 12.1.9 Nordics
- 12.1.10 Rest of Europe
- 13. Asia Pacific Energy Efficient Elevators Market Analysis, Insights and Forecast, 2019-2031
- 13.1. Market Analysis, Insights and Forecast - By Country/Sub-region
- 13.1.1 China
- 13.1.2 Japan
- 13.1.3 India
- 13.1.4 South Korea
- 13.1.5 Southeast Asia
- 13.1.6 Australia
- 13.1.7 Indonesia
- 13.1.8 Phillipes
- 13.1.9 Singapore
- 13.1.10 Thailandc
- 13.1.11 Rest of Asia Pacific
- 14. South America Energy Efficient Elevators Market Analysis, Insights and Forecast, 2019-2031
- 14.1. Market Analysis, Insights and Forecast - By Country/Sub-region
- 14.1.1 Brazil
- 14.1.2 Argentina
- 14.1.3 Peru
- 14.1.4 Chile
- 14.1.5 Colombia
- 14.1.6 Ecuador
- 14.1.7 Venezuela
- 14.1.8 Rest of South America
- 15. North America Energy Efficient Elevators Market Analysis, Insights and Forecast, 2019-2031
- 15.1. Market Analysis, Insights and Forecast - By Country/Sub-region
- 15.1.1 United States
- 15.1.2 Canada
- 15.1.3 Mexico
- 16. MEA Energy Efficient Elevators Market Analysis, Insights and Forecast, 2019-2031
- 16.1. Market Analysis, Insights and Forecast - By Country/Sub-region
- 16.1.1 United Arab Emirates
- 16.1.2 Saudi Arabia
- 16.1.3 South Africa
- 16.1.4 Rest of Middle East and Africa
- 17. Competitive Analysis
- 17.1. Global Market Share Analysis 2024
- 17.2. Company Profiles
- 17.2.1 Hitachi Ltd
- 17.2.1.1. Overview
- 17.2.1.2. Products
- 17.2.1.3. SWOT Analysis
- 17.2.1.4. Recent Developments
- 17.2.1.5. Financials (Based on Availability)
- 17.2.2 Mitsubishi Electric Corporation
- 17.2.2.1. Overview
- 17.2.2.2. Products
- 17.2.2.3. SWOT Analysis
- 17.2.2.4. Recent Developments
- 17.2.2.5. Financials (Based on Availability)
- 17.2.3 Thyssen Elevators Co Ltd
- 17.2.3.1. Overview
- 17.2.3.2. Products
- 17.2.3.3. SWOT Analysis
- 17.2.3.4. Recent Developments
- 17.2.3.5. Financials (Based on Availability)
- 17.2.4 KONE
- 17.2.4.1. Overview
- 17.2.4.2. Products
- 17.2.4.3. SWOT Analysis
- 17.2.4.4. Recent Developments
- 17.2.4.5. Financials (Based on Availability)
- 17.2.5 OTIS Elevator Company
- 17.2.5.1. Overview
- 17.2.5.2. Products
- 17.2.5.3. SWOT Analysis
- 17.2.5.4. Recent Developments
- 17.2.5.5. Financials (Based on Availability)
- 17.2.6 Fujitec Co Ltd
- 17.2.6.1. Overview
- 17.2.6.2. Products
- 17.2.6.3. SWOT Analysis
- 17.2.6.4. Recent Developments
- 17.2.6.5. Financials (Based on Availability)
- 17.2.7 Honeywell international*List Not Exhaustive 6 2 * LIST NOT EXHAUSTIV
- 17.2.7.1. Overview
- 17.2.7.2. Products
- 17.2.7.3. SWOT Analysis
- 17.2.7.4. Recent Developments
- 17.2.7.5. Financials (Based on Availability)
- 17.2.8 Hyundai elevators Co Ltd
- 17.2.8.1. Overview
- 17.2.8.2. Products
- 17.2.8.3. SWOT Analysis
- 17.2.8.4. Recent Developments
- 17.2.8.5. Financials (Based on Availability)
- 17.2.9 Schindler group
- 17.2.9.1. Overview
- 17.2.9.2. Products
- 17.2.9.3. SWOT Analysis
- 17.2.9.4. Recent Developments
- 17.2.9.5. Financials (Based on Availability)
- 17.2.1 Hitachi Ltd
List of Figures
- Figure 1: Global Energy Efficient Elevators Market Revenue Breakdown (Million, %) by Region 2024 & 2032
- Figure 2: North America Energy Efficient Elevators Market Revenue (Million), by Country 2024 & 2032
- Figure 3: North America Energy Efficient Elevators Market Revenue Share (%), by Country 2024 & 2032
- Figure 4: Europe Energy Efficient Elevators Market Revenue (Million), by Country 2024 & 2032
- Figure 5: Europe Energy Efficient Elevators Market Revenue Share (%), by Country 2024 & 2032
- Figure 6: Asia Pacific Energy Efficient Elevators Market Revenue (Million), by Country 2024 & 2032
- Figure 7: Asia Pacific Energy Efficient Elevators Market Revenue Share (%), by Country 2024 & 2032
- Figure 8: South America Energy Efficient Elevators Market Revenue (Million), by Country 2024 & 2032
- Figure 9: South America Energy Efficient Elevators Market Revenue Share (%), by Country 2024 & 2032
- Figure 10: North America Energy Efficient Elevators Market Revenue (Million), by Country 2024 & 2032
- Figure 11: North America Energy Efficient Elevators Market Revenue Share (%), by Country 2024 & 2032
- Figure 12: MEA Energy Efficient Elevators Market Revenue (Million), by Country 2024 & 2032
- Figure 13: MEA Energy Efficient Elevators Market Revenue Share (%), by Country 2024 & 2032
- Figure 14: North America Energy Efficient Elevators Market Revenue (Million), by Control Systems 2024 & 2032
- Figure 15: North America Energy Efficient Elevators Market Revenue Share (%), by Control Systems 2024 & 2032
- Figure 16: North America Energy Efficient Elevators Market Revenue (Million), by Automation Systems 2024 & 2032
- Figure 17: North America Energy Efficient Elevators Market Revenue Share (%), by Automation Systems 2024 & 2032
- Figure 18: North America Energy Efficient Elevators Market Revenue (Million), by End User 2024 & 2032
- Figure 19: North America Energy Efficient Elevators Market Revenue Share (%), by End User 2024 & 2032
- Figure 20: North America Energy Efficient Elevators Market Revenue (Million), by Country 2024 & 2032
- Figure 21: North America Energy Efficient Elevators Market Revenue Share (%), by Country 2024 & 2032
- Figure 22: Europe Energy Efficient Elevators Market Revenue (Million), by Control Systems 2024 & 2032
- Figure 23: Europe Energy Efficient Elevators Market Revenue Share (%), by Control Systems 2024 & 2032
- Figure 24: Europe Energy Efficient Elevators Market Revenue (Million), by Automation Systems 2024 & 2032
- Figure 25: Europe Energy Efficient Elevators Market Revenue Share (%), by Automation Systems 2024 & 2032
- Figure 26: Europe Energy Efficient Elevators Market Revenue (Million), by End User 2024 & 2032
- Figure 27: Europe Energy Efficient Elevators Market Revenue Share (%), by End User 2024 & 2032
- Figure 28: Europe Energy Efficient Elevators Market Revenue (Million), by Country 2024 & 2032
- Figure 29: Europe Energy Efficient Elevators Market Revenue Share (%), by Country 2024 & 2032
- Figure 30: Asia Pacific Energy Efficient Elevators Market Revenue (Million), by Control Systems 2024 & 2032
- Figure 31: Asia Pacific Energy Efficient Elevators Market Revenue Share (%), by Control Systems 2024 & 2032
- Figure 32: Asia Pacific Energy Efficient Elevators Market Revenue (Million), by Automation Systems 2024 & 2032
- Figure 33: Asia Pacific Energy Efficient Elevators Market Revenue Share (%), by Automation Systems 2024 & 2032
- Figure 34: Asia Pacific Energy Efficient Elevators Market Revenue (Million), by End User 2024 & 2032
- Figure 35: Asia Pacific Energy Efficient Elevators Market Revenue Share (%), by End User 2024 & 2032
- Figure 36: Asia Pacific Energy Efficient Elevators Market Revenue (Million), by Country 2024 & 2032
- Figure 37: Asia Pacific Energy Efficient Elevators Market Revenue Share (%), by Country 2024 & 2032
- Figure 38: Latin America Energy Efficient Elevators Market Revenue (Million), by Control Systems 2024 & 2032
- Figure 39: Latin America Energy Efficient Elevators Market Revenue Share (%), by Control Systems 2024 & 2032
- Figure 40: Latin America Energy Efficient Elevators Market Revenue (Million), by Automation Systems 2024 & 2032
- Figure 41: Latin America Energy Efficient Elevators Market Revenue Share (%), by Automation Systems 2024 & 2032
- Figure 42: Latin America Energy Efficient Elevators Market Revenue (Million), by End User 2024 & 2032
- Figure 43: Latin America Energy Efficient Elevators Market Revenue Share (%), by End User 2024 & 2032
- Figure 44: Latin America Energy Efficient Elevators Market Revenue (Million), by Country 2024 & 2032
- Figure 45: Latin America Energy Efficient Elevators Market Revenue Share (%), by Country 2024 & 2032
- Figure 46: Middle East and Africa Energy Efficient Elevators Market Revenue (Million), by Control Systems 2024 & 2032
- Figure 47: Middle East and Africa Energy Efficient Elevators Market Revenue Share (%), by Control Systems 2024 & 2032
- Figure 48: Middle East and Africa Energy Efficient Elevators Market Revenue (Million), by Automation Systems 2024 & 2032
- Figure 49: Middle East and Africa Energy Efficient Elevators Market Revenue Share (%), by Automation Systems 2024 & 2032
- Figure 50: Middle East and Africa Energy Efficient Elevators Market Revenue (Million), by End User 2024 & 2032
- Figure 51: Middle East and Africa Energy Efficient Elevators Market Revenue Share (%), by End User 2024 & 2032
- Figure 52: Middle East and Africa Energy Efficient Elevators Market Revenue (Million), by Country 2024 & 2032
- Figure 53: Middle East and Africa Energy Efficient Elevators Market Revenue Share (%), by Country 2024 & 2032
List of Tables
- Table 1: Global Energy Efficient Elevators Market Revenue Million Forecast, by Region 2019 & 2032
- Table 2: Global Energy Efficient Elevators Market Revenue Million Forecast, by Control Systems 2019 & 2032
- Table 3: Global Energy Efficient Elevators Market Revenue Million Forecast, by Automation Systems 2019 & 2032
- Table 4: Global Energy Efficient Elevators Market Revenue Million Forecast, by End User 2019 & 2032
- Table 5: Global Energy Efficient Elevators Market Revenue Million Forecast, by Region 2019 & 2032
- Table 6: Global Energy Efficient Elevators Market Revenue Million Forecast, by Country 2019 & 2032
- Table 7: United States Energy Efficient Elevators Market Revenue (Million) Forecast, by Application 2019 & 2032
- Table 8: Canada Energy Efficient Elevators Market Revenue (Million) Forecast, by Application 2019 & 2032
- Table 9: Mexico Energy Efficient Elevators Market Revenue (Million) Forecast, by Application 2019 & 2032
- Table 10: Global Energy Efficient Elevators Market Revenue Million Forecast, by Country 2019 & 2032
- Table 11: Germany Energy Efficient Elevators Market Revenue (Million) Forecast, by Application 2019 & 2032
- Table 12: United Kingdom Energy Efficient Elevators Market Revenue (Million) Forecast, by Application 2019 & 2032
- Table 13: France Energy Efficient Elevators Market Revenue (Million) Forecast, by Application 2019 & 2032
- Table 14: Spain Energy Efficient Elevators Market Revenue (Million) Forecast, by Application 2019 & 2032
- Table 15: Italy Energy Efficient Elevators Market Revenue (Million) Forecast, by Application 2019 & 2032
- Table 16: Spain Energy Efficient Elevators Market Revenue (Million) Forecast, by Application 2019 & 2032
- Table 17: Belgium Energy Efficient Elevators Market Revenue (Million) Forecast, by Application 2019 & 2032
- Table 18: Netherland Energy Efficient Elevators Market Revenue (Million) Forecast, by Application 2019 & 2032
- Table 19: Nordics Energy Efficient Elevators Market Revenue (Million) Forecast, by Application 2019 & 2032
- Table 20: Rest of Europe Energy Efficient Elevators Market Revenue (Million) Forecast, by Application 2019 & 2032
- Table 21: Global Energy Efficient Elevators Market Revenue Million Forecast, by Country 2019 & 2032
- Table 22: China Energy Efficient Elevators Market Revenue (Million) Forecast, by Application 2019 & 2032
- Table 23: Japan Energy Efficient Elevators Market Revenue (Million) Forecast, by Application 2019 & 2032
- Table 24: India Energy Efficient Elevators Market Revenue (Million) Forecast, by Application 2019 & 2032
- Table 25: South Korea Energy Efficient Elevators Market Revenue (Million) Forecast, by Application 2019 & 2032
- Table 26: Southeast Asia Energy Efficient Elevators Market Revenue (Million) Forecast, by Application 2019 & 2032
- Table 27: Australia Energy Efficient Elevators Market Revenue (Million) Forecast, by Application 2019 & 2032
- Table 28: Indonesia Energy Efficient Elevators Market Revenue (Million) Forecast, by Application 2019 & 2032
- Table 29: Phillipes Energy Efficient Elevators Market Revenue (Million) Forecast, by Application 2019 & 2032
- Table 30: Singapore Energy Efficient Elevators Market Revenue (Million) Forecast, by Application 2019 & 2032
- Table 31: Thailandc Energy Efficient Elevators Market Revenue (Million) Forecast, by Application 2019 & 2032
- Table 32: Rest of Asia Pacific Energy Efficient Elevators Market Revenue (Million) Forecast, by Application 2019 & 2032
- Table 33: Global Energy Efficient Elevators Market Revenue Million Forecast, by Country 2019 & 2032
- Table 34: Brazil Energy Efficient Elevators Market Revenue (Million) Forecast, by Application 2019 & 2032
- Table 35: Argentina Energy Efficient Elevators Market Revenue (Million) Forecast, by Application 2019 & 2032
- Table 36: Peru Energy Efficient Elevators Market Revenue (Million) Forecast, by Application 2019 & 2032
- Table 37: Chile Energy Efficient Elevators Market Revenue (Million) Forecast, by Application 2019 & 2032
- Table 38: Colombia Energy Efficient Elevators Market Revenue (Million) Forecast, by Application 2019 & 2032
- Table 39: Ecuador Energy Efficient Elevators Market Revenue (Million) Forecast, by Application 2019 & 2032
- Table 40: Venezuela Energy Efficient Elevators Market Revenue (Million) Forecast, by Application 2019 & 2032
- Table 41: Rest of South America Energy Efficient Elevators Market Revenue (Million) Forecast, by Application 2019 & 2032
- Table 42: Global Energy Efficient Elevators Market Revenue Million Forecast, by Country 2019 & 2032
- Table 43: United States Energy Efficient Elevators Market Revenue (Million) Forecast, by Application 2019 & 2032
- Table 44: Canada Energy Efficient Elevators Market Revenue (Million) Forecast, by Application 2019 & 2032
- Table 45: Mexico Energy Efficient Elevators Market Revenue (Million) Forecast, by Application 2019 & 2032
- Table 46: Global Energy Efficient Elevators Market Revenue Million Forecast, by Country 2019 & 2032
- Table 47: United Arab Emirates Energy Efficient Elevators Market Revenue (Million) Forecast, by Application 2019 & 2032
- Table 48: Saudi Arabia Energy Efficient Elevators Market Revenue (Million) Forecast, by Application 2019 & 2032
- Table 49: South Africa Energy Efficient Elevators Market Revenue (Million) Forecast, by Application 2019 & 2032
- Table 50: Rest of Middle East and Africa Energy Efficient Elevators Market Revenue (Million) Forecast, by Application 2019 & 2032
- Table 51: Global Energy Efficient Elevators Market Revenue Million Forecast, by Control Systems 2019 & 2032
- Table 52: Global Energy Efficient Elevators Market Revenue Million Forecast, by Automation Systems 2019 & 2032
- Table 53: Global Energy Efficient Elevators Market Revenue Million Forecast, by End User 2019 & 2032
- Table 54: Global Energy Efficient Elevators Market Revenue Million Forecast, by Country 2019 & 2032
- Table 55: United States Energy Efficient Elevators Market Revenue (Million) Forecast, by Application 2019 & 2032
- Table 56: Canada Energy Efficient Elevators Market Revenue (Million) Forecast, by Application 2019 & 2032
- Table 57: Global Energy Efficient Elevators Market Revenue Million Forecast, by Control Systems 2019 & 2032
- Table 58: Global Energy Efficient Elevators Market Revenue Million Forecast, by Automation Systems 2019 & 2032
- Table 59: Global Energy Efficient Elevators Market Revenue Million Forecast, by End User 2019 & 2032
- Table 60: Global Energy Efficient Elevators Market Revenue Million Forecast, by Country 2019 & 2032
- Table 61: Germany Energy Efficient Elevators Market Revenue (Million) Forecast, by Application 2019 & 2032
- Table 62: United Kingdom Energy Efficient Elevators Market Revenue (Million) Forecast, by Application 2019 & 2032
- Table 63: France Energy Efficient Elevators Market Revenue (Million) Forecast, by Application 2019 & 2032
- Table 64: Russia Energy Efficient Elevators Market Revenue (Million) Forecast, by Application 2019 & 2032
- Table 65: Rest of Europe Energy Efficient Elevators Market Revenue (Million) Forecast, by Application 2019 & 2032
- Table 66: Global Energy Efficient Elevators Market Revenue Million Forecast, by Control Systems 2019 & 2032
- Table 67: Global Energy Efficient Elevators Market Revenue Million Forecast, by Automation Systems 2019 & 2032
- Table 68: Global Energy Efficient Elevators Market Revenue Million Forecast, by End User 2019 & 2032
- Table 69: Global Energy Efficient Elevators Market Revenue Million Forecast, by Country 2019 & 2032
- Table 70: China Energy Efficient Elevators Market Revenue (Million) Forecast, by Application 2019 & 2032
- Table 71: Japan Energy Efficient Elevators Market Revenue (Million) Forecast, by Application 2019 & 2032
- Table 72: India Energy Efficient Elevators Market Revenue (Million) Forecast, by Application 2019 & 2032
- Table 73: Rest of Asia Pacific Energy Efficient Elevators Market Revenue (Million) Forecast, by Application 2019 & 2032
- Table 74: Global Energy Efficient Elevators Market Revenue Million Forecast, by Control Systems 2019 & 2032
- Table 75: Global Energy Efficient Elevators Market Revenue Million Forecast, by Automation Systems 2019 & 2032
- Table 76: Global Energy Efficient Elevators Market Revenue Million Forecast, by End User 2019 & 2032
- Table 77: Global Energy Efficient Elevators Market Revenue Million Forecast, by Country 2019 & 2032
- Table 78: Brazil Energy Efficient Elevators Market Revenue (Million) Forecast, by Application 2019 & 2032
- Table 79: Mexico Energy Efficient Elevators Market Revenue (Million) Forecast, by Application 2019 & 2032
- Table 80: Argentina Energy Efficient Elevators Market Revenue (Million) Forecast, by Application 2019 & 2032
- Table 81: Rest of Latin America Energy Efficient Elevators Market Revenue (Million) Forecast, by Application 2019 & 2032
- Table 82: Global Energy Efficient Elevators Market Revenue Million Forecast, by Control Systems 2019 & 2032
- Table 83: Global Energy Efficient Elevators Market Revenue Million Forecast, by Automation Systems 2019 & 2032
- Table 84: Global Energy Efficient Elevators Market Revenue Million Forecast, by End User 2019 & 2032
- Table 85: Global Energy Efficient Elevators Market Revenue Million Forecast, by Country 2019 & 2032
- Table 86: Saudi Arabia Energy Efficient Elevators Market Revenue (Million) Forecast, by Application 2019 & 2032
- Table 87: United Arab Emirates Energy Efficient Elevators Market Revenue (Million) Forecast, by Application 2019 & 2032
- Table 88: South Africa Energy Efficient Elevators Market Revenue (Million) Forecast, by Application 2019 & 2032
- Table 89: Rest of Middle East and Africa Energy Efficient Elevators Market Revenue (Million) Forecast, by Application 2019 & 2032
Frequently Asked Questions
1. What is the projected Compound Annual Growth Rate (CAGR) of the Energy Efficient Elevators Market?
The projected CAGR is approximately 15.14%.
2. Which companies are prominent players in the Energy Efficient Elevators Market?
Key companies in the market include Hitachi Ltd, Mitsubishi Electric Corporation, Thyssen Elevators Co Ltd, KONE, OTIS Elevator Company, Fujitec Co Ltd, Honeywell international*List Not Exhaustive 6 2 * LIST NOT EXHAUSTIV, Hyundai elevators Co Ltd, Schindler group.
3. What are the main segments of the Energy Efficient Elevators Market?
The market segments include Control Systems, Automation Systems, End User.
4. Can you provide details about the market size?
The market size is estimated to be USD XX Million as of 2022.
5. What are some drivers contributing to market growth?
; Increasing Demand for Energy Efficient Systems; Due to Mounting Electricity Prices in High-traffic Applications.
6. What are the notable trends driving market growth?
Industrial Sector to Significantly Contribute to the Market Demand.
7. Are there any restraints impacting market growth?
; Lack of Information and Awareness in Electricity Consumption Rate and Lack of Technological Efficiency.
8. Can you provide examples of recent developments in the market?
N/A
9. What pricing options are available for accessing the report?
Pricing options include single-user, multi-user, and enterprise licenses priced at USD 4750, USD 5250, and USD 8750 respectively.
10. Is the market size provided in terms of value or volume?
The market size is provided in terms of value, measured in Million.
11. Are there any specific market keywords associated with the report?
Yes, the market keyword associated with the report is "Energy Efficient Elevators Market," which aids in identifying and referencing the specific market segment covered.
12. How do I determine which pricing option suits my needs best?
The pricing options vary based on user requirements and access needs. Individual users may opt for single-user licenses, while businesses requiring broader access may choose multi-user or enterprise licenses for cost-effective access to the report.
13. Are there any additional resources or data provided in the Energy Efficient Elevators Market report?
While the report offers comprehensive insights, it's advisable to review the specific contents or supplementary materials provided to ascertain if additional resources or data are available.
14. How can I stay updated on further developments or reports in the Energy Efficient Elevators Market?
To stay informed about further developments, trends, and reports in the Energy Efficient Elevators Market, consider subscribing to industry newsletters, following relevant companies and organizations, or regularly checking reputable industry news sources and publications.
Methodology
Step 1 - Identification of Relevant Samples Size from Population Database


Step 2 - Approaches for Defining Global Market Size (Value, Volume* & Price*)

Note*: In applicable scenarios
Step 3 - Data Sources
Primary Research
- Web Analytics
- Survey Reports
- Research Institute
- Latest Research Reports
- Opinion Leaders
Secondary Research
- Annual Reports
- White Paper
- Latest Press Release
- Industry Association
- Paid Database
- Investor Presentations

Step 4 - Data Triangulation
Involves using different sources of information in order to increase the validity of a study
These sources are likely to be stakeholders in a program - participants, other researchers, program staff, other community members, and so on.
Then we put all data in single framework & apply various statistical tools to find out the dynamic on the market.
During the analysis stage, feedback from the stakeholder groups would be compared to determine areas of agreement as well as areas of divergence
