

Key Insights
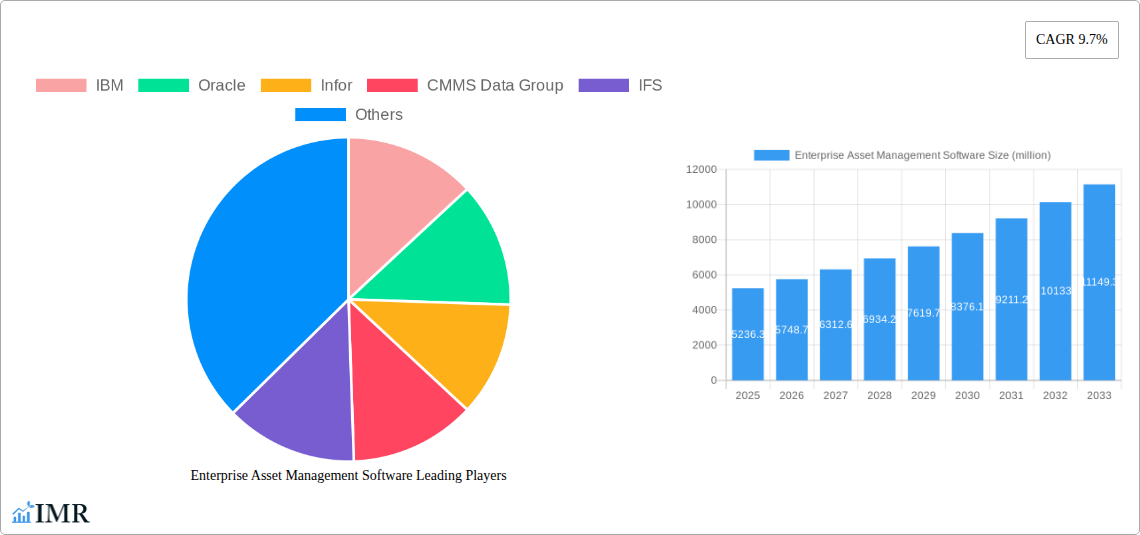
The Enterprise Asset Management (EAM) software market is experiencing robust growth, projected to reach a substantial size based on a Compound Annual Growth Rate (CAGR) of 9.7% from 2019 to 2033. The 2025 market value of $5236.3 million indicates a significant market presence, driven by several key factors. Increasing demand for optimized asset lifecycle management, coupled with the need for improved operational efficiency and reduced downtime across industries, is fueling this expansion. Digital transformation initiatives and the adoption of Industry 4.0 principles are further contributing to this growth. The rising adoption of cloud-based EAM solutions offers scalability, accessibility, and cost-effectiveness, attracting a wider range of businesses. Furthermore, the integration of advanced technologies like IoT, AI, and machine learning within EAM platforms enables predictive maintenance, enhancing operational efficiency and minimizing unforeseen equipment failures.
The competitive landscape is characterized by a mix of established players like IBM, Oracle, and SAP, alongside specialized EAM vendors like Infor, IFS, and Ramco Systems. These companies are constantly innovating to cater to evolving market demands, focusing on developing user-friendly interfaces, enhanced data analytics capabilities, and robust mobile accessibility. While the market enjoys substantial growth, challenges remain. The high initial investment cost for implementing EAM software, the complexity of integrating legacy systems, and the need for specialized expertise to effectively manage these systems represent potential restraints. However, the long-term benefits of improved asset utilization, reduced maintenance costs, and enhanced operational visibility outweigh these initial hurdles, driving continued market expansion across various sectors including manufacturing, energy, and transportation.
Enterprise Asset Management (EAM) Software Market Report: 2019-2033
This comprehensive report provides a detailed analysis of the Enterprise Asset Management (EAM) Software market, encompassing market dynamics, growth trends, regional dominance, product landscapes, key players, and future outlooks. The study period spans 2019-2033, with a base year of 2025 and a forecast period of 2025-2033. The report segments the market by various industries and delivers critical insights for industry professionals, investors, and strategic decision-makers. The total market size in 2025 is estimated at $XX billion.
Enterprise Asset Management Software Market Dynamics & Structure
The Enterprise Asset Management (EAM) software market is characterized by a moderately concentrated landscape, with a few major players holding significant market share. However, the market is dynamic, with ongoing technological innovation, evolving regulatory frameworks, and increasing adoption of substitute solutions impacting market structure. The historical period (2019-2024) saw significant mergers and acquisitions (M&A) activity, consolidating market power and fostering innovation. The estimated value of M&A deals during this period reached $XX billion.
- Market Concentration: The top 5 players held approximately XX% of the market share in 2025.
- Technological Innovation: Cloud-based solutions, AI-powered predictive maintenance, and IoT integration are driving significant innovation. However, legacy system integration and data security concerns present barriers to entry for some companies.
- Regulatory Frameworks: Industry-specific regulations (e.g., compliance standards for critical infrastructure) significantly influence EAM software adoption.
- Competitive Product Substitutes: Spreadsheet-based solutions and basic CMMS (Computerized Maintenance Management Systems) pose a competitive threat, particularly in smaller organizations.
- End-User Demographics: The market is largely driven by large enterprises and government organizations in developed economies, although adoption among smaller businesses and developing nations is gradually increasing.
- M&A Trends: Consolidation remains a key trend, with larger players acquiring smaller firms to expand their product portfolios and geographic reach.
Enterprise Asset Management Software Growth Trends & Insights
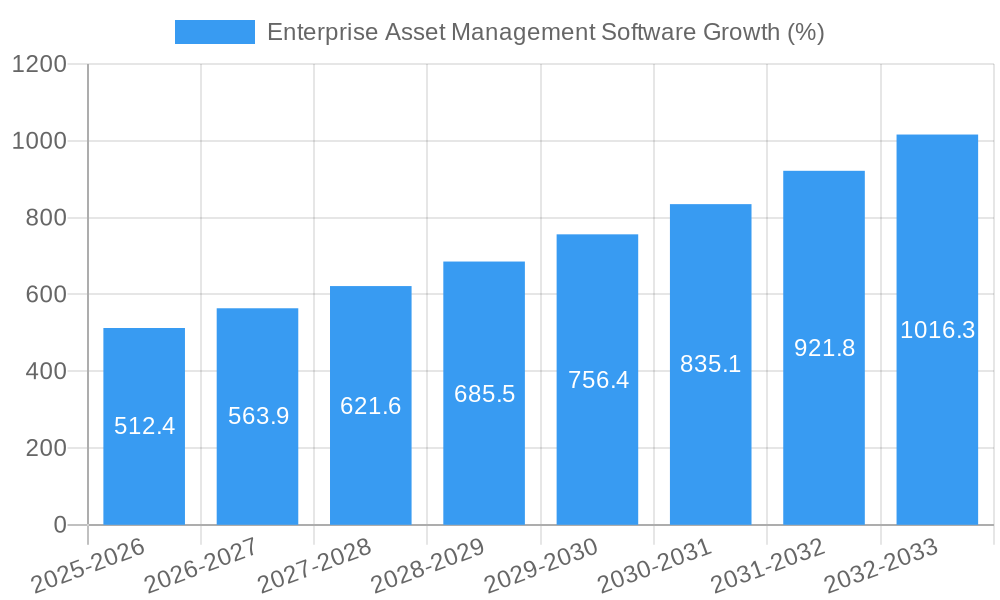
The global EAM software market exhibited robust growth during the historical period (2019-2024). Driven by increasing demand for improved asset management efficiency, enhanced operational visibility, and proactive maintenance strategies, the market witnessed a Compound Annual Growth Rate (CAGR) of XX% from 2019 to 2024. The market is projected to continue its growth trajectory, with a projected CAGR of XX% between 2025 and 2033, reaching an estimated market value of $XX billion by 2033. This growth is fueled by several key factors including the increasing adoption of cloud-based solutions, the growing focus on predictive maintenance to minimize downtime, and the rising demand for real-time asset performance monitoring across diverse industries. Furthermore, the shift toward digital transformation within organizations is fostering wider adoption of EAM software. Consumer behavior is shifting towards more integrated and user-friendly solutions, demanding higher levels of automation, and increased data analytics capabilities. Market penetration is anticipated to reach approximately XX% globally by 2033.
Dominant Regions, Countries, or Segments in Enterprise Asset Management Software
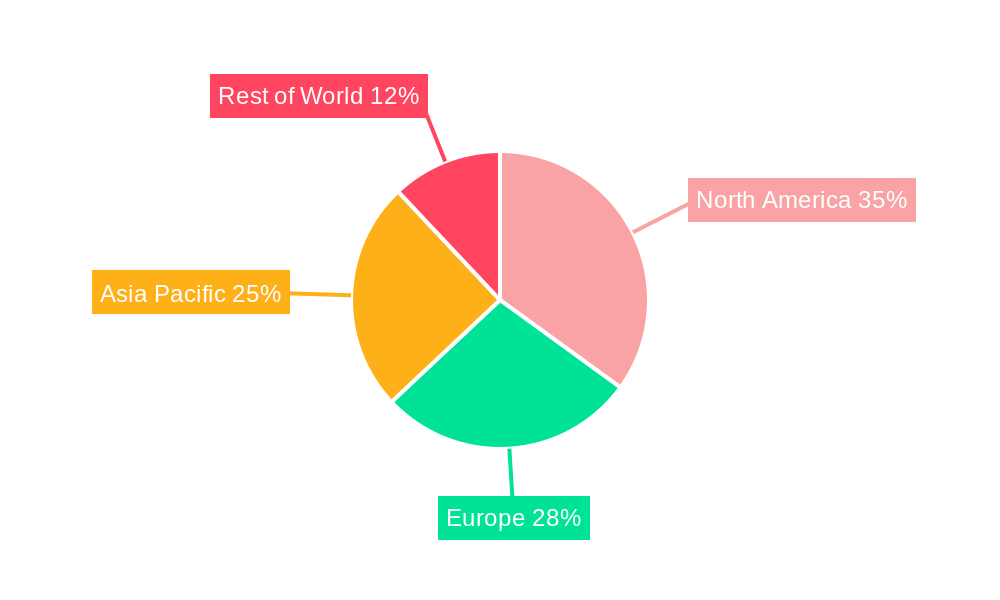
North America currently holds the largest market share in the EAM software sector, driven by high technological adoption rates, a robust industrial base, and the presence of major software vendors. Europe follows closely, with substantial growth expected in developing economies in Asia-Pacific, particularly in countries with burgeoning manufacturing and infrastructure sectors. The utilities sector demonstrates significant growth potential, largely due to regulatory pressures and increasing investment in smart grids.
- Key Drivers in North America: High technology adoption, strong industrial base, presence of major EAM software vendors.
- Key Drivers in Europe: Growing focus on asset optimization, stringent environmental regulations, and increasing adoption of Industry 4.0 technologies.
- Key Drivers in Asia-Pacific: Rapid industrialization, infrastructure development, and government initiatives promoting digital transformation.
- Market Share: North America holds an estimated XX% market share in 2025, followed by Europe at XX% and Asia-Pacific at XX%.
- Growth Potential: Asia-Pacific is projected to witness the highest growth rate over the forecast period, driven by increasing investments in infrastructure and industrial projects.
Enterprise Asset Management Software Product Landscape
The EAM software market offers a diverse range of solutions, from basic CMMS systems to sophisticated cloud-based platforms incorporating advanced analytics and IoT integration. These solutions cater to various industry-specific needs, encompassing features such as work order management, inventory tracking, preventive maintenance scheduling, and performance reporting. Recent product innovations have focused on enhancing user experience, improving data visualization capabilities, and integrating with other enterprise systems for seamless data exchange. Key performance indicators (KPIs) often tracked include asset uptime, maintenance costs, and overall equipment effectiveness (OEE). Unique selling propositions for vendors often include tailored industry solutions, AI-driven predictive capabilities, and robust mobile accessibility.
Key Drivers, Barriers & Challenges in Enterprise Asset Management Software
Key Drivers:
- Increasing need for optimized asset management and reduced downtime.
- Growing adoption of Industry 4.0 and the Industrial Internet of Things (IIoT).
- Rising demand for predictive maintenance using AI and machine learning.
- Stringent regulatory compliance requirements across various industries.
Challenges & Restraints:
- High initial investment costs for implementation and integration.
- Complexity of integrating legacy systems with new EAM solutions.
- Cybersecurity risks associated with storing and managing sensitive asset data.
- Shortage of skilled professionals to implement and manage these systems. The estimated cost of addressing these challenges is expected to be $XX billion by 2033.
Emerging Opportunities in Enterprise Asset Management Software
Significant opportunities exist in expanding EAM software adoption in untapped markets (e.g., small and medium-sized enterprises (SMEs) and developing countries). The integration of Extended Reality (XR) technologies offers new possibilities for remote asset monitoring and maintenance training. Furthermore, the development of specialized EAM solutions for specific industry verticals (e.g., renewable energy, healthcare) presents significant growth potential. The growing need for sustainability and resource optimization is also creating opportunities for green EAM solutions.
Growth Accelerators in the Enterprise Asset Management Software Industry
Long-term growth in the EAM software market will be fueled by technological advancements like AI-powered predictive maintenance, IoT-based real-time monitoring, and the proliferation of cloud-based solutions. Strategic partnerships between EAM software vendors and hardware providers will further accelerate adoption. Market expansion strategies focusing on emerging economies and underserved industries will also play a significant role in driving long-term growth. The anticipated contribution of these accelerators to market growth is estimated at $XX billion over the forecast period.
Key Players Shaping the Enterprise Asset Management Software Market
- IBM
- Oracle
- Infor
- CMMS Data Group
- IFS
- SAP
- Ramco Systems
- ABB
- Bentley Systems
- Fluke
- Maintenance Connection
- IPS-Intelligent Process Solutions
- Aptean
- Mainsaver
- CGI
- Cityworks
- AVEVA
- Accela
Notable Milestones in Enterprise Asset Management Software Sector
- 2020: Increased adoption of cloud-based EAM solutions due to the pandemic.
- 2021: Significant investments in AI and machine learning for predictive maintenance.
- 2022: Several key mergers and acquisitions consolidating market leadership.
- 2023: Growing emphasis on sustainability and green EAM solutions.
- 2024: Expansion of EAM software into new industry verticals.
In-Depth Enterprise Asset Management Software Market Outlook
The future of the EAM software market looks promising, with continued growth driven by technological innovation, increasing digitization, and the growing need for efficient asset management across all industries. Strategic opportunities lie in developing advanced analytics capabilities, integrating emerging technologies like blockchain, and expanding into new geographical markets. The market's future trajectory will be significantly shaped by the ongoing adoption of Industry 4.0 principles and the increasing emphasis on sustainable and environmentally responsible practices. The overall market potential is substantial, suggesting significant returns for investors and opportunities for innovation within the EAM software sector.
Enterprise Asset Management Software Segmentation
-
1. Application
- 1.1. Large Enterprices
- 1.2. SMEs
-
2. Types
- 2.1. Cloud Based
- 2.2. On-Premise
Enterprise Asset Management Software Segmentation By Geography
-
1. North America
- 1.1. United States
- 1.2. Canada
- 1.3. Mexico
-
2. South America
- 2.1. Brazil
- 2.2. Argentina
- 2.3. Rest of South America
-
3. Europe
- 3.1. United Kingdom
- 3.2. Germany
- 3.3. France
- 3.4. Italy
- 3.5. Spain
- 3.6. Russia
- 3.7. Benelux
- 3.8. Nordics
- 3.9. Rest of Europe
-
4. Middle East & Africa
- 4.1. Turkey
- 4.2. Israel
- 4.3. GCC
- 4.4. North Africa
- 4.5. South Africa
- 4.6. Rest of Middle East & Africa
-
5. Asia Pacific
- 5.1. China
- 5.2. India
- 5.3. Japan
- 5.4. South Korea
- 5.5. ASEAN
- 5.6. Oceania
- 5.7. Rest of Asia Pacific
Enterprise Asset Management Software REPORT HIGHLIGHTS
| Aspects | Details |
|---|---|
| Study Period | 2019-2033 |
| Base Year | 2024 |
| Estimated Year | 2025 |
| Forecast Period | 2025-2033 |
| Historical Period | 2019-2024 |
| Growth Rate | CAGR of 9.7% from 2019-2033 |
| Segmentation |
|
Table of Contents
- 1. Introduction
- 1.1. Research Scope
- 1.2. Market Segmentation
- 1.3. Research Methodology
- 1.4. Definitions and Assumptions
- 2. Executive Summary
- 2.1. Introduction
- 3. Market Dynamics
- 3.1. Introduction
- 3.2. Market Drivers
- 3.3. Market Restrains
- 3.4. Market Trends
- 4. Market Factor Analysis
- 4.1. Porters Five Forces
- 4.2. Supply/Value Chain
- 4.3. PESTEL analysis
- 4.4. Market Entropy
- 4.5. Patent/Trademark Analysis
- 5. Global Enterprise Asset Management Software Analysis, Insights and Forecast, 2019-2031
- 5.1. Market Analysis, Insights and Forecast - by Application
- 5.1.1. Large Enterprices
- 5.1.2. SMEs
- 5.2. Market Analysis, Insights and Forecast - by Types
- 5.2.1. Cloud Based
- 5.2.2. On-Premise
- 5.3. Market Analysis, Insights and Forecast - by Region
- 5.3.1. North America
- 5.3.2. South America
- 5.3.3. Europe
- 5.3.4. Middle East & Africa
- 5.3.5. Asia Pacific
- 5.1. Market Analysis, Insights and Forecast - by Application
- 6. North America Enterprise Asset Management Software Analysis, Insights and Forecast, 2019-2031
- 6.1. Market Analysis, Insights and Forecast - by Application
- 6.1.1. Large Enterprices
- 6.1.2. SMEs
- 6.2. Market Analysis, Insights and Forecast - by Types
- 6.2.1. Cloud Based
- 6.2.2. On-Premise
- 6.1. Market Analysis, Insights and Forecast - by Application
- 7. South America Enterprise Asset Management Software Analysis, Insights and Forecast, 2019-2031
- 7.1. Market Analysis, Insights and Forecast - by Application
- 7.1.1. Large Enterprices
- 7.1.2. SMEs
- 7.2. Market Analysis, Insights and Forecast - by Types
- 7.2.1. Cloud Based
- 7.2.2. On-Premise
- 7.1. Market Analysis, Insights and Forecast - by Application
- 8. Europe Enterprise Asset Management Software Analysis, Insights and Forecast, 2019-2031
- 8.1. Market Analysis, Insights and Forecast - by Application
- 8.1.1. Large Enterprices
- 8.1.2. SMEs
- 8.2. Market Analysis, Insights and Forecast - by Types
- 8.2.1. Cloud Based
- 8.2.2. On-Premise
- 8.1. Market Analysis, Insights and Forecast - by Application
- 9. Middle East & Africa Enterprise Asset Management Software Analysis, Insights and Forecast, 2019-2031
- 9.1. Market Analysis, Insights and Forecast - by Application
- 9.1.1. Large Enterprices
- 9.1.2. SMEs
- 9.2. Market Analysis, Insights and Forecast - by Types
- 9.2.1. Cloud Based
- 9.2.2. On-Premise
- 9.1. Market Analysis, Insights and Forecast - by Application
- 10. Asia Pacific Enterprise Asset Management Software Analysis, Insights and Forecast, 2019-2031
- 10.1. Market Analysis, Insights and Forecast - by Application
- 10.1.1. Large Enterprices
- 10.1.2. SMEs
- 10.2. Market Analysis, Insights and Forecast - by Types
- 10.2.1. Cloud Based
- 10.2.2. On-Premise
- 10.1. Market Analysis, Insights and Forecast - by Application
- 11. Competitive Analysis
- 11.1. Global Market Share Analysis 2024
- 11.2. Company Profiles
- 11.2.1 IBM
- 11.2.1.1. Overview
- 11.2.1.2. Products
- 11.2.1.3. SWOT Analysis
- 11.2.1.4. Recent Developments
- 11.2.1.5. Financials (Based on Availability)
- 11.2.2 Oracle
- 11.2.2.1. Overview
- 11.2.2.2. Products
- 11.2.2.3. SWOT Analysis
- 11.2.2.4. Recent Developments
- 11.2.2.5. Financials (Based on Availability)
- 11.2.3 Infor
- 11.2.3.1. Overview
- 11.2.3.2. Products
- 11.2.3.3. SWOT Analysis
- 11.2.3.4. Recent Developments
- 11.2.3.5. Financials (Based on Availability)
- 11.2.4 CMMS Data Group
- 11.2.4.1. Overview
- 11.2.4.2. Products
- 11.2.4.3. SWOT Analysis
- 11.2.4.4. Recent Developments
- 11.2.4.5. Financials (Based on Availability)
- 11.2.5 IFS
- 11.2.5.1. Overview
- 11.2.5.2. Products
- 11.2.5.3. SWOT Analysis
- 11.2.5.4. Recent Developments
- 11.2.5.5. Financials (Based on Availability)
- 11.2.6 SAP
- 11.2.6.1. Overview
- 11.2.6.2. Products
- 11.2.6.3. SWOT Analysis
- 11.2.6.4. Recent Developments
- 11.2.6.5. Financials (Based on Availability)
- 11.2.7 Ramco Systems
- 11.2.7.1. Overview
- 11.2.7.2. Products
- 11.2.7.3. SWOT Analysis
- 11.2.7.4. Recent Developments
- 11.2.7.5. Financials (Based on Availability)
- 11.2.8 ABB
- 11.2.8.1. Overview
- 11.2.8.2. Products
- 11.2.8.3. SWOT Analysis
- 11.2.8.4. Recent Developments
- 11.2.8.5. Financials (Based on Availability)
- 11.2.9 Bentley Systems
- 11.2.9.1. Overview
- 11.2.9.2. Products
- 11.2.9.3. SWOT Analysis
- 11.2.9.4. Recent Developments
- 11.2.9.5. Financials (Based on Availability)
- 11.2.10 Fluke
- 11.2.10.1. Overview
- 11.2.10.2. Products
- 11.2.10.3. SWOT Analysis
- 11.2.10.4. Recent Developments
- 11.2.10.5. Financials (Based on Availability)
- 11.2.11 Maintenance Connection
- 11.2.11.1. Overview
- 11.2.11.2. Products
- 11.2.11.3. SWOT Analysis
- 11.2.11.4. Recent Developments
- 11.2.11.5. Financials (Based on Availability)
- 11.2.12 IPS-Intelligent Process Solutions
- 11.2.12.1. Overview
- 11.2.12.2. Products
- 11.2.12.3. SWOT Analysis
- 11.2.12.4. Recent Developments
- 11.2.12.5. Financials (Based on Availability)
- 11.2.13 Aptean
- 11.2.13.1. Overview
- 11.2.13.2. Products
- 11.2.13.3. SWOT Analysis
- 11.2.13.4. Recent Developments
- 11.2.13.5. Financials (Based on Availability)
- 11.2.14 Mainsaver
- 11.2.14.1. Overview
- 11.2.14.2. Products
- 11.2.14.3. SWOT Analysis
- 11.2.14.4. Recent Developments
- 11.2.14.5. Financials (Based on Availability)
- 11.2.15 CGI
- 11.2.15.1. Overview
- 11.2.15.2. Products
- 11.2.15.3. SWOT Analysis
- 11.2.15.4. Recent Developments
- 11.2.15.5. Financials (Based on Availability)
- 11.2.16 Cityworks
- 11.2.16.1. Overview
- 11.2.16.2. Products
- 11.2.16.3. SWOT Analysis
- 11.2.16.4. Recent Developments
- 11.2.16.5. Financials (Based on Availability)
- 11.2.17 AVEVA
- 11.2.17.1. Overview
- 11.2.17.2. Products
- 11.2.17.3. SWOT Analysis
- 11.2.17.4. Recent Developments
- 11.2.17.5. Financials (Based on Availability)
- 11.2.18 Accela
- 11.2.18.1. Overview
- 11.2.18.2. Products
- 11.2.18.3. SWOT Analysis
- 11.2.18.4. Recent Developments
- 11.2.18.5. Financials (Based on Availability)
- 11.2.1 IBM
List of Figures
- Figure 1: Global Enterprise Asset Management Software Revenue Breakdown (million, %) by Region 2024 & 2032
- Figure 2: North America Enterprise Asset Management Software Revenue (million), by Application 2024 & 2032
- Figure 3: North America Enterprise Asset Management Software Revenue Share (%), by Application 2024 & 2032
- Figure 4: North America Enterprise Asset Management Software Revenue (million), by Types 2024 & 2032
- Figure 5: North America Enterprise Asset Management Software Revenue Share (%), by Types 2024 & 2032
- Figure 6: North America Enterprise Asset Management Software Revenue (million), by Country 2024 & 2032
- Figure 7: North America Enterprise Asset Management Software Revenue Share (%), by Country 2024 & 2032
- Figure 8: South America Enterprise Asset Management Software Revenue (million), by Application 2024 & 2032
- Figure 9: South America Enterprise Asset Management Software Revenue Share (%), by Application 2024 & 2032
- Figure 10: South America Enterprise Asset Management Software Revenue (million), by Types 2024 & 2032
- Figure 11: South America Enterprise Asset Management Software Revenue Share (%), by Types 2024 & 2032
- Figure 12: South America Enterprise Asset Management Software Revenue (million), by Country 2024 & 2032
- Figure 13: South America Enterprise Asset Management Software Revenue Share (%), by Country 2024 & 2032
- Figure 14: Europe Enterprise Asset Management Software Revenue (million), by Application 2024 & 2032
- Figure 15: Europe Enterprise Asset Management Software Revenue Share (%), by Application 2024 & 2032
- Figure 16: Europe Enterprise Asset Management Software Revenue (million), by Types 2024 & 2032
- Figure 17: Europe Enterprise Asset Management Software Revenue Share (%), by Types 2024 & 2032
- Figure 18: Europe Enterprise Asset Management Software Revenue (million), by Country 2024 & 2032
- Figure 19: Europe Enterprise Asset Management Software Revenue Share (%), by Country 2024 & 2032
- Figure 20: Middle East & Africa Enterprise Asset Management Software Revenue (million), by Application 2024 & 2032
- Figure 21: Middle East & Africa Enterprise Asset Management Software Revenue Share (%), by Application 2024 & 2032
- Figure 22: Middle East & Africa Enterprise Asset Management Software Revenue (million), by Types 2024 & 2032
- Figure 23: Middle East & Africa Enterprise Asset Management Software Revenue Share (%), by Types 2024 & 2032
- Figure 24: Middle East & Africa Enterprise Asset Management Software Revenue (million), by Country 2024 & 2032
- Figure 25: Middle East & Africa Enterprise Asset Management Software Revenue Share (%), by Country 2024 & 2032
- Figure 26: Asia Pacific Enterprise Asset Management Software Revenue (million), by Application 2024 & 2032
- Figure 27: Asia Pacific Enterprise Asset Management Software Revenue Share (%), by Application 2024 & 2032
- Figure 28: Asia Pacific Enterprise Asset Management Software Revenue (million), by Types 2024 & 2032
- Figure 29: Asia Pacific Enterprise Asset Management Software Revenue Share (%), by Types 2024 & 2032
- Figure 30: Asia Pacific Enterprise Asset Management Software Revenue (million), by Country 2024 & 2032
- Figure 31: Asia Pacific Enterprise Asset Management Software Revenue Share (%), by Country 2024 & 2032
List of Tables
- Table 1: Global Enterprise Asset Management Software Revenue million Forecast, by Region 2019 & 2032
- Table 2: Global Enterprise Asset Management Software Revenue million Forecast, by Application 2019 & 2032
- Table 3: Global Enterprise Asset Management Software Revenue million Forecast, by Types 2019 & 2032
- Table 4: Global Enterprise Asset Management Software Revenue million Forecast, by Region 2019 & 2032
- Table 5: Global Enterprise Asset Management Software Revenue million Forecast, by Application 2019 & 2032
- Table 6: Global Enterprise Asset Management Software Revenue million Forecast, by Types 2019 & 2032
- Table 7: Global Enterprise Asset Management Software Revenue million Forecast, by Country 2019 & 2032
- Table 8: United States Enterprise Asset Management Software Revenue (million) Forecast, by Application 2019 & 2032
- Table 9: Canada Enterprise Asset Management Software Revenue (million) Forecast, by Application 2019 & 2032
- Table 10: Mexico Enterprise Asset Management Software Revenue (million) Forecast, by Application 2019 & 2032
- Table 11: Global Enterprise Asset Management Software Revenue million Forecast, by Application 2019 & 2032
- Table 12: Global Enterprise Asset Management Software Revenue million Forecast, by Types 2019 & 2032
- Table 13: Global Enterprise Asset Management Software Revenue million Forecast, by Country 2019 & 2032
- Table 14: Brazil Enterprise Asset Management Software Revenue (million) Forecast, by Application 2019 & 2032
- Table 15: Argentina Enterprise Asset Management Software Revenue (million) Forecast, by Application 2019 & 2032
- Table 16: Rest of South America Enterprise Asset Management Software Revenue (million) Forecast, by Application 2019 & 2032
- Table 17: Global Enterprise Asset Management Software Revenue million Forecast, by Application 2019 & 2032
- Table 18: Global Enterprise Asset Management Software Revenue million Forecast, by Types 2019 & 2032
- Table 19: Global Enterprise Asset Management Software Revenue million Forecast, by Country 2019 & 2032
- Table 20: United Kingdom Enterprise Asset Management Software Revenue (million) Forecast, by Application 2019 & 2032
- Table 21: Germany Enterprise Asset Management Software Revenue (million) Forecast, by Application 2019 & 2032
- Table 22: France Enterprise Asset Management Software Revenue (million) Forecast, by Application 2019 & 2032
- Table 23: Italy Enterprise Asset Management Software Revenue (million) Forecast, by Application 2019 & 2032
- Table 24: Spain Enterprise Asset Management Software Revenue (million) Forecast, by Application 2019 & 2032
- Table 25: Russia Enterprise Asset Management Software Revenue (million) Forecast, by Application 2019 & 2032
- Table 26: Benelux Enterprise Asset Management Software Revenue (million) Forecast, by Application 2019 & 2032
- Table 27: Nordics Enterprise Asset Management Software Revenue (million) Forecast, by Application 2019 & 2032
- Table 28: Rest of Europe Enterprise Asset Management Software Revenue (million) Forecast, by Application 2019 & 2032
- Table 29: Global Enterprise Asset Management Software Revenue million Forecast, by Application 2019 & 2032
- Table 30: Global Enterprise Asset Management Software Revenue million Forecast, by Types 2019 & 2032
- Table 31: Global Enterprise Asset Management Software Revenue million Forecast, by Country 2019 & 2032
- Table 32: Turkey Enterprise Asset Management Software Revenue (million) Forecast, by Application 2019 & 2032
- Table 33: Israel Enterprise Asset Management Software Revenue (million) Forecast, by Application 2019 & 2032
- Table 34: GCC Enterprise Asset Management Software Revenue (million) Forecast, by Application 2019 & 2032
- Table 35: North Africa Enterprise Asset Management Software Revenue (million) Forecast, by Application 2019 & 2032
- Table 36: South Africa Enterprise Asset Management Software Revenue (million) Forecast, by Application 2019 & 2032
- Table 37: Rest of Middle East & Africa Enterprise Asset Management Software Revenue (million) Forecast, by Application 2019 & 2032
- Table 38: Global Enterprise Asset Management Software Revenue million Forecast, by Application 2019 & 2032
- Table 39: Global Enterprise Asset Management Software Revenue million Forecast, by Types 2019 & 2032
- Table 40: Global Enterprise Asset Management Software Revenue million Forecast, by Country 2019 & 2032
- Table 41: China Enterprise Asset Management Software Revenue (million) Forecast, by Application 2019 & 2032
- Table 42: India Enterprise Asset Management Software Revenue (million) Forecast, by Application 2019 & 2032
- Table 43: Japan Enterprise Asset Management Software Revenue (million) Forecast, by Application 2019 & 2032
- Table 44: South Korea Enterprise Asset Management Software Revenue (million) Forecast, by Application 2019 & 2032
- Table 45: ASEAN Enterprise Asset Management Software Revenue (million) Forecast, by Application 2019 & 2032
- Table 46: Oceania Enterprise Asset Management Software Revenue (million) Forecast, by Application 2019 & 2032
- Table 47: Rest of Asia Pacific Enterprise Asset Management Software Revenue (million) Forecast, by Application 2019 & 2032
Frequently Asked Questions
1. What is the projected Compound Annual Growth Rate (CAGR) of the Enterprise Asset Management Software?
The projected CAGR is approximately 9.7%.
2. Which companies are prominent players in the Enterprise Asset Management Software?
Key companies in the market include IBM, Oracle, Infor, CMMS Data Group, IFS, SAP, Ramco Systems, ABB, Bentley Systems, Fluke, Maintenance Connection, IPS-Intelligent Process Solutions, Aptean, Mainsaver, CGI, Cityworks, AVEVA, Accela.
3. What are the main segments of the Enterprise Asset Management Software?
The market segments include Application, Types.
4. Can you provide details about the market size?
The market size is estimated to be USD 5236.3 million as of 2022.
5. What are some drivers contributing to market growth?
N/A
6. What are the notable trends driving market growth?
N/A
7. Are there any restraints impacting market growth?
N/A
8. Can you provide examples of recent developments in the market?
N/A
9. What pricing options are available for accessing the report?
Pricing options include single-user, multi-user, and enterprise licenses priced at USD 2900.00, USD 4350.00, and USD 5800.00 respectively.
10. Is the market size provided in terms of value or volume?
The market size is provided in terms of value, measured in million.
11. Are there any specific market keywords associated with the report?
Yes, the market keyword associated with the report is "Enterprise Asset Management Software," which aids in identifying and referencing the specific market segment covered.
12. How do I determine which pricing option suits my needs best?
The pricing options vary based on user requirements and access needs. Individual users may opt for single-user licenses, while businesses requiring broader access may choose multi-user or enterprise licenses for cost-effective access to the report.
13. Are there any additional resources or data provided in the Enterprise Asset Management Software report?
While the report offers comprehensive insights, it's advisable to review the specific contents or supplementary materials provided to ascertain if additional resources or data are available.
14. How can I stay updated on further developments or reports in the Enterprise Asset Management Software?
To stay informed about further developments, trends, and reports in the Enterprise Asset Management Software, consider subscribing to industry newsletters, following relevant companies and organizations, or regularly checking reputable industry news sources and publications.
Methodology
Step 1 - Identification of Relevant Samples Size from Population Database


Step 2 - Approaches for Defining Global Market Size (Value, Volume* & Price*)

Note*: In applicable scenarios
Step 3 - Data Sources
Primary Research
- Web Analytics
- Survey Reports
- Research Institute
- Latest Research Reports
- Opinion Leaders
Secondary Research
- Annual Reports
- White Paper
- Latest Press Release
- Industry Association
- Paid Database
- Investor Presentations

Step 4 - Data Triangulation
Involves using different sources of information in order to increase the validity of a study
These sources are likely to be stakeholders in a program - participants, other researchers, program staff, other community members, and so on.
Then we put all data in single framework & apply various statistical tools to find out the dynamic on the market.
During the analysis stage, feedback from the stakeholder groups would be compared to determine areas of agreement as well as areas of divergence
