

Key Insights
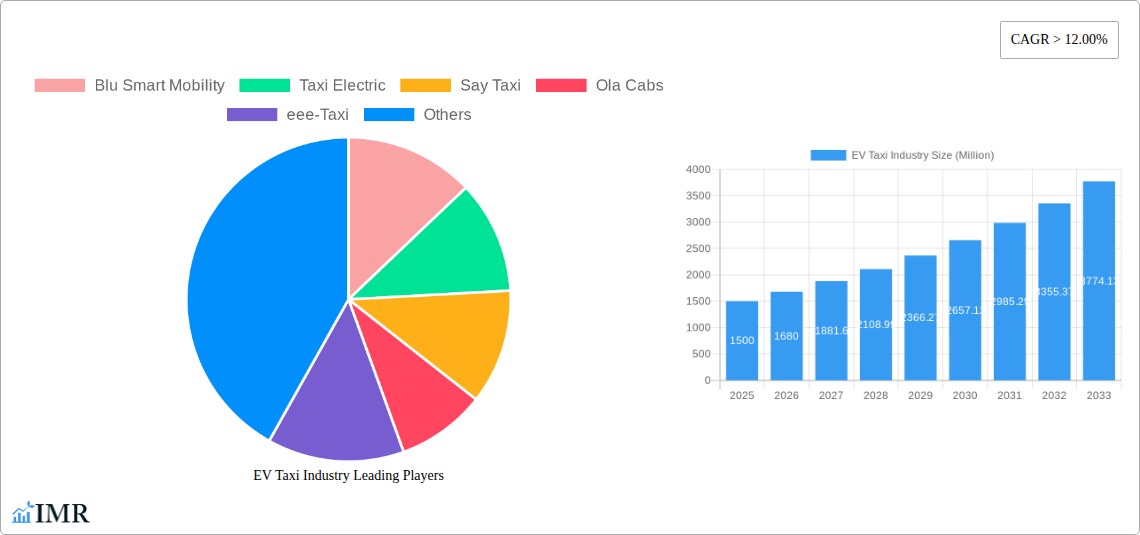
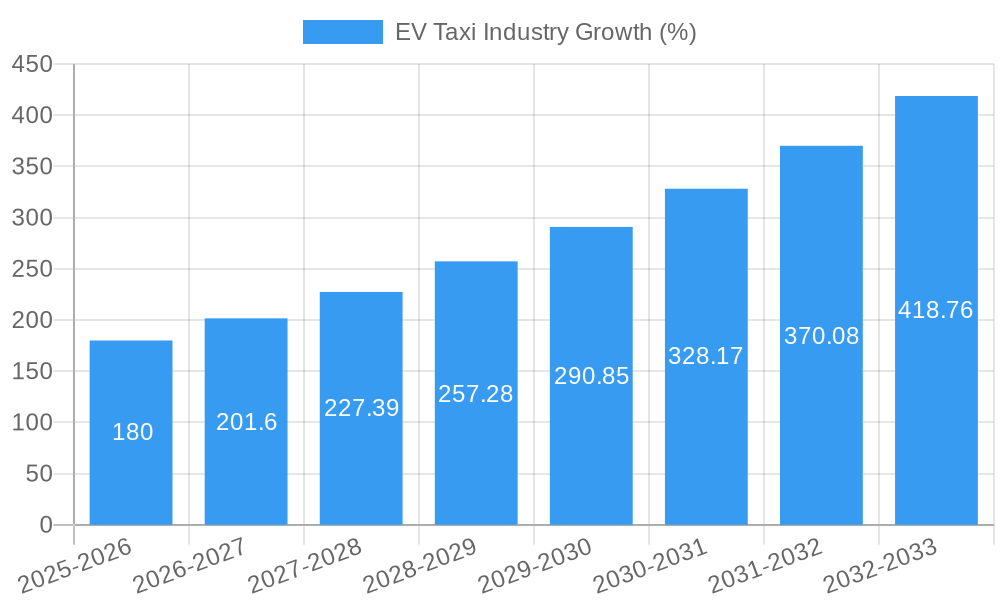
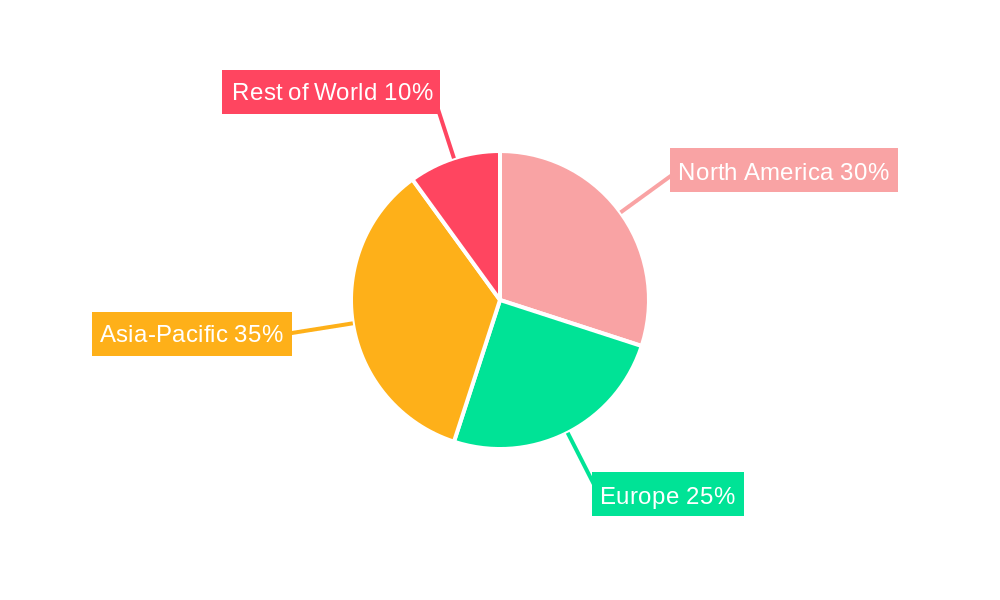
The global Electric Vehicle (EV) taxi market is experiencing robust growth, driven by increasing environmental concerns, stringent emission regulations, and the decreasing cost of EV batteries. The market's Compound Annual Growth Rate (CAGR) exceeding 12% signifies a significant expansion projected from 2025 to 2033. This growth is fueled by several key factors. Firstly, governments worldwide are actively incentivizing the adoption of EVs through subsidies and tax breaks, making them a more financially attractive option for taxi operators. Secondly, advancements in battery technology are leading to increased range and reduced charging times, addressing previous concerns regarding operational efficiency. Thirdly, rising consumer demand for eco-friendly transportation options is further driving the shift towards EV taxis. The market is segmented by vehicle type (two-wheelers and four-wheelers) and EV type (Hybrid Electric Vehicles and Battery Electric Vehicles), with Battery Electric Vehicles projected to dominate due to their lower running costs and environmental benefits. Major players like Ola Cabs, Uber, and Blu Smart Mobility are actively investing in EV taxi fleets, furthering market expansion. Regions like North America, Europe, and Asia-Pacific are anticipated to witness significant growth, propelled by substantial government support and a growing middle class with increasing disposable income.
However, challenges remain. The high initial cost of EVs compared to conventional vehicles poses a barrier to entry for some operators. Furthermore, the limited charging infrastructure in certain regions and the time required for charging can affect operational efficiency. Addressing these challenges through strategic investments in charging infrastructure and continued advancements in battery technology will be crucial for sustaining the market's momentum. The market's success hinges on collaboration between governments, private sector players, and technology providers to create a supportive ecosystem that fosters the widespread adoption of EV taxis. This collaborative approach will unlock the full potential of this rapidly growing market segment.
EV Taxi Industry Market Report: 2019-2033
This comprehensive report provides a detailed analysis of the rapidly evolving Electric Vehicle (EV) Taxi industry, encompassing market dynamics, growth trends, regional dominance, product landscape, and key players. The study period covers 2019-2033, with a base year of 2025 and a forecast period of 2025-2033. The report utilizes data from the historical period of 2019-2024, providing a robust foundation for future projections. This report focuses on the parent market of the Transportation sector and the child market of Taxi services. Expected market size in 2025 is predicted to be xx Million units.
EV Taxi Industry Market Dynamics & Structure
The EV taxi market is characterized by increasing market concentration, driven by technological advancements and consolidation through mergers and acquisitions (M&A). The industry is witnessing significant technological innovation, particularly in battery technology, charging infrastructure, and autonomous driving capabilities. Regulatory frameworks, including emission standards and subsidies, are playing a crucial role in shaping market growth. Competitive substitutes include traditional gasoline-powered taxis and ride-sharing services. End-user demographics are shifting towards environmentally conscious and tech-savvy consumers.
- Market Concentration: The market is moderately concentrated, with a few major players holding significant market share (estimated at xx% in 2025 for the top 5 players).
- M&A Activity: An estimated xx M&A deals occurred in the EV taxi sector between 2019 and 2024.
- Technological Innovation: Key innovations include advancements in battery range, fast-charging technology, and the integration of smart features.
- Regulatory Landscape: Government regulations regarding emissions, safety standards, and licensing are influencing market dynamics. Subsidies and tax incentives are encouraging EV adoption.
- Innovation Barriers: High initial investment costs and limited charging infrastructure remain significant barriers to entry for new players.
EV Taxi Industry Growth Trends & Insights
The EV taxi market is experiencing substantial growth, driven by increasing environmental concerns, falling battery costs, and government support for sustainable transportation. The market size is projected to reach xx Million units by 2033, exhibiting a Compound Annual Growth Rate (CAGR) of xx% during the forecast period. Market penetration is steadily rising, with a projected xx% market share for EVs in the taxi sector by 2033. Technological disruptions, such as the development of autonomous driving systems, are expected to further accelerate market growth. Shifting consumer preferences toward environmentally friendly transportation options are also boosting demand.
Dominant Regions, Countries, or Segments in EV Taxi Industry
The Asia-Pacific region is expected to dominate the EV taxi market, driven by strong government support, growing urbanization, and rising disposable incomes. Within this region, India and China are anticipated to witness significant growth. The four-wheeler taxi segment holds the largest market share, although two-wheeler taxis are experiencing rapid expansion in densely populated urban areas. Battery Electric Vehicles (BEVs) are progressively gaining traction over Hybrid Electric Vehicles (HEVs), due to their greater environmental benefits and increasing technological advancements.
- Key Drivers in Asia-Pacific:
- Supportive government policies, including subsidies and tax incentives.
- Rapid urbanization and increasing demand for efficient transportation.
- Growing middle class and rising disposable incomes.
- Four-Wheeler Taxi Segment Dominance:
- Higher passenger capacity and greater comfort compared to two-wheelers.
- Suitability for longer distances and diverse passenger needs.
- BEV Market Share Growth:
- Improved battery technology leading to longer ranges and faster charging times.
- Enhanced environmental benefits compared to HEVs.
EV Taxi Industry Product Landscape
The EV taxi market features a diverse range of vehicles, ranging from compact city cars to larger SUVs, catering to varied passenger needs and operational requirements. Key product innovations include improved battery technology, advanced driver-assistance systems (ADAS), and connected car features enhancing passenger experience and operational efficiency. Unique selling propositions include enhanced fuel efficiency, reduced emissions, and advanced technological features.
Key Drivers, Barriers & Challenges in EV Taxi Industry
Key Drivers: Growing environmental concerns, government regulations promoting EV adoption (e.g., emission standards), decreasing battery costs, and technological advancements in battery technology and charging infrastructure are key drivers. Furthermore, the increasing preference for sustainable transportation among consumers is significantly boosting market growth.
Key Challenges: High upfront costs of EVs, limited charging infrastructure availability, range anxiety among drivers and passengers, and the high cost of battery replacement are significant challenges hindering the widespread adoption of EV taxis. Supply chain disruptions and competition from traditional gasoline-powered taxis also pose challenges. Regulatory hurdles in securing necessary permits and licenses can slow market expansion.
Emerging Opportunities in EV Taxi Industry
Emerging opportunities include the expansion into underserved markets, particularly in developing countries, the integration of autonomous driving technology, and the development of innovative business models such as subscription services or ride-sharing platforms specializing in EVs. Furthermore, exploring partnerships with charging infrastructure providers to overcome range anxiety and enhance operational efficiency presents significant opportunities. The rising demand for contactless and hygienic transport solutions post-pandemic further enhances the market's potential.
Growth Accelerators in the EV Taxi Industry Industry
Technological breakthroughs in battery technology, particularly improvements in energy density, charging speed, and lifespan, will significantly accelerate the market's growth. Strategic partnerships between EV manufacturers, charging infrastructure providers, and ride-sharing platforms will create a synergistic effect driving broader adoption. Expanding into new geographic markets and catering to diverse customer needs with specialized vehicle types will also fuel market expansion.
Key Players Shaping the EV Taxi Market
- Blu Smart Mobility
- Taxi Electric
- Say Taxi
- Ola Cabs
- eee-Taxi
- Connexxion
- Uber
- Prakrit
Notable Milestones in EV Taxi Industry Sector
- 2020: Several major ride-hailing companies announce significant investments in EV fleets.
- 2021: Government initiatives to promote EV adoption are implemented in key markets.
- 2022: Several new EV taxi models are launched, featuring enhanced battery technology and charging capabilities.
- 2023: Significant progress is made in developing autonomous driving technology for EV taxis.
- 2024: Several partnerships between EV manufacturers and charging infrastructure providers are formed.
In-Depth EV Taxi Industry Market Outlook
The EV taxi market is poised for substantial growth, driven by continuous technological advancements, supportive government policies, and growing consumer preference for sustainable transportation. Strategic partnerships, investments in charging infrastructure, and the emergence of autonomous driving technology will further accelerate market expansion. This report suggests a promising outlook for the EV taxi sector, presenting attractive opportunities for investors and stakeholders alike.
EV Taxi Industry Segmentation
-
1. Type
- 1.1. Hybrid Electric Vehicle
- 1.2. Battery Electric Vehicle
-
2. Vehicle Type
- 2.1. Two Wheeler Taxi
- 2.2. Four Wheeler Taxi
EV Taxi Industry Segmentation By Geography
- 1. United States
- 2. Canada
- 3. Rest of North America
- 4. Germany
- 5. United Kingdom
- 6. France
- 7. Italy
- 8. Rest of Europe
- 9. China
- 10. India
- 11. Japan
- 12. South Korea
- 13. Rest of Asia Pacific
- 14. Mexico
- 15. Brazil
- 16. United Arab Emirates
- 17. Other Countries
EV Taxi Industry REPORT HIGHLIGHTS
| Aspects | Details |
|---|---|
| Study Period | 2019-2033 |
| Base Year | 2024 |
| Estimated Year | 2025 |
| Forecast Period | 2025-2033 |
| Historical Period | 2019-2024 |
| Growth Rate | CAGR of > 12.00% from 2019-2033 |
| Segmentation |
|
Table of Contents
- 1. Introduction
- 1.1. Research Scope
- 1.2. Market Segmentation
- 1.3. Research Methodology
- 1.4. Definitions and Assumptions
- 2. Executive Summary
- 2.1. Introduction
- 3. Market Dynamics
- 3.1. Introduction
- 3.2. Market Drivers
- 3.2.1. Government Policies to promote electric Vehicles Sales
- 3.3. Market Restrains
- 3.3.1. High Cost of Capital Expenditure for Electric Vehicle Infrastructure
- 3.4. Market Trends
- 3.4.1. Government Initiatives and Investment is Boosting the Demand
- 4. Market Factor Analysis
- 4.1. Porters Five Forces
- 4.2. Supply/Value Chain
- 4.3. PESTEL analysis
- 4.4. Market Entropy
- 4.5. Patent/Trademark Analysis
- 5. Global EV Taxi Industry Analysis, Insights and Forecast, 2019-2031
- 5.1. Market Analysis, Insights and Forecast - by Type
- 5.1.1. Hybrid Electric Vehicle
- 5.1.2. Battery Electric Vehicle
- 5.2. Market Analysis, Insights and Forecast - by Vehicle Type
- 5.2.1. Two Wheeler Taxi
- 5.2.2. Four Wheeler Taxi
- 5.3. Market Analysis, Insights and Forecast - by Region
- 5.3.1. United States
- 5.3.2. Canada
- 5.3.3. Rest of North America
- 5.3.4. Germany
- 5.3.5. United Kingdom
- 5.3.6. France
- 5.3.7. Italy
- 5.3.8. Rest of Europe
- 5.3.9. China
- 5.3.10. India
- 5.3.11. Japan
- 5.3.12. South Korea
- 5.3.13. Rest of Asia Pacific
- 5.3.14. Mexico
- 5.3.15. Brazil
- 5.3.16. United Arab Emirates
- 5.3.17. Other Countries
- 5.1. Market Analysis, Insights and Forecast - by Type
- 6. United States EV Taxi Industry Analysis, Insights and Forecast, 2019-2031
- 6.1. Market Analysis, Insights and Forecast - by Type
- 6.1.1. Hybrid Electric Vehicle
- 6.1.2. Battery Electric Vehicle
- 6.2. Market Analysis, Insights and Forecast - by Vehicle Type
- 6.2.1. Two Wheeler Taxi
- 6.2.2. Four Wheeler Taxi
- 6.1. Market Analysis, Insights and Forecast - by Type
- 7. Canada EV Taxi Industry Analysis, Insights and Forecast, 2019-2031
- 7.1. Market Analysis, Insights and Forecast - by Type
- 7.1.1. Hybrid Electric Vehicle
- 7.1.2. Battery Electric Vehicle
- 7.2. Market Analysis, Insights and Forecast - by Vehicle Type
- 7.2.1. Two Wheeler Taxi
- 7.2.2. Four Wheeler Taxi
- 7.1. Market Analysis, Insights and Forecast - by Type
- 8. Rest of North America EV Taxi Industry Analysis, Insights and Forecast, 2019-2031
- 8.1. Market Analysis, Insights and Forecast - by Type
- 8.1.1. Hybrid Electric Vehicle
- 8.1.2. Battery Electric Vehicle
- 8.2. Market Analysis, Insights and Forecast - by Vehicle Type
- 8.2.1. Two Wheeler Taxi
- 8.2.2. Four Wheeler Taxi
- 8.1. Market Analysis, Insights and Forecast - by Type
- 9. Germany EV Taxi Industry Analysis, Insights and Forecast, 2019-2031
- 9.1. Market Analysis, Insights and Forecast - by Type
- 9.1.1. Hybrid Electric Vehicle
- 9.1.2. Battery Electric Vehicle
- 9.2. Market Analysis, Insights and Forecast - by Vehicle Type
- 9.2.1. Two Wheeler Taxi
- 9.2.2. Four Wheeler Taxi
- 9.1. Market Analysis, Insights and Forecast - by Type
- 10. United Kingdom EV Taxi Industry Analysis, Insights and Forecast, 2019-2031
- 10.1. Market Analysis, Insights and Forecast - by Type
- 10.1.1. Hybrid Electric Vehicle
- 10.1.2. Battery Electric Vehicle
- 10.2. Market Analysis, Insights and Forecast - by Vehicle Type
- 10.2.1. Two Wheeler Taxi
- 10.2.2. Four Wheeler Taxi
- 10.1. Market Analysis, Insights and Forecast - by Type
- 11. France EV Taxi Industry Analysis, Insights and Forecast, 2019-2031
- 11.1. Market Analysis, Insights and Forecast - by Type
- 11.1.1. Hybrid Electric Vehicle
- 11.1.2. Battery Electric Vehicle
- 11.2. Market Analysis, Insights and Forecast - by Vehicle Type
- 11.2.1. Two Wheeler Taxi
- 11.2.2. Four Wheeler Taxi
- 11.1. Market Analysis, Insights and Forecast - by Type
- 12. Italy EV Taxi Industry Analysis, Insights and Forecast, 2019-2031
- 12.1. Market Analysis, Insights and Forecast - by Type
- 12.1.1. Hybrid Electric Vehicle
- 12.1.2. Battery Electric Vehicle
- 12.2. Market Analysis, Insights and Forecast - by Vehicle Type
- 12.2.1. Two Wheeler Taxi
- 12.2.2. Four Wheeler Taxi
- 12.1. Market Analysis, Insights and Forecast - by Type
- 13. Rest of Europe EV Taxi Industry Analysis, Insights and Forecast, 2019-2031
- 13.1. Market Analysis, Insights and Forecast - by Type
- 13.1.1. Hybrid Electric Vehicle
- 13.1.2. Battery Electric Vehicle
- 13.2. Market Analysis, Insights and Forecast - by Vehicle Type
- 13.2.1. Two Wheeler Taxi
- 13.2.2. Four Wheeler Taxi
- 13.1. Market Analysis, Insights and Forecast - by Type
- 14. China EV Taxi Industry Analysis, Insights and Forecast, 2019-2031
- 14.1. Market Analysis, Insights and Forecast - by Type
- 14.1.1. Hybrid Electric Vehicle
- 14.1.2. Battery Electric Vehicle
- 14.2. Market Analysis, Insights and Forecast - by Vehicle Type
- 14.2.1. Two Wheeler Taxi
- 14.2.2. Four Wheeler Taxi
- 14.1. Market Analysis, Insights and Forecast - by Type
- 15. India EV Taxi Industry Analysis, Insights and Forecast, 2019-2031
- 15.1. Market Analysis, Insights and Forecast - by Type
- 15.1.1. Hybrid Electric Vehicle
- 15.1.2. Battery Electric Vehicle
- 15.2. Market Analysis, Insights and Forecast - by Vehicle Type
- 15.2.1. Two Wheeler Taxi
- 15.2.2. Four Wheeler Taxi
- 15.1. Market Analysis, Insights and Forecast - by Type
- 16. Japan EV Taxi Industry Analysis, Insights and Forecast, 2019-2031
- 16.1. Market Analysis, Insights and Forecast - by Type
- 16.1.1. Hybrid Electric Vehicle
- 16.1.2. Battery Electric Vehicle
- 16.2. Market Analysis, Insights and Forecast - by Vehicle Type
- 16.2.1. Two Wheeler Taxi
- 16.2.2. Four Wheeler Taxi
- 16.1. Market Analysis, Insights and Forecast - by Type
- 17. South Korea EV Taxi Industry Analysis, Insights and Forecast, 2019-2031
- 17.1. Market Analysis, Insights and Forecast - by Type
- 17.1.1. Hybrid Electric Vehicle
- 17.1.2. Battery Electric Vehicle
- 17.2. Market Analysis, Insights and Forecast - by Vehicle Type
- 17.2.1. Two Wheeler Taxi
- 17.2.2. Four Wheeler Taxi
- 17.1. Market Analysis, Insights and Forecast - by Type
- 18. Rest of Asia Pacific EV Taxi Industry Analysis, Insights and Forecast, 2019-2031
- 18.1. Market Analysis, Insights and Forecast - by Type
- 18.1.1. Hybrid Electric Vehicle
- 18.1.2. Battery Electric Vehicle
- 18.2. Market Analysis, Insights and Forecast - by Vehicle Type
- 18.2.1. Two Wheeler Taxi
- 18.2.2. Four Wheeler Taxi
- 18.1. Market Analysis, Insights and Forecast - by Type
- 19. Mexico EV Taxi Industry Analysis, Insights and Forecast, 2019-2031
- 19.1. Market Analysis, Insights and Forecast - by Type
- 19.1.1. Hybrid Electric Vehicle
- 19.1.2. Battery Electric Vehicle
- 19.2. Market Analysis, Insights and Forecast - by Vehicle Type
- 19.2.1. Two Wheeler Taxi
- 19.2.2. Four Wheeler Taxi
- 19.1. Market Analysis, Insights and Forecast - by Type
- 20. Brazil EV Taxi Industry Analysis, Insights and Forecast, 2019-2031
- 20.1. Market Analysis, Insights and Forecast - by Type
- 20.1.1. Hybrid Electric Vehicle
- 20.1.2. Battery Electric Vehicle
- 20.2. Market Analysis, Insights and Forecast - by Vehicle Type
- 20.2.1. Two Wheeler Taxi
- 20.2.2. Four Wheeler Taxi
- 20.1. Market Analysis, Insights and Forecast - by Type
- 21. United Arab Emirates EV Taxi Industry Analysis, Insights and Forecast, 2019-2031
- 21.1. Market Analysis, Insights and Forecast - by Type
- 21.1.1. Hybrid Electric Vehicle
- 21.1.2. Battery Electric Vehicle
- 21.2. Market Analysis, Insights and Forecast - by Vehicle Type
- 21.2.1. Two Wheeler Taxi
- 21.2.2. Four Wheeler Taxi
- 21.1. Market Analysis, Insights and Forecast - by Type
- 22. Other Countries EV Taxi Industry Analysis, Insights and Forecast, 2019-2031
- 22.1. Market Analysis, Insights and Forecast - by Type
- 22.1.1. Hybrid Electric Vehicle
- 22.1.2. Battery Electric Vehicle
- 22.2. Market Analysis, Insights and Forecast - by Vehicle Type
- 22.2.1. Two Wheeler Taxi
- 22.2.2. Four Wheeler Taxi
- 22.1. Market Analysis, Insights and Forecast - by Type
- 23. United States EV Taxi Industry Analysis, Insights and Forecast, 2019-2031
- 23.1. Market Analysis, Insights and Forecast - By Country/Sub-region
- 23.1.1.
- 24. Canada EV Taxi Industry Analysis, Insights and Forecast, 2019-2031
- 24.1. Market Analysis, Insights and Forecast - By Country/Sub-region
- 24.1.1.
- 25. Rest of North America EV Taxi Industry Analysis, Insights and Forecast, 2019-2031
- 25.1. Market Analysis, Insights and Forecast - By Country/Sub-region
- 25.1.1.
- 26. Germany EV Taxi Industry Analysis, Insights and Forecast, 2019-2031
- 26.1. Market Analysis, Insights and Forecast - By Country/Sub-region
- 26.1.1.
- 27. United Kingdom EV Taxi Industry Analysis, Insights and Forecast, 2019-2031
- 27.1. Market Analysis, Insights and Forecast - By Country/Sub-region
- 27.1.1.
- 28. France EV Taxi Industry Analysis, Insights and Forecast, 2019-2031
- 28.1. Market Analysis, Insights and Forecast - By Country/Sub-region
- 28.1.1.
- 29. Italy EV Taxi Industry Analysis, Insights and Forecast, 2019-2031
- 29.1. Market Analysis, Insights and Forecast - By Country/Sub-region
- 29.1.1.
- 30. Rest of Europe EV Taxi Industry Analysis, Insights and Forecast, 2019-2031
- 30.1. Market Analysis, Insights and Forecast - By Country/Sub-region
- 30.1.1.
- 31. China EV Taxi Industry Analysis, Insights and Forecast, 2019-2031
- 31.1. Market Analysis, Insights and Forecast - By Country/Sub-region
- 31.1.1.
- 32. India EV Taxi Industry Analysis, Insights and Forecast, 2019-2031
- 32.1. Market Analysis, Insights and Forecast - By Country/Sub-region
- 32.1.1.
- 33. Japan EV Taxi Industry Analysis, Insights and Forecast, 2019-2031
- 33.1. Market Analysis, Insights and Forecast - By Country/Sub-region
- 33.1.1.
- 34. South Korea EV Taxi Industry Analysis, Insights and Forecast, 2019-2031
- 34.1. Market Analysis, Insights and Forecast - By Country/Sub-region
- 34.1.1.
- 35. Rest of Asia Pacific EV Taxi Industry Analysis, Insights and Forecast, 2019-2031
- 35.1. Market Analysis, Insights and Forecast - By Country/Sub-region
- 35.1.1.
- 36. Mexico EV Taxi Industry Analysis, Insights and Forecast, 2019-2031
- 36.1. Market Analysis, Insights and Forecast - By Country/Sub-region
- 36.1.1.
- 37. Brazil EV Taxi Industry Analysis, Insights and Forecast, 2019-2031
- 37.1. Market Analysis, Insights and Forecast - By Country/Sub-region
- 37.1.1.
- 38. United Arab Emirates EV Taxi Industry Analysis, Insights and Forecast, 2019-2031
- 38.1. Market Analysis, Insights and Forecast - By Country/Sub-region
- 38.1.1.
- 39. Other Countries EV Taxi Industry Analysis, Insights and Forecast, 2019-2031
- 39.1. Market Analysis, Insights and Forecast - By Country/Sub-region
- 39.1.1.
- 40. Competitive Analysis
- 40.1. Global Market Share Analysis 2024
- 40.2. Company Profiles
- 40.2.1 Blu Smart Mobility
- 40.2.1.1. Overview
- 40.2.1.2. Products
- 40.2.1.3. SWOT Analysis
- 40.2.1.4. Recent Developments
- 40.2.1.5. Financials (Based on Availability)
- 40.2.2 Taxi Electric
- 40.2.2.1. Overview
- 40.2.2.2. Products
- 40.2.2.3. SWOT Analysis
- 40.2.2.4. Recent Developments
- 40.2.2.5. Financials (Based on Availability)
- 40.2.3 Say Taxi
- 40.2.3.1. Overview
- 40.2.3.2. Products
- 40.2.3.3. SWOT Analysis
- 40.2.3.4. Recent Developments
- 40.2.3.5. Financials (Based on Availability)
- 40.2.4 Ola Cabs
- 40.2.4.1. Overview
- 40.2.4.2. Products
- 40.2.4.3. SWOT Analysis
- 40.2.4.4. Recent Developments
- 40.2.4.5. Financials (Based on Availability)
- 40.2.5 eee-Taxi
- 40.2.5.1. Overview
- 40.2.5.2. Products
- 40.2.5.3. SWOT Analysis
- 40.2.5.4. Recent Developments
- 40.2.5.5. Financials (Based on Availability)
- 40.2.6 Connexxion
- 40.2.6.1. Overview
- 40.2.6.2. Products
- 40.2.6.3. SWOT Analysis
- 40.2.6.4. Recent Developments
- 40.2.6.5. Financials (Based on Availability)
- 40.2.7 Uber
- 40.2.7.1. Overview
- 40.2.7.2. Products
- 40.2.7.3. SWOT Analysis
- 40.2.7.4. Recent Developments
- 40.2.7.5. Financials (Based on Availability)
- 40.2.8 Prakrit
- 40.2.8.1. Overview
- 40.2.8.2. Products
- 40.2.8.3. SWOT Analysis
- 40.2.8.4. Recent Developments
- 40.2.8.5. Financials (Based on Availability)
- 40.2.1 Blu Smart Mobility
List of Figures
- Figure 1: Global EV Taxi Industry Revenue Breakdown (Million, %) by Region 2024 & 2032
- Figure 2: United States EV Taxi Industry Revenue (Million), by Country 2024 & 2032
- Figure 3: United States EV Taxi Industry Revenue Share (%), by Country 2024 & 2032
- Figure 4: Canada EV Taxi Industry Revenue (Million), by Country 2024 & 2032
- Figure 5: Canada EV Taxi Industry Revenue Share (%), by Country 2024 & 2032
- Figure 6: Rest of North America EV Taxi Industry Revenue (Million), by Country 2024 & 2032
- Figure 7: Rest of North America EV Taxi Industry Revenue Share (%), by Country 2024 & 2032
- Figure 8: Germany EV Taxi Industry Revenue (Million), by Country 2024 & 2032
- Figure 9: Germany EV Taxi Industry Revenue Share (%), by Country 2024 & 2032
- Figure 10: United Kingdom EV Taxi Industry Revenue (Million), by Country 2024 & 2032
- Figure 11: United Kingdom EV Taxi Industry Revenue Share (%), by Country 2024 & 2032
- Figure 12: France EV Taxi Industry Revenue (Million), by Country 2024 & 2032
- Figure 13: France EV Taxi Industry Revenue Share (%), by Country 2024 & 2032
- Figure 14: Italy EV Taxi Industry Revenue (Million), by Country 2024 & 2032
- Figure 15: Italy EV Taxi Industry Revenue Share (%), by Country 2024 & 2032
- Figure 16: Rest of Europe EV Taxi Industry Revenue (Million), by Country 2024 & 2032
- Figure 17: Rest of Europe EV Taxi Industry Revenue Share (%), by Country 2024 & 2032
- Figure 18: China EV Taxi Industry Revenue (Million), by Country 2024 & 2032
- Figure 19: China EV Taxi Industry Revenue Share (%), by Country 2024 & 2032
- Figure 20: India EV Taxi Industry Revenue (Million), by Country 2024 & 2032
- Figure 21: India EV Taxi Industry Revenue Share (%), by Country 2024 & 2032
- Figure 22: Japan EV Taxi Industry Revenue (Million), by Country 2024 & 2032
- Figure 23: Japan EV Taxi Industry Revenue Share (%), by Country 2024 & 2032
- Figure 24: South Korea EV Taxi Industry Revenue (Million), by Country 2024 & 2032
- Figure 25: South Korea EV Taxi Industry Revenue Share (%), by Country 2024 & 2032
- Figure 26: Rest of Asia Pacific EV Taxi Industry Revenue (Million), by Country 2024 & 2032
- Figure 27: Rest of Asia Pacific EV Taxi Industry Revenue Share (%), by Country 2024 & 2032
- Figure 28: Mexico EV Taxi Industry Revenue (Million), by Country 2024 & 2032
- Figure 29: Mexico EV Taxi Industry Revenue Share (%), by Country 2024 & 2032
- Figure 30: Brazil EV Taxi Industry Revenue (Million), by Country 2024 & 2032
- Figure 31: Brazil EV Taxi Industry Revenue Share (%), by Country 2024 & 2032
- Figure 32: United Arab Emirates EV Taxi Industry Revenue (Million), by Country 2024 & 2032
- Figure 33: United Arab Emirates EV Taxi Industry Revenue Share (%), by Country 2024 & 2032
- Figure 34: Other Countries EV Taxi Industry Revenue (Million), by Country 2024 & 2032
- Figure 35: Other Countries EV Taxi Industry Revenue Share (%), by Country 2024 & 2032
- Figure 36: United States EV Taxi Industry Revenue (Million), by Type 2024 & 2032
- Figure 37: United States EV Taxi Industry Revenue Share (%), by Type 2024 & 2032
- Figure 38: United States EV Taxi Industry Revenue (Million), by Vehicle Type 2024 & 2032
- Figure 39: United States EV Taxi Industry Revenue Share (%), by Vehicle Type 2024 & 2032
- Figure 40: United States EV Taxi Industry Revenue (Million), by Country 2024 & 2032
- Figure 41: United States EV Taxi Industry Revenue Share (%), by Country 2024 & 2032
- Figure 42: Canada EV Taxi Industry Revenue (Million), by Type 2024 & 2032
- Figure 43: Canada EV Taxi Industry Revenue Share (%), by Type 2024 & 2032
- Figure 44: Canada EV Taxi Industry Revenue (Million), by Vehicle Type 2024 & 2032
- Figure 45: Canada EV Taxi Industry Revenue Share (%), by Vehicle Type 2024 & 2032
- Figure 46: Canada EV Taxi Industry Revenue (Million), by Country 2024 & 2032
- Figure 47: Canada EV Taxi Industry Revenue Share (%), by Country 2024 & 2032
- Figure 48: Rest of North America EV Taxi Industry Revenue (Million), by Type 2024 & 2032
- Figure 49: Rest of North America EV Taxi Industry Revenue Share (%), by Type 2024 & 2032
- Figure 50: Rest of North America EV Taxi Industry Revenue (Million), by Vehicle Type 2024 & 2032
- Figure 51: Rest of North America EV Taxi Industry Revenue Share (%), by Vehicle Type 2024 & 2032
- Figure 52: Rest of North America EV Taxi Industry Revenue (Million), by Country 2024 & 2032
- Figure 53: Rest of North America EV Taxi Industry Revenue Share (%), by Country 2024 & 2032
- Figure 54: Germany EV Taxi Industry Revenue (Million), by Type 2024 & 2032
- Figure 55: Germany EV Taxi Industry Revenue Share (%), by Type 2024 & 2032
- Figure 56: Germany EV Taxi Industry Revenue (Million), by Vehicle Type 2024 & 2032
- Figure 57: Germany EV Taxi Industry Revenue Share (%), by Vehicle Type 2024 & 2032
- Figure 58: Germany EV Taxi Industry Revenue (Million), by Country 2024 & 2032
- Figure 59: Germany EV Taxi Industry Revenue Share (%), by Country 2024 & 2032
- Figure 60: United Kingdom EV Taxi Industry Revenue (Million), by Type 2024 & 2032
- Figure 61: United Kingdom EV Taxi Industry Revenue Share (%), by Type 2024 & 2032
- Figure 62: United Kingdom EV Taxi Industry Revenue (Million), by Vehicle Type 2024 & 2032
- Figure 63: United Kingdom EV Taxi Industry Revenue Share (%), by Vehicle Type 2024 & 2032
- Figure 64: United Kingdom EV Taxi Industry Revenue (Million), by Country 2024 & 2032
- Figure 65: United Kingdom EV Taxi Industry Revenue Share (%), by Country 2024 & 2032
- Figure 66: France EV Taxi Industry Revenue (Million), by Type 2024 & 2032
- Figure 67: France EV Taxi Industry Revenue Share (%), by Type 2024 & 2032
- Figure 68: France EV Taxi Industry Revenue (Million), by Vehicle Type 2024 & 2032
- Figure 69: France EV Taxi Industry Revenue Share (%), by Vehicle Type 2024 & 2032
- Figure 70: France EV Taxi Industry Revenue (Million), by Country 2024 & 2032
- Figure 71: France EV Taxi Industry Revenue Share (%), by Country 2024 & 2032
- Figure 72: Italy EV Taxi Industry Revenue (Million), by Type 2024 & 2032
- Figure 73: Italy EV Taxi Industry Revenue Share (%), by Type 2024 & 2032
- Figure 74: Italy EV Taxi Industry Revenue (Million), by Vehicle Type 2024 & 2032
- Figure 75: Italy EV Taxi Industry Revenue Share (%), by Vehicle Type 2024 & 2032
- Figure 76: Italy EV Taxi Industry Revenue (Million), by Country 2024 & 2032
- Figure 77: Italy EV Taxi Industry Revenue Share (%), by Country 2024 & 2032
- Figure 78: Rest of Europe EV Taxi Industry Revenue (Million), by Type 2024 & 2032
- Figure 79: Rest of Europe EV Taxi Industry Revenue Share (%), by Type 2024 & 2032
- Figure 80: Rest of Europe EV Taxi Industry Revenue (Million), by Vehicle Type 2024 & 2032
- Figure 81: Rest of Europe EV Taxi Industry Revenue Share (%), by Vehicle Type 2024 & 2032
- Figure 82: Rest of Europe EV Taxi Industry Revenue (Million), by Country 2024 & 2032
- Figure 83: Rest of Europe EV Taxi Industry Revenue Share (%), by Country 2024 & 2032
- Figure 84: China EV Taxi Industry Revenue (Million), by Type 2024 & 2032
- Figure 85: China EV Taxi Industry Revenue Share (%), by Type 2024 & 2032
- Figure 86: China EV Taxi Industry Revenue (Million), by Vehicle Type 2024 & 2032
- Figure 87: China EV Taxi Industry Revenue Share (%), by Vehicle Type 2024 & 2032
- Figure 88: China EV Taxi Industry Revenue (Million), by Country 2024 & 2032
- Figure 89: China EV Taxi Industry Revenue Share (%), by Country 2024 & 2032
- Figure 90: India EV Taxi Industry Revenue (Million), by Type 2024 & 2032
- Figure 91: India EV Taxi Industry Revenue Share (%), by Type 2024 & 2032
- Figure 92: India EV Taxi Industry Revenue (Million), by Vehicle Type 2024 & 2032
- Figure 93: India EV Taxi Industry Revenue Share (%), by Vehicle Type 2024 & 2032
- Figure 94: India EV Taxi Industry Revenue (Million), by Country 2024 & 2032
- Figure 95: India EV Taxi Industry Revenue Share (%), by Country 2024 & 2032
- Figure 96: Japan EV Taxi Industry Revenue (Million), by Type 2024 & 2032
- Figure 97: Japan EV Taxi Industry Revenue Share (%), by Type 2024 & 2032
- Figure 98: Japan EV Taxi Industry Revenue (Million), by Vehicle Type 2024 & 2032
- Figure 99: Japan EV Taxi Industry Revenue Share (%), by Vehicle Type 2024 & 2032
- Figure 100: Japan EV Taxi Industry Revenue (Million), by Country 2024 & 2032
- Figure 101: Japan EV Taxi Industry Revenue Share (%), by Country 2024 & 2032
- Figure 102: South Korea EV Taxi Industry Revenue (Million), by Type 2024 & 2032
- Figure 103: South Korea EV Taxi Industry Revenue Share (%), by Type 2024 & 2032
- Figure 104: South Korea EV Taxi Industry Revenue (Million), by Vehicle Type 2024 & 2032
- Figure 105: South Korea EV Taxi Industry Revenue Share (%), by Vehicle Type 2024 & 2032
- Figure 106: South Korea EV Taxi Industry Revenue (Million), by Country 2024 & 2032
- Figure 107: South Korea EV Taxi Industry Revenue Share (%), by Country 2024 & 2032
- Figure 108: Rest of Asia Pacific EV Taxi Industry Revenue (Million), by Type 2024 & 2032
- Figure 109: Rest of Asia Pacific EV Taxi Industry Revenue Share (%), by Type 2024 & 2032
- Figure 110: Rest of Asia Pacific EV Taxi Industry Revenue (Million), by Vehicle Type 2024 & 2032
- Figure 111: Rest of Asia Pacific EV Taxi Industry Revenue Share (%), by Vehicle Type 2024 & 2032
- Figure 112: Rest of Asia Pacific EV Taxi Industry Revenue (Million), by Country 2024 & 2032
- Figure 113: Rest of Asia Pacific EV Taxi Industry Revenue Share (%), by Country 2024 & 2032
- Figure 114: Mexico EV Taxi Industry Revenue (Million), by Type 2024 & 2032
- Figure 115: Mexico EV Taxi Industry Revenue Share (%), by Type 2024 & 2032
- Figure 116: Mexico EV Taxi Industry Revenue (Million), by Vehicle Type 2024 & 2032
- Figure 117: Mexico EV Taxi Industry Revenue Share (%), by Vehicle Type 2024 & 2032
- Figure 118: Mexico EV Taxi Industry Revenue (Million), by Country 2024 & 2032
- Figure 119: Mexico EV Taxi Industry Revenue Share (%), by Country 2024 & 2032
- Figure 120: Brazil EV Taxi Industry Revenue (Million), by Type 2024 & 2032
- Figure 121: Brazil EV Taxi Industry Revenue Share (%), by Type 2024 & 2032
- Figure 122: Brazil EV Taxi Industry Revenue (Million), by Vehicle Type 2024 & 2032
- Figure 123: Brazil EV Taxi Industry Revenue Share (%), by Vehicle Type 2024 & 2032
- Figure 124: Brazil EV Taxi Industry Revenue (Million), by Country 2024 & 2032
- Figure 125: Brazil EV Taxi Industry Revenue Share (%), by Country 2024 & 2032
- Figure 126: United Arab Emirates EV Taxi Industry Revenue (Million), by Type 2024 & 2032
- Figure 127: United Arab Emirates EV Taxi Industry Revenue Share (%), by Type 2024 & 2032
- Figure 128: United Arab Emirates EV Taxi Industry Revenue (Million), by Vehicle Type 2024 & 2032
- Figure 129: United Arab Emirates EV Taxi Industry Revenue Share (%), by Vehicle Type 2024 & 2032
- Figure 130: United Arab Emirates EV Taxi Industry Revenue (Million), by Country 2024 & 2032
- Figure 131: United Arab Emirates EV Taxi Industry Revenue Share (%), by Country 2024 & 2032
- Figure 132: Other Countries EV Taxi Industry Revenue (Million), by Type 2024 & 2032
- Figure 133: Other Countries EV Taxi Industry Revenue Share (%), by Type 2024 & 2032
- Figure 134: Other Countries EV Taxi Industry Revenue (Million), by Vehicle Type 2024 & 2032
- Figure 135: Other Countries EV Taxi Industry Revenue Share (%), by Vehicle Type 2024 & 2032
- Figure 136: Other Countries EV Taxi Industry Revenue (Million), by Country 2024 & 2032
- Figure 137: Other Countries EV Taxi Industry Revenue Share (%), by Country 2024 & 2032
List of Tables
- Table 1: Global EV Taxi Industry Revenue Million Forecast, by Region 2019 & 2032
- Table 2: Global EV Taxi Industry Revenue Million Forecast, by Type 2019 & 2032
- Table 3: Global EV Taxi Industry Revenue Million Forecast, by Vehicle Type 2019 & 2032
- Table 4: Global EV Taxi Industry Revenue Million Forecast, by Region 2019 & 2032
- Table 5: Global EV Taxi Industry Revenue Million Forecast, by Country 2019 & 2032
- Table 6: EV Taxi Industry Revenue (Million) Forecast, by Application 2019 & 2032
- Table 7: Global EV Taxi Industry Revenue Million Forecast, by Country 2019 & 2032
- Table 8: EV Taxi Industry Revenue (Million) Forecast, by Application 2019 & 2032
- Table 9: Global EV Taxi Industry Revenue Million Forecast, by Country 2019 & 2032
- Table 10: EV Taxi Industry Revenue (Million) Forecast, by Application 2019 & 2032
- Table 11: Global EV Taxi Industry Revenue Million Forecast, by Country 2019 & 2032
- Table 12: EV Taxi Industry Revenue (Million) Forecast, by Application 2019 & 2032
- Table 13: Global EV Taxi Industry Revenue Million Forecast, by Country 2019 & 2032
- Table 14: EV Taxi Industry Revenue (Million) Forecast, by Application 2019 & 2032
- Table 15: Global EV Taxi Industry Revenue Million Forecast, by Country 2019 & 2032
- Table 16: EV Taxi Industry Revenue (Million) Forecast, by Application 2019 & 2032
- Table 17: Global EV Taxi Industry Revenue Million Forecast, by Country 2019 & 2032
- Table 18: EV Taxi Industry Revenue (Million) Forecast, by Application 2019 & 2032
- Table 19: Global EV Taxi Industry Revenue Million Forecast, by Country 2019 & 2032
- Table 20: EV Taxi Industry Revenue (Million) Forecast, by Application 2019 & 2032
- Table 21: Global EV Taxi Industry Revenue Million Forecast, by Country 2019 & 2032
- Table 22: EV Taxi Industry Revenue (Million) Forecast, by Application 2019 & 2032
- Table 23: Global EV Taxi Industry Revenue Million Forecast, by Country 2019 & 2032
- Table 24: EV Taxi Industry Revenue (Million) Forecast, by Application 2019 & 2032
- Table 25: Global EV Taxi Industry Revenue Million Forecast, by Country 2019 & 2032
- Table 26: EV Taxi Industry Revenue (Million) Forecast, by Application 2019 & 2032
- Table 27: Global EV Taxi Industry Revenue Million Forecast, by Country 2019 & 2032
- Table 28: EV Taxi Industry Revenue (Million) Forecast, by Application 2019 & 2032
- Table 29: Global EV Taxi Industry Revenue Million Forecast, by Country 2019 & 2032
- Table 30: EV Taxi Industry Revenue (Million) Forecast, by Application 2019 & 2032
- Table 31: Global EV Taxi Industry Revenue Million Forecast, by Country 2019 & 2032
- Table 32: EV Taxi Industry Revenue (Million) Forecast, by Application 2019 & 2032
- Table 33: Global EV Taxi Industry Revenue Million Forecast, by Country 2019 & 2032
- Table 34: EV Taxi Industry Revenue (Million) Forecast, by Application 2019 & 2032
- Table 35: Global EV Taxi Industry Revenue Million Forecast, by Country 2019 & 2032
- Table 36: EV Taxi Industry Revenue (Million) Forecast, by Application 2019 & 2032
- Table 37: Global EV Taxi Industry Revenue Million Forecast, by Country 2019 & 2032
- Table 38: EV Taxi Industry Revenue (Million) Forecast, by Application 2019 & 2032
- Table 39: Global EV Taxi Industry Revenue Million Forecast, by Type 2019 & 2032
- Table 40: Global EV Taxi Industry Revenue Million Forecast, by Vehicle Type 2019 & 2032
- Table 41: Global EV Taxi Industry Revenue Million Forecast, by Country 2019 & 2032
- Table 42: Global EV Taxi Industry Revenue Million Forecast, by Type 2019 & 2032
- Table 43: Global EV Taxi Industry Revenue Million Forecast, by Vehicle Type 2019 & 2032
- Table 44: Global EV Taxi Industry Revenue Million Forecast, by Country 2019 & 2032
- Table 45: Global EV Taxi Industry Revenue Million Forecast, by Type 2019 & 2032
- Table 46: Global EV Taxi Industry Revenue Million Forecast, by Vehicle Type 2019 & 2032
- Table 47: Global EV Taxi Industry Revenue Million Forecast, by Country 2019 & 2032
- Table 48: Global EV Taxi Industry Revenue Million Forecast, by Type 2019 & 2032
- Table 49: Global EV Taxi Industry Revenue Million Forecast, by Vehicle Type 2019 & 2032
- Table 50: Global EV Taxi Industry Revenue Million Forecast, by Country 2019 & 2032
- Table 51: Global EV Taxi Industry Revenue Million Forecast, by Type 2019 & 2032
- Table 52: Global EV Taxi Industry Revenue Million Forecast, by Vehicle Type 2019 & 2032
- Table 53: Global EV Taxi Industry Revenue Million Forecast, by Country 2019 & 2032
- Table 54: Global EV Taxi Industry Revenue Million Forecast, by Type 2019 & 2032
- Table 55: Global EV Taxi Industry Revenue Million Forecast, by Vehicle Type 2019 & 2032
- Table 56: Global EV Taxi Industry Revenue Million Forecast, by Country 2019 & 2032
- Table 57: Global EV Taxi Industry Revenue Million Forecast, by Type 2019 & 2032
- Table 58: Global EV Taxi Industry Revenue Million Forecast, by Vehicle Type 2019 & 2032
- Table 59: Global EV Taxi Industry Revenue Million Forecast, by Country 2019 & 2032
- Table 60: Global EV Taxi Industry Revenue Million Forecast, by Type 2019 & 2032
- Table 61: Global EV Taxi Industry Revenue Million Forecast, by Vehicle Type 2019 & 2032
- Table 62: Global EV Taxi Industry Revenue Million Forecast, by Country 2019 & 2032
- Table 63: Global EV Taxi Industry Revenue Million Forecast, by Type 2019 & 2032
- Table 64: Global EV Taxi Industry Revenue Million Forecast, by Vehicle Type 2019 & 2032
- Table 65: Global EV Taxi Industry Revenue Million Forecast, by Country 2019 & 2032
- Table 66: Global EV Taxi Industry Revenue Million Forecast, by Type 2019 & 2032
- Table 67: Global EV Taxi Industry Revenue Million Forecast, by Vehicle Type 2019 & 2032
- Table 68: Global EV Taxi Industry Revenue Million Forecast, by Country 2019 & 2032
- Table 69: Global EV Taxi Industry Revenue Million Forecast, by Type 2019 & 2032
- Table 70: Global EV Taxi Industry Revenue Million Forecast, by Vehicle Type 2019 & 2032
- Table 71: Global EV Taxi Industry Revenue Million Forecast, by Country 2019 & 2032
- Table 72: Global EV Taxi Industry Revenue Million Forecast, by Type 2019 & 2032
- Table 73: Global EV Taxi Industry Revenue Million Forecast, by Vehicle Type 2019 & 2032
- Table 74: Global EV Taxi Industry Revenue Million Forecast, by Country 2019 & 2032
- Table 75: Global EV Taxi Industry Revenue Million Forecast, by Type 2019 & 2032
- Table 76: Global EV Taxi Industry Revenue Million Forecast, by Vehicle Type 2019 & 2032
- Table 77: Global EV Taxi Industry Revenue Million Forecast, by Country 2019 & 2032
- Table 78: Global EV Taxi Industry Revenue Million Forecast, by Type 2019 & 2032
- Table 79: Global EV Taxi Industry Revenue Million Forecast, by Vehicle Type 2019 & 2032
- Table 80: Global EV Taxi Industry Revenue Million Forecast, by Country 2019 & 2032
- Table 81: Global EV Taxi Industry Revenue Million Forecast, by Type 2019 & 2032
- Table 82: Global EV Taxi Industry Revenue Million Forecast, by Vehicle Type 2019 & 2032
- Table 83: Global EV Taxi Industry Revenue Million Forecast, by Country 2019 & 2032
- Table 84: Global EV Taxi Industry Revenue Million Forecast, by Type 2019 & 2032
- Table 85: Global EV Taxi Industry Revenue Million Forecast, by Vehicle Type 2019 & 2032
- Table 86: Global EV Taxi Industry Revenue Million Forecast, by Country 2019 & 2032
- Table 87: Global EV Taxi Industry Revenue Million Forecast, by Type 2019 & 2032
- Table 88: Global EV Taxi Industry Revenue Million Forecast, by Vehicle Type 2019 & 2032
- Table 89: Global EV Taxi Industry Revenue Million Forecast, by Country 2019 & 2032
Frequently Asked Questions
1. What is the projected Compound Annual Growth Rate (CAGR) of the EV Taxi Industry?
The projected CAGR is approximately > 12.00%.
2. Which companies are prominent players in the EV Taxi Industry?
Key companies in the market include Blu Smart Mobility, Taxi Electric, Say Taxi, Ola Cabs, eee-Taxi, Connexxion, Uber, Prakrit.
3. What are the main segments of the EV Taxi Industry?
The market segments include Type, Vehicle Type.
4. Can you provide details about the market size?
The market size is estimated to be USD XX Million as of 2022.
5. What are some drivers contributing to market growth?
Government Policies to promote electric Vehicles Sales.
6. What are the notable trends driving market growth?
Government Initiatives and Investment is Boosting the Demand.
7. Are there any restraints impacting market growth?
High Cost of Capital Expenditure for Electric Vehicle Infrastructure.
8. Can you provide examples of recent developments in the market?
N/A
9. What pricing options are available for accessing the report?
Pricing options include single-user, multi-user, and enterprise licenses priced at USD 4750, USD 5250, and USD 8750 respectively.
10. Is the market size provided in terms of value or volume?
The market size is provided in terms of value, measured in Million.
11. Are there any specific market keywords associated with the report?
Yes, the market keyword associated with the report is "EV Taxi Industry," which aids in identifying and referencing the specific market segment covered.
12. How do I determine which pricing option suits my needs best?
The pricing options vary based on user requirements and access needs. Individual users may opt for single-user licenses, while businesses requiring broader access may choose multi-user or enterprise licenses for cost-effective access to the report.
13. Are there any additional resources or data provided in the EV Taxi Industry report?
While the report offers comprehensive insights, it's advisable to review the specific contents or supplementary materials provided to ascertain if additional resources or data are available.
14. How can I stay updated on further developments or reports in the EV Taxi Industry?
To stay informed about further developments, trends, and reports in the EV Taxi Industry, consider subscribing to industry newsletters, following relevant companies and organizations, or regularly checking reputable industry news sources and publications.
Methodology
Step 1 - Identification of Relevant Samples Size from Population Database


Step 2 - Approaches for Defining Global Market Size (Value, Volume* & Price*)

Note*: In applicable scenarios
Step 3 - Data Sources
Primary Research
- Web Analytics
- Survey Reports
- Research Institute
- Latest Research Reports
- Opinion Leaders
Secondary Research
- Annual Reports
- White Paper
- Latest Press Release
- Industry Association
- Paid Database
- Investor Presentations

Step 4 - Data Triangulation
Involves using different sources of information in order to increase the validity of a study
These sources are likely to be stakeholders in a program - participants, other researchers, program staff, other community members, and so on.
Then we put all data in single framework & apply various statistical tools to find out the dynamic on the market.
During the analysis stage, feedback from the stakeholder groups would be compared to determine areas of agreement as well as areas of divergence
