

Key Insights
The global fortified flour market is experiencing robust growth, driven by increasing consumer awareness of nutritional deficiencies and the rising demand for convenient, nutritious food products. The market's expansion is fueled by several key factors, including government initiatives promoting nutritional fortification, the growing prevalence of lifestyle diseases linked to micronutrient deficiencies, and the increasing adoption of fortified flour in various food applications, ranging from bread and bakery products to pasta and noodles. Major players like ITC, Hindustan Unilever, and Cargill are actively investing in research and development to enhance the nutritional value and palatability of fortified flour, leading to product innovation and diversification. While challenges remain, such as the higher cost of fortified flour compared to conventional flour and inconsistent regulatory frameworks across different regions, these are being addressed through technological advancements and policy interventions. The market's segmentation reflects diverse consumer preferences and specific nutritional needs, with different types of fortification (e.g., iron, folic acid, vitamin B12) catering to various demographics and health concerns.
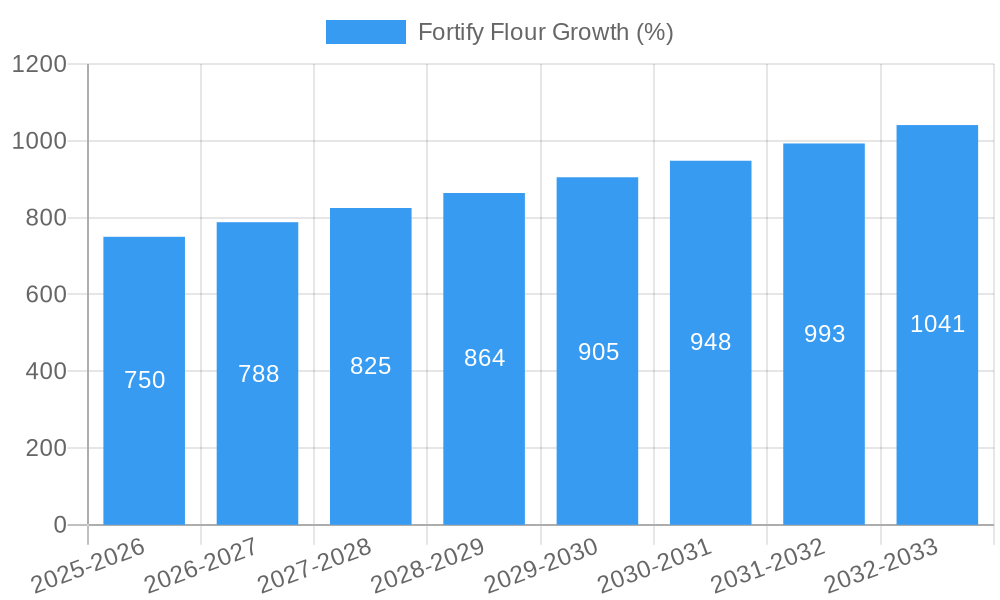
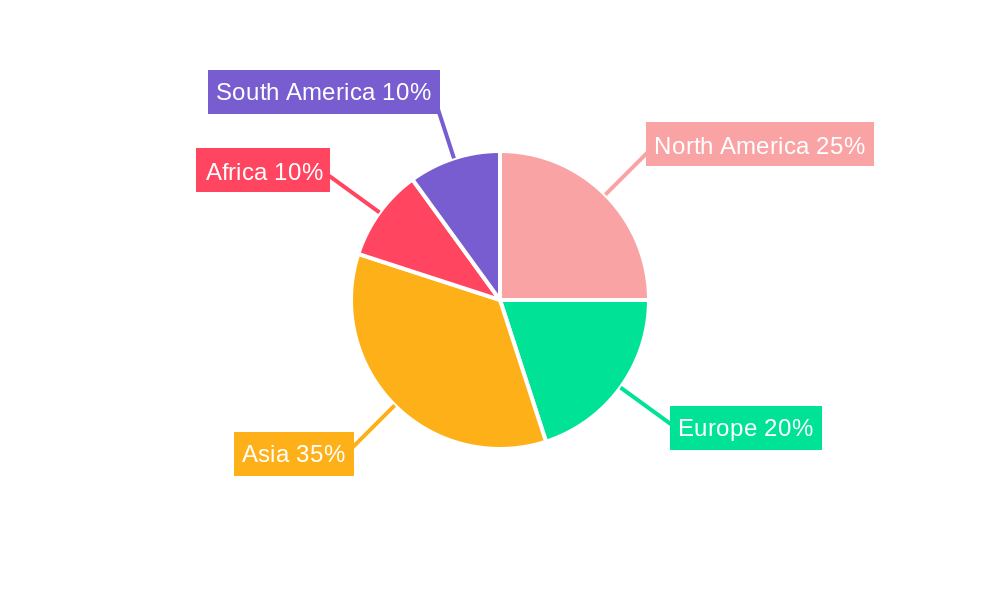
Looking ahead, the market is poised for continued expansion, with a projected Compound Annual Growth Rate (CAGR) likely exceeding 5% over the forecast period (2025-2033). This sustained growth will be underpinned by increasing urbanization, changing dietary habits, rising disposable incomes in developing economies, and a growing focus on preventive healthcare. The geographical distribution of the market will likely see considerable regional variation, with emerging markets in Asia and Africa exhibiting faster growth rates compared to mature markets in North America and Europe. However, maintaining consistent quality control, ensuring affordability, and addressing supply chain challenges will be crucial factors influencing the market's trajectory in the coming years. Strategic partnerships between food manufacturers, government agencies, and NGOs will play a key role in driving wider adoption and accessibility of fortified flour globally.
Fortify Flour Market Report: 2019-2033 - A Comprehensive Analysis
This comprehensive report provides a deep dive into the Fortify Flour market, offering invaluable insights for industry professionals, investors, and strategic decision-makers. Covering the period 2019-2033, with a focus on 2025, this report analyzes market dynamics, growth trends, regional dominance, product landscape, and key players, providing a complete understanding of this rapidly evolving market segment. The report leverages extensive primary and secondary research, delivering a robust forecast to 2033. Parent market (Flour Market) and child market (Fortified Flour segment within the Flour market) dynamics are thoroughly considered for a holistic view.
Fortify Flour Market Dynamics & Structure
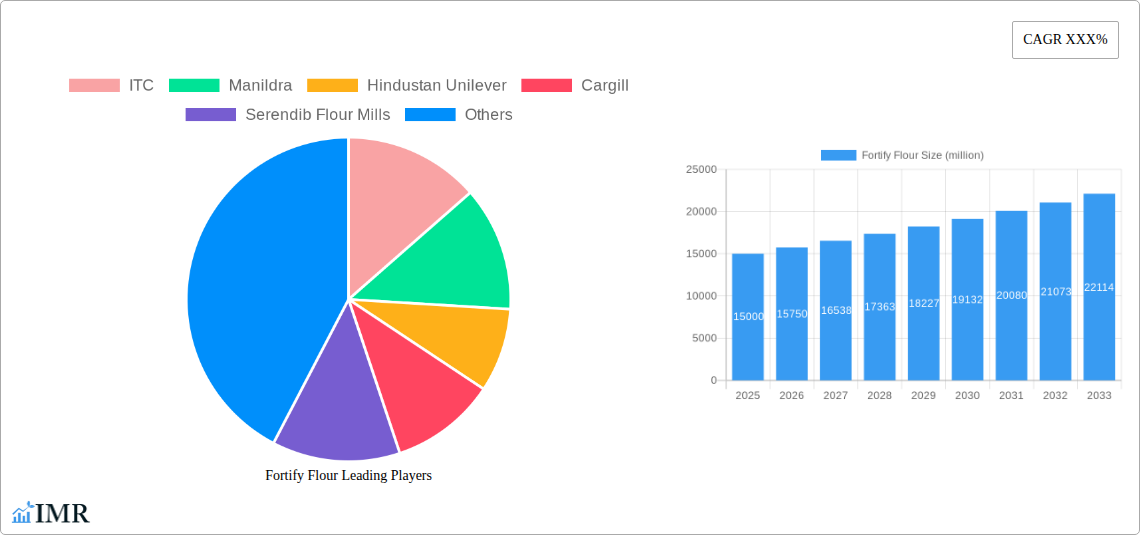
The Fortify Flour market, a significant segment within the broader $xx billion flour market, exhibits a moderately concentrated structure. Key players like ITC, Manildra, Hindustan Unilever, Cargill, and General Mills hold significant market share, though smaller regional players and emerging brands are increasingly challenging the established order. Technological innovation, driven by advancements in fortification technologies and consumer demand for enhanced nutritional value, is a key market driver. Stringent regulatory frameworks governing food fortification standards influence product development and market access, while the rise of health-conscious consumers and increasing awareness of micronutrient deficiencies fuels growth. Competitive substitutes like fortified cereals and nutritional supplements exert pressure, while M&A activity remains relatively low, with only xx major deals recorded between 2019 and 2024.
- Market Concentration: Oligopolistic, with top 5 players holding approximately 60% market share in 2024.
- Technological Innovation: Focus on cost-effective fortification methods, improved nutrient stability, and novel fortification blends.
- Regulatory Landscape: Stringent regulations on fortification levels and labeling requirements vary across regions.
- Competitive Substitutes: Fortified cereals, nutritional supplements, and other functional foods compete for consumer preference.
- M&A Activity: Relatively low, with an average of xx deals annually during the historical period.
- End-user Demographics: Growing demand driven by rising health consciousness, particularly among millennials and Gen Z.
Fortify Flour Growth Trends & Insights
The Fortify Flour market experienced a CAGR of xx% during the historical period (2019-2024), reaching a market size of $xx billion in 2024. The estimated market size for 2025 is $xx billion. This growth trajectory is fueled by increasing consumer awareness regarding nutritional deficiencies, coupled with the rising adoption of fortified flour in various food applications. Technological advancements, such as improved fortification techniques and the development of more stable nutrient blends, further boost market expansion. Changing consumer preferences towards healthier and functional foods are significant growth catalysts. The forecast period (2025-2033) projects continued growth, driven by increasing health consciousness, expanding product applications, and favorable government regulations. Market penetration is expected to increase from xx% in 2024 to xx% in 2033.
Dominant Regions, Countries, or Segments in Fortify Flour
The Asia-Pacific region dominates the global Fortify Flour market, accounting for approximately xx% of the total market share in 2024. This dominance is primarily attributed to a large and growing population, rising disposable incomes, increasing health awareness, and government initiatives promoting nutritional security. India and China are the key growth drivers within this region. Europe follows as a significant market, driven by strong consumer demand for functional foods and established regulatory frameworks.
- Key Drivers in Asia-Pacific:
- Large and growing population with rising disposable incomes.
- Increasing awareness of micronutrient deficiencies.
- Government initiatives promoting nutritional security.
- Expanding food processing and manufacturing sector.
- Dominance Factors: High population density, rising health concerns, favorable government policies, and robust food processing infrastructure.
- Growth Potential: Continued expansion due to increasing urbanization and evolving consumer preferences.
Fortify Flour Product Landscape
The Fortify Flour market offers a diverse range of products, including wheat flour fortified with iron, folic acid, zinc, and other essential vitamins and minerals. Innovations focus on developing blends that enhance nutrient bioavailability and stability, addressing challenges like taste and texture alterations. Unique selling propositions include extended shelf life, improved nutritional profiles, and tailored fortification to address specific dietary needs. Technological advancements in microencapsulation and nanotechnology enable enhanced nutrient delivery and improved product quality.
Key Drivers, Barriers & Challenges in Fortify Flour
Key Drivers:
- Growing awareness of nutritional deficiencies, particularly among vulnerable populations.
- Increasing demand for functional foods and healthier dietary options.
- Government regulations and initiatives supporting food fortification.
- Technological advancements leading to improved fortification methods and cost reductions.
Challenges & Restraints:
- High initial investment costs for fortification technologies.
- Potential challenges in maintaining nutrient stability during processing and storage.
- Consumer concerns regarding taste and texture changes in fortified products.
- Competition from substitute products and the need for effective marketing strategies to communicate the benefits of fortified flour. This results in xx% of market growth loss annually.
Emerging Opportunities in Fortify Flour
Emerging opportunities lie in untapped markets, especially in developing economies with high prevalence of malnutrition. Innovation in developing novel fortification blends, tailored to specific dietary needs (e.g., gluten-free, organic), offers considerable potential. Growing demand for convenient and ready-to-eat foods presents an opportunity to integrate fortified flour in diverse food applications. Expanding into specialized dietary segments, such as sports nutrition and functional foods, also represents a lucrative opportunity.
Growth Accelerators in the Fortify Flour Industry
Technological breakthroughs in fortification methods, particularly microencapsulation and nano-encapsulation, will significantly drive market growth. Strategic partnerships between flour mills, fortification technology providers, and food manufacturers will enhance product development and market penetration. Government initiatives promoting food fortification and public health campaigns to raise consumer awareness will accelerate market adoption. Expanding into new markets and applications will further propel market expansion.
Key Players Shaping the Fortify Flour Market
- ITC
- Manildra
- Hindustan Unilever
- Cargill
- Serendib Flour Mills
- United Millers
- BASF
- Pristine
- General Mills
- Patanjali
- Celrich Products
Notable Milestones in Fortify Flour Sector
- 2020: Introduction of a new iron-fortified flour blend by ITC, enhancing bioavailability.
- 2021: Government regulations mandating fortification of wheat flour in several Asian countries.
- 2022: Launch of a novel zinc-fortified flour blend by Cargill, addressing zinc deficiency.
- 2023: Partnership between BASF and a major flour mill to introduce a new fortification technology.
In-Depth Fortify Flour Market Outlook
The Fortify Flour market is poised for significant growth over the forecast period (2025-2033), driven by the confluence of rising health consciousness, technological advancements, and supportive government policies. Strategic investments in research and development, coupled with effective marketing and distribution strategies, will be crucial for sustained market success. Expanding into new geographical markets and developing innovative product offerings will create significant opportunities for market expansion and profitability. The market is expected to reach $xx billion by 2033, representing a substantial growth opportunity for players in the industry.
Fortify Flour Segmentation
-
1. Application
- 1.1. Baked goods
- 1.2. Snacks
- 1.3. Desserts
- 1.4. Others
-
2. Type
- 2.1. Vitamins (vitamin A, vitamin B, vitamin B2, niacin)
- 2.2. Minerals (calcium, iron, magnesium, zinc)
Fortify Flour Segmentation By Geography
-
1. North America
- 1.1. United States
- 1.2. Canada
- 1.3. Mexico
-
2. South America
- 2.1. Brazil
- 2.2. Argentina
- 2.3. Rest of South America
-
3. Europe
- 3.1. United Kingdom
- 3.2. Germany
- 3.3. France
- 3.4. Italy
- 3.5. Spain
- 3.6. Russia
- 3.7. Benelux
- 3.8. Nordics
- 3.9. Rest of Europe
-
4. Middle East & Africa
- 4.1. Turkey
- 4.2. Israel
- 4.3. GCC
- 4.4. North Africa
- 4.5. South Africa
- 4.6. Rest of Middle East & Africa
-
5. Asia Pacific
- 5.1. China
- 5.2. India
- 5.3. Japan
- 5.4. South Korea
- 5.5. ASEAN
- 5.6. Oceania
- 5.7. Rest of Asia Pacific
Fortify Flour REPORT HIGHLIGHTS
| Aspects | Details |
|---|---|
| Study Period | 2019-2033 |
| Base Year | 2024 |
| Estimated Year | 2025 |
| Forecast Period | 2025-2033 |
| Historical Period | 2019-2024 |
| Growth Rate | CAGR of XXX% from 2019-2033 |
| Segmentation |
|
Table of Contents
- 1. Introduction
- 1.1. Research Scope
- 1.2. Market Segmentation
- 1.3. Research Methodology
- 1.4. Definitions and Assumptions
- 2. Executive Summary
- 2.1. Introduction
- 3. Market Dynamics
- 3.1. Introduction
- 3.2. Market Drivers
- 3.3. Market Restrains
- 3.4. Market Trends
- 4. Market Factor Analysis
- 4.1. Porters Five Forces
- 4.2. Supply/Value Chain
- 4.3. PESTEL analysis
- 4.4. Market Entropy
- 4.5. Patent/Trademark Analysis
- 5. Global Fortify Flour Analysis, Insights and Forecast, 2019-2031
- 5.1. Market Analysis, Insights and Forecast - by Application
- 5.1.1. Baked goods
- 5.1.2. Snacks
- 5.1.3. Desserts
- 5.1.4. Others
- 5.2. Market Analysis, Insights and Forecast - by Type
- 5.2.1. Vitamins (vitamin A, vitamin B, vitamin B2, niacin)
- 5.2.2. Minerals (calcium, iron, magnesium, zinc)
- 5.3. Market Analysis, Insights and Forecast - by Region
- 5.3.1. North America
- 5.3.2. South America
- 5.3.3. Europe
- 5.3.4. Middle East & Africa
- 5.3.5. Asia Pacific
- 5.1. Market Analysis, Insights and Forecast - by Application
- 6. North America Fortify Flour Analysis, Insights and Forecast, 2019-2031
- 6.1. Market Analysis, Insights and Forecast - by Application
- 6.1.1. Baked goods
- 6.1.2. Snacks
- 6.1.3. Desserts
- 6.1.4. Others
- 6.2. Market Analysis, Insights and Forecast - by Type
- 6.2.1. Vitamins (vitamin A, vitamin B, vitamin B2, niacin)
- 6.2.2. Minerals (calcium, iron, magnesium, zinc)
- 6.1. Market Analysis, Insights and Forecast - by Application
- 7. South America Fortify Flour Analysis, Insights and Forecast, 2019-2031
- 7.1. Market Analysis, Insights and Forecast - by Application
- 7.1.1. Baked goods
- 7.1.2. Snacks
- 7.1.3. Desserts
- 7.1.4. Others
- 7.2. Market Analysis, Insights and Forecast - by Type
- 7.2.1. Vitamins (vitamin A, vitamin B, vitamin B2, niacin)
- 7.2.2. Minerals (calcium, iron, magnesium, zinc)
- 7.1. Market Analysis, Insights and Forecast - by Application
- 8. Europe Fortify Flour Analysis, Insights and Forecast, 2019-2031
- 8.1. Market Analysis, Insights and Forecast - by Application
- 8.1.1. Baked goods
- 8.1.2. Snacks
- 8.1.3. Desserts
- 8.1.4. Others
- 8.2. Market Analysis, Insights and Forecast - by Type
- 8.2.1. Vitamins (vitamin A, vitamin B, vitamin B2, niacin)
- 8.2.2. Minerals (calcium, iron, magnesium, zinc)
- 8.1. Market Analysis, Insights and Forecast - by Application
- 9. Middle East & Africa Fortify Flour Analysis, Insights and Forecast, 2019-2031
- 9.1. Market Analysis, Insights and Forecast - by Application
- 9.1.1. Baked goods
- 9.1.2. Snacks
- 9.1.3. Desserts
- 9.1.4. Others
- 9.2. Market Analysis, Insights and Forecast - by Type
- 9.2.1. Vitamins (vitamin A, vitamin B, vitamin B2, niacin)
- 9.2.2. Minerals (calcium, iron, magnesium, zinc)
- 9.1. Market Analysis, Insights and Forecast - by Application
- 10. Asia Pacific Fortify Flour Analysis, Insights and Forecast, 2019-2031
- 10.1. Market Analysis, Insights and Forecast - by Application
- 10.1.1. Baked goods
- 10.1.2. Snacks
- 10.1.3. Desserts
- 10.1.4. Others
- 10.2. Market Analysis, Insights and Forecast - by Type
- 10.2.1. Vitamins (vitamin A, vitamin B, vitamin B2, niacin)
- 10.2.2. Minerals (calcium, iron, magnesium, zinc)
- 10.1. Market Analysis, Insights and Forecast - by Application
- 11. Competitive Analysis
- 11.1. Global Market Share Analysis 2024
- 11.2. Company Profiles
- 11.2.1 ITC
- 11.2.1.1. Overview
- 11.2.1.2. Products
- 11.2.1.3. SWOT Analysis
- 11.2.1.4. Recent Developments
- 11.2.1.5. Financials (Based on Availability)
- 11.2.2 Manildra
- 11.2.2.1. Overview
- 11.2.2.2. Products
- 11.2.2.3. SWOT Analysis
- 11.2.2.4. Recent Developments
- 11.2.2.5. Financials (Based on Availability)
- 11.2.3 Hindustan Unilever
- 11.2.3.1. Overview
- 11.2.3.2. Products
- 11.2.3.3. SWOT Analysis
- 11.2.3.4. Recent Developments
- 11.2.3.5. Financials (Based on Availability)
- 11.2.4 Cargill
- 11.2.4.1. Overview
- 11.2.4.2. Products
- 11.2.4.3. SWOT Analysis
- 11.2.4.4. Recent Developments
- 11.2.4.5. Financials (Based on Availability)
- 11.2.5 Serendib Flour Mills
- 11.2.5.1. Overview
- 11.2.5.2. Products
- 11.2.5.3. SWOT Analysis
- 11.2.5.4. Recent Developments
- 11.2.5.5. Financials (Based on Availability)
- 11.2.6 United Millers
- 11.2.6.1. Overview
- 11.2.6.2. Products
- 11.2.6.3. SWOT Analysis
- 11.2.6.4. Recent Developments
- 11.2.6.5. Financials (Based on Availability)
- 11.2.7 BASF
- 11.2.7.1. Overview
- 11.2.7.2. Products
- 11.2.7.3. SWOT Analysis
- 11.2.7.4. Recent Developments
- 11.2.7.5. Financials (Based on Availability)
- 11.2.8 Pristine
- 11.2.8.1. Overview
- 11.2.8.2. Products
- 11.2.8.3. SWOT Analysis
- 11.2.8.4. Recent Developments
- 11.2.8.5. Financials (Based on Availability)
- 11.2.9 General Mills
- 11.2.9.1. Overview
- 11.2.9.2. Products
- 11.2.9.3. SWOT Analysis
- 11.2.9.4. Recent Developments
- 11.2.9.5. Financials (Based on Availability)
- 11.2.10 Patanjali
- 11.2.10.1. Overview
- 11.2.10.2. Products
- 11.2.10.3. SWOT Analysis
- 11.2.10.4. Recent Developments
- 11.2.10.5. Financials (Based on Availability)
- 11.2.11 Celrich Products
- 11.2.11.1. Overview
- 11.2.11.2. Products
- 11.2.11.3. SWOT Analysis
- 11.2.11.4. Recent Developments
- 11.2.11.5. Financials (Based on Availability)
- 11.2.1 ITC
List of Figures
- Figure 1: Global Fortify Flour Revenue Breakdown (million, %) by Region 2024 & 2032
- Figure 2: Global Fortify Flour Volume Breakdown (K, %) by Region 2024 & 2032
- Figure 3: North America Fortify Flour Revenue (million), by Application 2024 & 2032
- Figure 4: North America Fortify Flour Volume (K), by Application 2024 & 2032
- Figure 5: North America Fortify Flour Revenue Share (%), by Application 2024 & 2032
- Figure 6: North America Fortify Flour Volume Share (%), by Application 2024 & 2032
- Figure 7: North America Fortify Flour Revenue (million), by Type 2024 & 2032
- Figure 8: North America Fortify Flour Volume (K), by Type 2024 & 2032
- Figure 9: North America Fortify Flour Revenue Share (%), by Type 2024 & 2032
- Figure 10: North America Fortify Flour Volume Share (%), by Type 2024 & 2032
- Figure 11: North America Fortify Flour Revenue (million), by Country 2024 & 2032
- Figure 12: North America Fortify Flour Volume (K), by Country 2024 & 2032
- Figure 13: North America Fortify Flour Revenue Share (%), by Country 2024 & 2032
- Figure 14: North America Fortify Flour Volume Share (%), by Country 2024 & 2032
- Figure 15: South America Fortify Flour Revenue (million), by Application 2024 & 2032
- Figure 16: South America Fortify Flour Volume (K), by Application 2024 & 2032
- Figure 17: South America Fortify Flour Revenue Share (%), by Application 2024 & 2032
- Figure 18: South America Fortify Flour Volume Share (%), by Application 2024 & 2032
- Figure 19: South America Fortify Flour Revenue (million), by Type 2024 & 2032
- Figure 20: South America Fortify Flour Volume (K), by Type 2024 & 2032
- Figure 21: South America Fortify Flour Revenue Share (%), by Type 2024 & 2032
- Figure 22: South America Fortify Flour Volume Share (%), by Type 2024 & 2032
- Figure 23: South America Fortify Flour Revenue (million), by Country 2024 & 2032
- Figure 24: South America Fortify Flour Volume (K), by Country 2024 & 2032
- Figure 25: South America Fortify Flour Revenue Share (%), by Country 2024 & 2032
- Figure 26: South America Fortify Flour Volume Share (%), by Country 2024 & 2032
- Figure 27: Europe Fortify Flour Revenue (million), by Application 2024 & 2032
- Figure 28: Europe Fortify Flour Volume (K), by Application 2024 & 2032
- Figure 29: Europe Fortify Flour Revenue Share (%), by Application 2024 & 2032
- Figure 30: Europe Fortify Flour Volume Share (%), by Application 2024 & 2032
- Figure 31: Europe Fortify Flour Revenue (million), by Type 2024 & 2032
- Figure 32: Europe Fortify Flour Volume (K), by Type 2024 & 2032
- Figure 33: Europe Fortify Flour Revenue Share (%), by Type 2024 & 2032
- Figure 34: Europe Fortify Flour Volume Share (%), by Type 2024 & 2032
- Figure 35: Europe Fortify Flour Revenue (million), by Country 2024 & 2032
- Figure 36: Europe Fortify Flour Volume (K), by Country 2024 & 2032
- Figure 37: Europe Fortify Flour Revenue Share (%), by Country 2024 & 2032
- Figure 38: Europe Fortify Flour Volume Share (%), by Country 2024 & 2032
- Figure 39: Middle East & Africa Fortify Flour Revenue (million), by Application 2024 & 2032
- Figure 40: Middle East & Africa Fortify Flour Volume (K), by Application 2024 & 2032
- Figure 41: Middle East & Africa Fortify Flour Revenue Share (%), by Application 2024 & 2032
- Figure 42: Middle East & Africa Fortify Flour Volume Share (%), by Application 2024 & 2032
- Figure 43: Middle East & Africa Fortify Flour Revenue (million), by Type 2024 & 2032
- Figure 44: Middle East & Africa Fortify Flour Volume (K), by Type 2024 & 2032
- Figure 45: Middle East & Africa Fortify Flour Revenue Share (%), by Type 2024 & 2032
- Figure 46: Middle East & Africa Fortify Flour Volume Share (%), by Type 2024 & 2032
- Figure 47: Middle East & Africa Fortify Flour Revenue (million), by Country 2024 & 2032
- Figure 48: Middle East & Africa Fortify Flour Volume (K), by Country 2024 & 2032
- Figure 49: Middle East & Africa Fortify Flour Revenue Share (%), by Country 2024 & 2032
- Figure 50: Middle East & Africa Fortify Flour Volume Share (%), by Country 2024 & 2032
- Figure 51: Asia Pacific Fortify Flour Revenue (million), by Application 2024 & 2032
- Figure 52: Asia Pacific Fortify Flour Volume (K), by Application 2024 & 2032
- Figure 53: Asia Pacific Fortify Flour Revenue Share (%), by Application 2024 & 2032
- Figure 54: Asia Pacific Fortify Flour Volume Share (%), by Application 2024 & 2032
- Figure 55: Asia Pacific Fortify Flour Revenue (million), by Type 2024 & 2032
- Figure 56: Asia Pacific Fortify Flour Volume (K), by Type 2024 & 2032
- Figure 57: Asia Pacific Fortify Flour Revenue Share (%), by Type 2024 & 2032
- Figure 58: Asia Pacific Fortify Flour Volume Share (%), by Type 2024 & 2032
- Figure 59: Asia Pacific Fortify Flour Revenue (million), by Country 2024 & 2032
- Figure 60: Asia Pacific Fortify Flour Volume (K), by Country 2024 & 2032
- Figure 61: Asia Pacific Fortify Flour Revenue Share (%), by Country 2024 & 2032
- Figure 62: Asia Pacific Fortify Flour Volume Share (%), by Country 2024 & 2032
List of Tables
- Table 1: Global Fortify Flour Revenue million Forecast, by Region 2019 & 2032
- Table 2: Global Fortify Flour Volume K Forecast, by Region 2019 & 2032
- Table 3: Global Fortify Flour Revenue million Forecast, by Application 2019 & 2032
- Table 4: Global Fortify Flour Volume K Forecast, by Application 2019 & 2032
- Table 5: Global Fortify Flour Revenue million Forecast, by Type 2019 & 2032
- Table 6: Global Fortify Flour Volume K Forecast, by Type 2019 & 2032
- Table 7: Global Fortify Flour Revenue million Forecast, by Region 2019 & 2032
- Table 8: Global Fortify Flour Volume K Forecast, by Region 2019 & 2032
- Table 9: Global Fortify Flour Revenue million Forecast, by Application 2019 & 2032
- Table 10: Global Fortify Flour Volume K Forecast, by Application 2019 & 2032
- Table 11: Global Fortify Flour Revenue million Forecast, by Type 2019 & 2032
- Table 12: Global Fortify Flour Volume K Forecast, by Type 2019 & 2032
- Table 13: Global Fortify Flour Revenue million Forecast, by Country 2019 & 2032
- Table 14: Global Fortify Flour Volume K Forecast, by Country 2019 & 2032
- Table 15: United States Fortify Flour Revenue (million) Forecast, by Application 2019 & 2032
- Table 16: United States Fortify Flour Volume (K) Forecast, by Application 2019 & 2032
- Table 17: Canada Fortify Flour Revenue (million) Forecast, by Application 2019 & 2032
- Table 18: Canada Fortify Flour Volume (K) Forecast, by Application 2019 & 2032
- Table 19: Mexico Fortify Flour Revenue (million) Forecast, by Application 2019 & 2032
- Table 20: Mexico Fortify Flour Volume (K) Forecast, by Application 2019 & 2032
- Table 21: Global Fortify Flour Revenue million Forecast, by Application 2019 & 2032
- Table 22: Global Fortify Flour Volume K Forecast, by Application 2019 & 2032
- Table 23: Global Fortify Flour Revenue million Forecast, by Type 2019 & 2032
- Table 24: Global Fortify Flour Volume K Forecast, by Type 2019 & 2032
- Table 25: Global Fortify Flour Revenue million Forecast, by Country 2019 & 2032
- Table 26: Global Fortify Flour Volume K Forecast, by Country 2019 & 2032
- Table 27: Brazil Fortify Flour Revenue (million) Forecast, by Application 2019 & 2032
- Table 28: Brazil Fortify Flour Volume (K) Forecast, by Application 2019 & 2032
- Table 29: Argentina Fortify Flour Revenue (million) Forecast, by Application 2019 & 2032
- Table 30: Argentina Fortify Flour Volume (K) Forecast, by Application 2019 & 2032
- Table 31: Rest of South America Fortify Flour Revenue (million) Forecast, by Application 2019 & 2032
- Table 32: Rest of South America Fortify Flour Volume (K) Forecast, by Application 2019 & 2032
- Table 33: Global Fortify Flour Revenue million Forecast, by Application 2019 & 2032
- Table 34: Global Fortify Flour Volume K Forecast, by Application 2019 & 2032
- Table 35: Global Fortify Flour Revenue million Forecast, by Type 2019 & 2032
- Table 36: Global Fortify Flour Volume K Forecast, by Type 2019 & 2032
- Table 37: Global Fortify Flour Revenue million Forecast, by Country 2019 & 2032
- Table 38: Global Fortify Flour Volume K Forecast, by Country 2019 & 2032
- Table 39: United Kingdom Fortify Flour Revenue (million) Forecast, by Application 2019 & 2032
- Table 40: United Kingdom Fortify Flour Volume (K) Forecast, by Application 2019 & 2032
- Table 41: Germany Fortify Flour Revenue (million) Forecast, by Application 2019 & 2032
- Table 42: Germany Fortify Flour Volume (K) Forecast, by Application 2019 & 2032
- Table 43: France Fortify Flour Revenue (million) Forecast, by Application 2019 & 2032
- Table 44: France Fortify Flour Volume (K) Forecast, by Application 2019 & 2032
- Table 45: Italy Fortify Flour Revenue (million) Forecast, by Application 2019 & 2032
- Table 46: Italy Fortify Flour Volume (K) Forecast, by Application 2019 & 2032
- Table 47: Spain Fortify Flour Revenue (million) Forecast, by Application 2019 & 2032
- Table 48: Spain Fortify Flour Volume (K) Forecast, by Application 2019 & 2032
- Table 49: Russia Fortify Flour Revenue (million) Forecast, by Application 2019 & 2032
- Table 50: Russia Fortify Flour Volume (K) Forecast, by Application 2019 & 2032
- Table 51: Benelux Fortify Flour Revenue (million) Forecast, by Application 2019 & 2032
- Table 52: Benelux Fortify Flour Volume (K) Forecast, by Application 2019 & 2032
- Table 53: Nordics Fortify Flour Revenue (million) Forecast, by Application 2019 & 2032
- Table 54: Nordics Fortify Flour Volume (K) Forecast, by Application 2019 & 2032
- Table 55: Rest of Europe Fortify Flour Revenue (million) Forecast, by Application 2019 & 2032
- Table 56: Rest of Europe Fortify Flour Volume (K) Forecast, by Application 2019 & 2032
- Table 57: Global Fortify Flour Revenue million Forecast, by Application 2019 & 2032
- Table 58: Global Fortify Flour Volume K Forecast, by Application 2019 & 2032
- Table 59: Global Fortify Flour Revenue million Forecast, by Type 2019 & 2032
- Table 60: Global Fortify Flour Volume K Forecast, by Type 2019 & 2032
- Table 61: Global Fortify Flour Revenue million Forecast, by Country 2019 & 2032
- Table 62: Global Fortify Flour Volume K Forecast, by Country 2019 & 2032
- Table 63: Turkey Fortify Flour Revenue (million) Forecast, by Application 2019 & 2032
- Table 64: Turkey Fortify Flour Volume (K) Forecast, by Application 2019 & 2032
- Table 65: Israel Fortify Flour Revenue (million) Forecast, by Application 2019 & 2032
- Table 66: Israel Fortify Flour Volume (K) Forecast, by Application 2019 & 2032
- Table 67: GCC Fortify Flour Revenue (million) Forecast, by Application 2019 & 2032
- Table 68: GCC Fortify Flour Volume (K) Forecast, by Application 2019 & 2032
- Table 69: North Africa Fortify Flour Revenue (million) Forecast, by Application 2019 & 2032
- Table 70: North Africa Fortify Flour Volume (K) Forecast, by Application 2019 & 2032
- Table 71: South Africa Fortify Flour Revenue (million) Forecast, by Application 2019 & 2032
- Table 72: South Africa Fortify Flour Volume (K) Forecast, by Application 2019 & 2032
- Table 73: Rest of Middle East & Africa Fortify Flour Revenue (million) Forecast, by Application 2019 & 2032
- Table 74: Rest of Middle East & Africa Fortify Flour Volume (K) Forecast, by Application 2019 & 2032
- Table 75: Global Fortify Flour Revenue million Forecast, by Application 2019 & 2032
- Table 76: Global Fortify Flour Volume K Forecast, by Application 2019 & 2032
- Table 77: Global Fortify Flour Revenue million Forecast, by Type 2019 & 2032
- Table 78: Global Fortify Flour Volume K Forecast, by Type 2019 & 2032
- Table 79: Global Fortify Flour Revenue million Forecast, by Country 2019 & 2032
- Table 80: Global Fortify Flour Volume K Forecast, by Country 2019 & 2032
- Table 81: China Fortify Flour Revenue (million) Forecast, by Application 2019 & 2032
- Table 82: China Fortify Flour Volume (K) Forecast, by Application 2019 & 2032
- Table 83: India Fortify Flour Revenue (million) Forecast, by Application 2019 & 2032
- Table 84: India Fortify Flour Volume (K) Forecast, by Application 2019 & 2032
- Table 85: Japan Fortify Flour Revenue (million) Forecast, by Application 2019 & 2032
- Table 86: Japan Fortify Flour Volume (K) Forecast, by Application 2019 & 2032
- Table 87: South Korea Fortify Flour Revenue (million) Forecast, by Application 2019 & 2032
- Table 88: South Korea Fortify Flour Volume (K) Forecast, by Application 2019 & 2032
- Table 89: ASEAN Fortify Flour Revenue (million) Forecast, by Application 2019 & 2032
- Table 90: ASEAN Fortify Flour Volume (K) Forecast, by Application 2019 & 2032
- Table 91: Oceania Fortify Flour Revenue (million) Forecast, by Application 2019 & 2032
- Table 92: Oceania Fortify Flour Volume (K) Forecast, by Application 2019 & 2032
- Table 93: Rest of Asia Pacific Fortify Flour Revenue (million) Forecast, by Application 2019 & 2032
- Table 94: Rest of Asia Pacific Fortify Flour Volume (K) Forecast, by Application 2019 & 2032
Frequently Asked Questions
1. What is the projected Compound Annual Growth Rate (CAGR) of the Fortify Flour?
The projected CAGR is approximately XXX%.
2. Which companies are prominent players in the Fortify Flour?
Key companies in the market include ITC, Manildra, Hindustan Unilever, Cargill, Serendib Flour Mills, United Millers, BASF, Pristine, General Mills, Patanjali, Celrich Products.
3. What are the main segments of the Fortify Flour?
The market segments include Application, Type.
4. Can you provide details about the market size?
The market size is estimated to be USD XXX million as of 2022.
5. What are some drivers contributing to market growth?
N/A
6. What are the notable trends driving market growth?
N/A
7. Are there any restraints impacting market growth?
N/A
8. Can you provide examples of recent developments in the market?
N/A
9. What pricing options are available for accessing the report?
Pricing options include single-user, multi-user, and enterprise licenses priced at USD 3950.00, USD 5925.00, and USD 7900.00 respectively.
10. Is the market size provided in terms of value or volume?
The market size is provided in terms of value, measured in million and volume, measured in K.
11. Are there any specific market keywords associated with the report?
Yes, the market keyword associated with the report is "Fortify Flour," which aids in identifying and referencing the specific market segment covered.
12. How do I determine which pricing option suits my needs best?
The pricing options vary based on user requirements and access needs. Individual users may opt for single-user licenses, while businesses requiring broader access may choose multi-user or enterprise licenses for cost-effective access to the report.
13. Are there any additional resources or data provided in the Fortify Flour report?
While the report offers comprehensive insights, it's advisable to review the specific contents or supplementary materials provided to ascertain if additional resources or data are available.
14. How can I stay updated on further developments or reports in the Fortify Flour?
To stay informed about further developments, trends, and reports in the Fortify Flour, consider subscribing to industry newsletters, following relevant companies and organizations, or regularly checking reputable industry news sources and publications.
Methodology
Step 1 - Identification of Relevant Samples Size from Population Database


Step 2 - Approaches for Defining Global Market Size (Value, Volume* & Price*)

Note*: In applicable scenarios
Step 3 - Data Sources
Primary Research
- Web Analytics
- Survey Reports
- Research Institute
- Latest Research Reports
- Opinion Leaders
Secondary Research
- Annual Reports
- White Paper
- Latest Press Release
- Industry Association
- Paid Database
- Investor Presentations

Step 4 - Data Triangulation
Involves using different sources of information in order to increase the validity of a study
These sources are likely to be stakeholders in a program - participants, other researchers, program staff, other community members, and so on.
Then we put all data in single framework & apply various statistical tools to find out the dynamic on the market.
During the analysis stage, feedback from the stakeholder groups would be compared to determine areas of agreement as well as areas of divergence
