

Key Insights
The MEA Functional Beverages market is projected for robust growth, driven by increasing consumer health consciousness, rising disposable incomes, and a preference for healthier beverage alternatives. Key growth segments include energy drinks, fortified juices, and sports drinks, distributed through supermarkets, pharmacies, and online channels. The convenience of e-commerce and rising health and wellness trends are significant market expansion drivers. Despite challenges like fluctuating raw material prices and intense competition, the outlook remains positive. Established global players and regional brands contribute to a dynamic market. Growth is anticipated in rapidly developing economies like the UAE and Saudi Arabia, with untapped potential across the region.
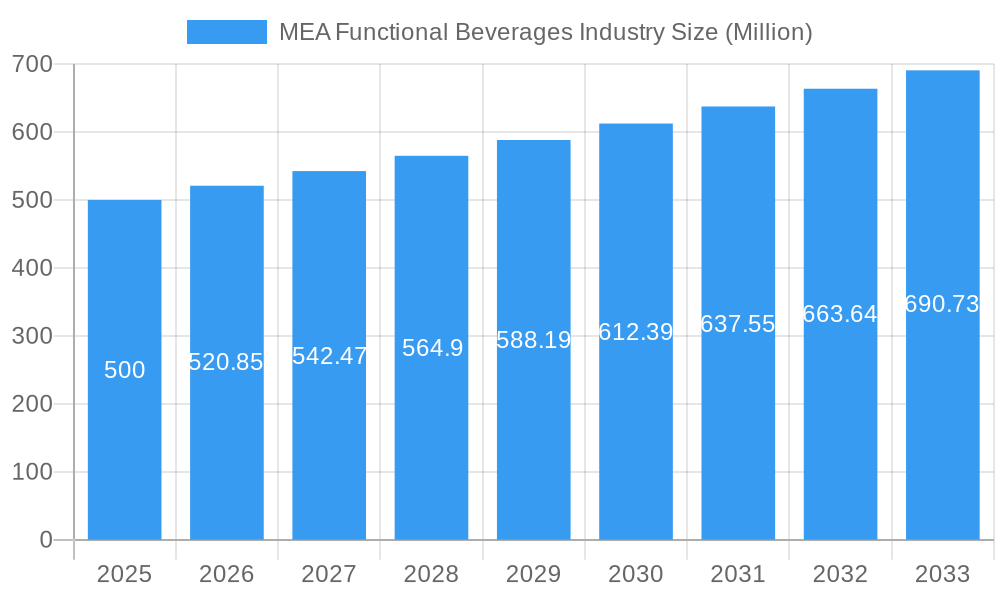
MEA Functional Beverages Industry Market Size (In Billion)
Market segmentation offers strategic opportunities. The high growth potential of online retail aligns with increasing digital penetration. Focusing on the rising demand for healthier product options can unlock substantial market share. Companies should prioritize product innovation, emphasizing natural ingredients and functional benefits, and develop targeted marketing campaigns for the region's health-conscious consumers. Future success hinges on adapting to evolving preferences and addressing regional specifics in taste and distribution. A strategic balance of global brand strength and local adaptation will be crucial for sustained growth.
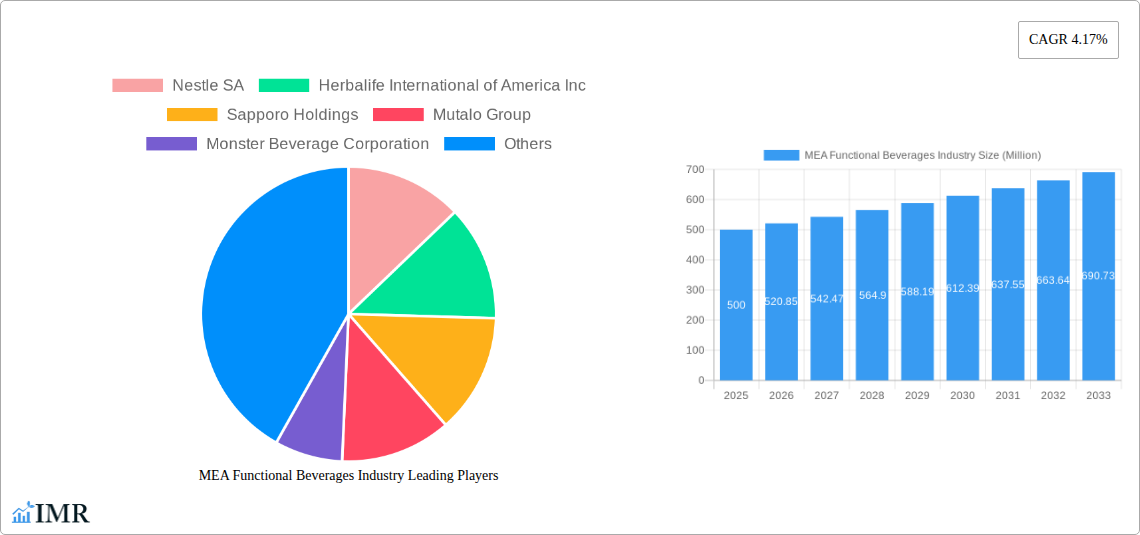
MEA Functional Beverages Industry Company Market Share
This report offers a comprehensive analysis of the Middle East and Africa (MEA) functional beverages industry, detailing market size, growth trends, competitive landscape, and future outlook. The forecast period spans 2019-2033, with 2025 as the base year. The estimated market size is 171.86 billion, with a projected CAGR of 5.6 from 2025 to 2033. This study is essential for industry professionals, investors, and strategic planners seeking to understand and capitalize on this dynamic sector.
MEA Functional Beverages Industry Market Dynamics & Structure
The MEA functional beverage market is characterized by a moderately concentrated landscape, with key players such as Nestle SA, Herbalife International of America Inc, Sapporo Holdings, Mutalo Group, Monster Beverage Corporation, PepsiCo Inc, Dr Pepper Snapple, Viju Industries Nigeria Ltd, iPRO Sport Distribution Limited, Red Bull GmbH, and The Coca-Cola Company vying for market share. Market concentration is estimated at xx% in 2025, driven by the significant investments of multinational corporations. Technological innovation, particularly in product formulation and packaging, plays a crucial role. Regulatory frameworks concerning labeling, health claims, and ingredient approvals vary across the region, impacting market dynamics. The market faces competition from traditional beverages, but the growing health-conscious population fuels demand for functional alternatives. Mergers and acquisitions (M&A) activity has been moderate, with xx deals recorded in the historical period (2019-2024), mainly focused on expanding product portfolios and market reach.
- Market Concentration: xx% in 2025 (estimated)
- M&A Activity (2019-2024): xx deals
- Key Innovation Drivers: Product formulation (e.g., organic, low-sugar), sustainable packaging, personalized nutrition.
- Regulatory Challenges: Varying standards across countries, health claim regulations.
- Competitive Substitutes: Traditional soft drinks, juices, water.
MEA Functional Beverages Industry Growth Trends & Insights
The MEA functional beverages market has witnessed substantial growth throughout the historical period (2019-2024), driven by increasing health awareness, rising disposable incomes, and changing lifestyle preferences. The market size, valued at xx million units in 2024, is projected to reach xx million units by 2033, exhibiting a CAGR of xx% during the forecast period (2025-2033). This growth is largely fueled by the increasing adoption of energy drinks, sports drinks, and fortified juices, particularly among young adults and athletes. Technological disruptions, such as the introduction of innovative ingredients and packaging solutions, further stimulate market expansion. Consumer behavior shifts towards healthier options, coupled with increased awareness of functional benefits, are key drivers of growth. Market penetration for functional beverages is estimated at xx% in 2025, with significant growth potential in underserved segments.
Dominant Regions, Countries, or Segments in MEA Functional Beverages Industry
The UAE, Saudi Arabia, and South Africa are the leading markets within the MEA region, exhibiting strong growth potential due to favorable economic conditions and increasing consumer spending on health and wellness products. The supermarket/hypermarket distribution channel holds the largest market share, followed by convenience stores and online retail stores. In terms of product type, energy drinks dominate the market, with fortified juices and sports drinks showing significant growth potential. Key drivers in these segments include:
- UAE & Saudi Arabia: High disposable incomes, significant investments in infrastructure, supportive government policies.
- South Africa: Expanding middle class, increasing health awareness, favorable demographics.
- Supermarket/Hypermarket: Established distribution network, wide product range, high consumer reach.
- Energy Drinks: High demand driven by active lifestyles, increasing popularity of sports and fitness activities.
MEA Functional Beverages Industry Product Landscape
The MEA functional beverages market is characterized by a diverse range of products, including energy drinks with varying caffeine content and functional ingredients (e.g., vitamins, minerals, antioxidants), fortified juices rich in essential nutrients, sports drinks designed for hydration and electrolyte replenishment, and dairy-based drinks with added probiotics and other health benefits. Recent product innovations focus on natural ingredients, low-sugar formulations, and sustainable packaging options. These innovations aim to cater to evolving consumer preferences for healthier and more ethically sourced products. Unique selling propositions focus on taste, efficacy, and convenience.
Key Drivers, Barriers & Challenges in MEA Functional Beverages Industry
Key Drivers:
- Increasing health awareness among consumers
- Rising disposable incomes and spending power
- Growing popularity of fitness and sports activities
- Favorable demographics and population growth
Challenges:
- Intense competition among established players
- Regulatory hurdles concerning labeling and ingredient approvals
- Supply chain disruptions and rising raw material costs
- Varying consumer preferences across the region (estimated impact: xx% reduction in market growth in certain sub-regions)
Emerging Opportunities in MEA Functional Beverages Industry
Untapped markets in rural areas and less developed countries within MEA present significant growth potential. Opportunities exist for personalized nutrition products, tailored to specific dietary requirements and health goals. Growing demand for organic and sustainably sourced ingredients provides further opportunities for specialized product launches. Expanding into the online retail channel holds potential for reaching a wider consumer base.
Growth Accelerators in the MEA Functional Beverages Industry Industry
Strategic partnerships and collaborations between beverage manufacturers and health and wellness companies can accelerate market growth. Technological advancements in product formulation, packaging, and delivery systems will play a vital role. Expansion into new markets and segments, along with targeted marketing campaigns, will further propel market expansion.
Key Players Shaping the MEA Functional Beverages Industry Market
- Nestle SA
- Herbalife International of America Inc
- Sapporo Holdings
- Mutalo Group
- Monster Beverage Corporation
- PepsiCo Inc
- Dr Pepper Snapple
- Viju Industries Nigeria Ltd
- iPRO Sport Distribution Limited
- Red Bull GmbH
- The Coca-Cola Company
Notable Milestones in MEA Functional Beverages Industry Sector
- October 2022: iPRO launched a range of sports drinks in Carrefour stores across the UAE.
- February 2022: PepsiCo launched its hemp-based energy drink, "Rockstar Energy," in the Middle East.
- March 2021: Perrier launched its carbonated energy beverage, Perrier Energize, in Saudi Arabia.
In-Depth MEA Functional Beverages Industry Market Outlook
The MEA functional beverages market is poised for continued growth, driven by increasing health awareness, evolving consumer preferences, and technological innovations. Strategic investments in product development, targeted marketing, and expansion into new markets will unlock significant opportunities for players in this dynamic sector. The market's future potential is substantial, with opportunities for both established players and emerging brands to capture market share.
MEA Functional Beverages Industry Segmentation
-
1. Product Type
- 1.1. Energy Drinks
- 1.2. Fortified Juice
- 1.3. Sports Drinks
- 1.4. Dairy-based Drinks
- 1.5. Other Product Types
-
2. Distribution Channel
- 2.1. Supermarket/Hypermarket
- 2.2. Pharmacies and Health Stores
- 2.3. Convenience Stores
- 2.4. Online Retail Stores
- 2.5. Other Distribution Channels
-
3. Geography
- 3.1. South Africa
- 3.2. Saudi Arabia
- 3.3. Rest of Middle-East and Africa
MEA Functional Beverages Industry Segmentation By Geography
- 1. South Africa
- 2. Saudi Arabia
- 3. Rest of Middle East and Africa
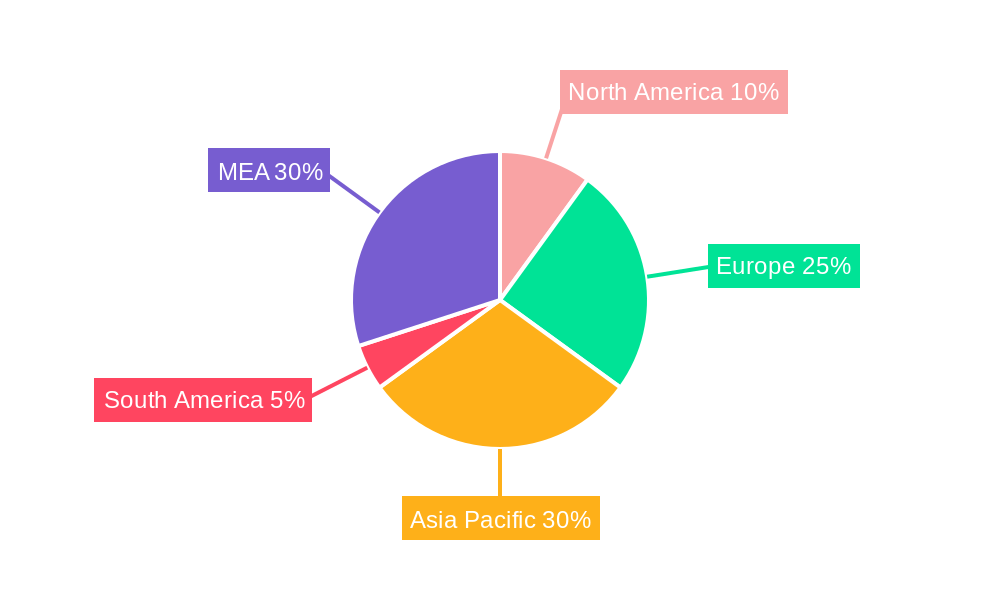
MEA Functional Beverages Industry Regional Market Share
Geographic Coverage of MEA Functional Beverages Industry
MEA Functional Beverages Industry REPORT HIGHLIGHTS
| Aspects | Details |
|---|---|
| Study Period | 2020-2034 |
| Base Year | 2025 |
| Estimated Year | 2026 |
| Forecast Period | 2026-2034 |
| Historical Period | 2020-2025 |
| Growth Rate | CAGR of 5.6% from 2020-2034 |
| Segmentation |
|
Table of Contents
- 1. Introduction
- 1.1. Research Scope
- 1.2. Market Segmentation
- 1.3. Research Objective
- 1.4. Definitions and Assumptions
- 2. Executive Summary
- 2.1. Market Snapshot
- 3. Market Dynamics
- 3.1. Market Drivers
- 3.2. Market Restrains
- 3.3. Market Trends
- 3.4. Market Opportunities
- 4. Market Factor Analysis
- 4.1. Porters Five Forces
- 4.1.1. Bargaining Power of Suppliers
- 4.1.2. Bargaining Power of Buyers
- 4.1.3. Threat of New Entrants
- 4.1.4. Threat of Substitutes
- 4.1.5. Competitive Rivalry
- 4.2. PESTEL analysis
- 4.3. BCG Analysis
- 4.3.1. Stars (High Growth, High Market Share)
- 4.3.2. Cash Cows (Low Growth, High Market Share)
- 4.3.3. Question Mark (High Growth, Low Market Share)
- 4.3.4. Dogs (Low Growth, Low Market Share)
- 4.4. Ansoff Matrix Analysis
- 4.5. Supply Chain Analysis
- 4.6. Regulatory Landscape
- 4.7. Current Market Potential and Opportunity Assessment (TAM–SAM–SOM Framework)
- 4.8. IMR Analyst Note
- 4.1. Porters Five Forces
- 5. Market Analysis, Insights and Forecast 2021-2033
- 5.1. Market Analysis, Insights and Forecast - by Product Type
- 5.1.1. Energy Drinks
- 5.1.2. Fortified Juice
- 5.1.3. Sports Drinks
- 5.1.4. Dairy-based Drinks
- 5.1.5. Other Product Types
- 5.2. Market Analysis, Insights and Forecast - by Distribution Channel
- 5.2.1. Supermarket/Hypermarket
- 5.2.2. Pharmacies and Health Stores
- 5.2.3. Convenience Stores
- 5.2.4. Online Retail Stores
- 5.2.5. Other Distribution Channels
- 5.3. Market Analysis, Insights and Forecast - by Geography
- 5.3.1. South Africa
- 5.3.2. Saudi Arabia
- 5.3.3. Rest of Middle-East and Africa
- 5.4. Market Analysis, Insights and Forecast - by Region
- 5.4.1. South Africa
- 5.4.2. Saudi Arabia
- 5.4.3. Rest of Middle East and Africa
- 5.1. Market Analysis, Insights and Forecast - by Product Type
- 6. Global MEA Functional Beverages Industry Analysis, Insights and Forecast, 2021-2033
- 6.1. Market Analysis, Insights and Forecast - by Product Type
- 6.1.1. Energy Drinks
- 6.1.2. Fortified Juice
- 6.1.3. Sports Drinks
- 6.1.4. Dairy-based Drinks
- 6.1.5. Other Product Types
- 6.2. Market Analysis, Insights and Forecast - by Distribution Channel
- 6.2.1. Supermarket/Hypermarket
- 6.2.2. Pharmacies and Health Stores
- 6.2.3. Convenience Stores
- 6.2.4. Online Retail Stores
- 6.2.5. Other Distribution Channels
- 6.3. Market Analysis, Insights and Forecast - by Geography
- 6.3.1. South Africa
- 6.3.2. Saudi Arabia
- 6.3.3. Rest of Middle-East and Africa
- 6.1. Market Analysis, Insights and Forecast - by Product Type
- 7. South Africa MEA Functional Beverages Industry Analysis, Insights and Forecast, 2020-2032
- 7.1. Market Analysis, Insights and Forecast - by Product Type
- 7.1.1. Energy Drinks
- 7.1.2. Fortified Juice
- 7.1.3. Sports Drinks
- 7.1.4. Dairy-based Drinks
- 7.1.5. Other Product Types
- 7.2. Market Analysis, Insights and Forecast - by Distribution Channel
- 7.2.1. Supermarket/Hypermarket
- 7.2.2. Pharmacies and Health Stores
- 7.2.3. Convenience Stores
- 7.2.4. Online Retail Stores
- 7.2.5. Other Distribution Channels
- 7.3. Market Analysis, Insights and Forecast - by Geography
- 7.3.1. South Africa
- 7.3.2. Saudi Arabia
- 7.3.3. Rest of Middle-East and Africa
- 7.1. Market Analysis, Insights and Forecast - by Product Type
- 8. Saudi Arabia MEA Functional Beverages Industry Analysis, Insights and Forecast, 2020-2032
- 8.1. Market Analysis, Insights and Forecast - by Product Type
- 8.1.1. Energy Drinks
- 8.1.2. Fortified Juice
- 8.1.3. Sports Drinks
- 8.1.4. Dairy-based Drinks
- 8.1.5. Other Product Types
- 8.2. Market Analysis, Insights and Forecast - by Distribution Channel
- 8.2.1. Supermarket/Hypermarket
- 8.2.2. Pharmacies and Health Stores
- 8.2.3. Convenience Stores
- 8.2.4. Online Retail Stores
- 8.2.5. Other Distribution Channels
- 8.3. Market Analysis, Insights and Forecast - by Geography
- 8.3.1. South Africa
- 8.3.2. Saudi Arabia
- 8.3.3. Rest of Middle-East and Africa
- 8.1. Market Analysis, Insights and Forecast - by Product Type
- 9. Rest of Middle East and Africa MEA Functional Beverages Industry Analysis, Insights and Forecast, 2020-2032
- 9.1. Market Analysis, Insights and Forecast - by Product Type
- 9.1.1. Energy Drinks
- 9.1.2. Fortified Juice
- 9.1.3. Sports Drinks
- 9.1.4. Dairy-based Drinks
- 9.1.5. Other Product Types
- 9.2. Market Analysis, Insights and Forecast - by Distribution Channel
- 9.2.1. Supermarket/Hypermarket
- 9.2.2. Pharmacies and Health Stores
- 9.2.3. Convenience Stores
- 9.2.4. Online Retail Stores
- 9.2.5. Other Distribution Channels
- 9.3. Market Analysis, Insights and Forecast - by Geography
- 9.3.1. South Africa
- 9.3.2. Saudi Arabia
- 9.3.3. Rest of Middle-East and Africa
- 9.1. Market Analysis, Insights and Forecast - by Product Type
- 10. Competitive Analysis
- 10.1. Company Profiles
- 10.1.1 Nestle SA
- 10.1.1.1. Company Overview
- 10.1.1.2. Products
- 10.1.1.3. Company Financials
- 10.1.1.4. SWOT Analysis
- 10.1.2 Herbalife International of America Inc
- 10.1.2.1. Company Overview
- 10.1.2.2. Products
- 10.1.2.3. Company Financials
- 10.1.2.4. SWOT Analysis
- 10.1.3 Sapporo Holdings
- 10.1.3.1. Company Overview
- 10.1.3.2. Products
- 10.1.3.3. Company Financials
- 10.1.3.4. SWOT Analysis
- 10.1.4 Mutalo Group
- 10.1.4.1. Company Overview
- 10.1.4.2. Products
- 10.1.4.3. Company Financials
- 10.1.4.4. SWOT Analysis
- 10.1.5 Monster Beverage Corporation
- 10.1.5.1. Company Overview
- 10.1.5.2. Products
- 10.1.5.3. Company Financials
- 10.1.5.4. SWOT Analysis
- 10.1.6 PepsiCo Inc
- 10.1.6.1. Company Overview
- 10.1.6.2. Products
- 10.1.6.3. Company Financials
- 10.1.6.4. SWOT Analysis
- 10.1.7 Dr Pepper Snapple
- 10.1.7.1. Company Overview
- 10.1.7.2. Products
- 10.1.7.3. Company Financials
- 10.1.7.4. SWOT Analysis
- 10.1.8 Viju Industries Nigeria Ltd
- 10.1.8.1. Company Overview
- 10.1.8.2. Products
- 10.1.8.3. Company Financials
- 10.1.8.4. SWOT Analysis
- 10.1.9 iPRO Sport Distribution Limited*List Not Exhaustive
- 10.1.9.1. Company Overview
- 10.1.9.2. Products
- 10.1.9.3. Company Financials
- 10.1.9.4. SWOT Analysis
- 10.1.10 Red Bull GmbH
- 10.1.10.1. Company Overview
- 10.1.10.2. Products
- 10.1.10.3. Company Financials
- 10.1.10.4. SWOT Analysis
- 10.1.11 The Coca-Cola Company
- 10.1.11.1. Company Overview
- 10.1.11.2. Products
- 10.1.11.3. Company Financials
- 10.1.11.4. SWOT Analysis
- 10.1.1 Nestle SA
- 10.2. Market Entropy
- 10.2.1 Company's Key Areas Served
- 10.2.2 Recent Developments
- 10.3. Company Market Share Analysis 2025
- 10.3.1 Top 5 Companies Market Share Analysis
- 10.3.2 Top 3 Companies Market Share Analysis
- 10.4. List of Potential Customers
- 11. Research Methodology
List of Figures
- Figure 1: Global MEA Functional Beverages Industry Revenue Breakdown (billion, %) by Region 2025 & 2033
- Figure 2: South Africa MEA Functional Beverages Industry Revenue (billion), by Product Type 2025 & 2033
- Figure 3: South Africa MEA Functional Beverages Industry Revenue Share (%), by Product Type 2025 & 2033
- Figure 4: South Africa MEA Functional Beverages Industry Revenue (billion), by Distribution Channel 2025 & 2033
- Figure 5: South Africa MEA Functional Beverages Industry Revenue Share (%), by Distribution Channel 2025 & 2033
- Figure 6: South Africa MEA Functional Beverages Industry Revenue (billion), by Geography 2025 & 2033
- Figure 7: South Africa MEA Functional Beverages Industry Revenue Share (%), by Geography 2025 & 2033
- Figure 8: South Africa MEA Functional Beverages Industry Revenue (billion), by Country 2025 & 2033
- Figure 9: South Africa MEA Functional Beverages Industry Revenue Share (%), by Country 2025 & 2033
- Figure 10: Saudi Arabia MEA Functional Beverages Industry Revenue (billion), by Product Type 2025 & 2033
- Figure 11: Saudi Arabia MEA Functional Beverages Industry Revenue Share (%), by Product Type 2025 & 2033
- Figure 12: Saudi Arabia MEA Functional Beverages Industry Revenue (billion), by Distribution Channel 2025 & 2033
- Figure 13: Saudi Arabia MEA Functional Beverages Industry Revenue Share (%), by Distribution Channel 2025 & 2033
- Figure 14: Saudi Arabia MEA Functional Beverages Industry Revenue (billion), by Geography 2025 & 2033
- Figure 15: Saudi Arabia MEA Functional Beverages Industry Revenue Share (%), by Geography 2025 & 2033
- Figure 16: Saudi Arabia MEA Functional Beverages Industry Revenue (billion), by Country 2025 & 2033
- Figure 17: Saudi Arabia MEA Functional Beverages Industry Revenue Share (%), by Country 2025 & 2033
- Figure 18: Rest of Middle East and Africa MEA Functional Beverages Industry Revenue (billion), by Product Type 2025 & 2033
- Figure 19: Rest of Middle East and Africa MEA Functional Beverages Industry Revenue Share (%), by Product Type 2025 & 2033
- Figure 20: Rest of Middle East and Africa MEA Functional Beverages Industry Revenue (billion), by Distribution Channel 2025 & 2033
- Figure 21: Rest of Middle East and Africa MEA Functional Beverages Industry Revenue Share (%), by Distribution Channel 2025 & 2033
- Figure 22: Rest of Middle East and Africa MEA Functional Beverages Industry Revenue (billion), by Geography 2025 & 2033
- Figure 23: Rest of Middle East and Africa MEA Functional Beverages Industry Revenue Share (%), by Geography 2025 & 2033
- Figure 24: Rest of Middle East and Africa MEA Functional Beverages Industry Revenue (billion), by Country 2025 & 2033
- Figure 25: Rest of Middle East and Africa MEA Functional Beverages Industry Revenue Share (%), by Country 2025 & 2033
List of Tables
- Table 1: Global MEA Functional Beverages Industry Revenue billion Forecast, by Product Type 2020 & 2033
- Table 2: Global MEA Functional Beverages Industry Revenue billion Forecast, by Distribution Channel 2020 & 2033
- Table 3: Global MEA Functional Beverages Industry Revenue billion Forecast, by Geography 2020 & 2033
- Table 4: Global MEA Functional Beverages Industry Revenue billion Forecast, by Region 2020 & 2033
- Table 5: Global MEA Functional Beverages Industry Revenue billion Forecast, by Product Type 2020 & 2033
- Table 6: Global MEA Functional Beverages Industry Revenue billion Forecast, by Distribution Channel 2020 & 2033
- Table 7: Global MEA Functional Beverages Industry Revenue billion Forecast, by Geography 2020 & 2033
- Table 8: Global MEA Functional Beverages Industry Revenue billion Forecast, by Country 2020 & 2033
- Table 9: Global MEA Functional Beverages Industry Revenue billion Forecast, by Product Type 2020 & 2033
- Table 10: Global MEA Functional Beverages Industry Revenue billion Forecast, by Distribution Channel 2020 & 2033
- Table 11: Global MEA Functional Beverages Industry Revenue billion Forecast, by Geography 2020 & 2033
- Table 12: Global MEA Functional Beverages Industry Revenue billion Forecast, by Country 2020 & 2033
- Table 13: Global MEA Functional Beverages Industry Revenue billion Forecast, by Product Type 2020 & 2033
- Table 14: Global MEA Functional Beverages Industry Revenue billion Forecast, by Distribution Channel 2020 & 2033
- Table 15: Global MEA Functional Beverages Industry Revenue billion Forecast, by Geography 2020 & 2033
- Table 16: Global MEA Functional Beverages Industry Revenue billion Forecast, by Country 2020 & 2033
Frequently Asked Questions
1. What is the projected Compound Annual Growth Rate (CAGR) of the MEA Functional Beverages Industry?
The projected CAGR is approximately 5.6%.
2. Which companies are prominent players in the MEA Functional Beverages Industry?
Key companies in the market include Nestle SA, Herbalife International of America Inc, Sapporo Holdings, Mutalo Group, Monster Beverage Corporation, PepsiCo Inc, Dr Pepper Snapple, Viju Industries Nigeria Ltd, iPRO Sport Distribution Limited*List Not Exhaustive, Red Bull GmbH, The Coca-Cola Company.
3. What are the main segments of the MEA Functional Beverages Industry?
The market segments include Product Type, Distribution Channel, Geography.
4. Can you provide details about the market size?
The market size is estimated to be USD 171.86 billion as of 2022.
5. What are some drivers contributing to market growth?
Preference for Plant-based and Clean-label RTD Products; Consumer Inclination Toward Sugar-Free Drinks.
6. What are the notable trends driving market growth?
Growing Demand for Plant-based and Lactose-free Products.
7. Are there any restraints impacting market growth?
Concerns Over Health Issues Associated With Beverages.
8. Can you provide examples of recent developments in the market?
October 2022: iPRO launched a range of sports drinks in Carrefour stores across the United Arab Emirates. The company claims that it contains 100% of the daily recommended vitamin C intake, along with added B vitamins.
9. What pricing options are available for accessing the report?
Pricing options include single-user, multi-user, and enterprise licenses priced at USD 4750, USD 5250, and USD 8750 respectively.
10. Is the market size provided in terms of value or volume?
The market size is provided in terms of value, measured in billion.
11. Are there any specific market keywords associated with the report?
Yes, the market keyword associated with the report is "MEA Functional Beverages Industry," which aids in identifying and referencing the specific market segment covered.
12. How do I determine which pricing option suits my needs best?
The pricing options vary based on user requirements and access needs. Individual users may opt for single-user licenses, while businesses requiring broader access may choose multi-user or enterprise licenses for cost-effective access to the report.
13. Are there any additional resources or data provided in the MEA Functional Beverages Industry report?
While the report offers comprehensive insights, it's advisable to review the specific contents or supplementary materials provided to ascertain if additional resources or data are available.
14. How can I stay updated on further developments or reports in the MEA Functional Beverages Industry?
To stay informed about further developments, trends, and reports in the MEA Functional Beverages Industry, consider subscribing to industry newsletters, following relevant companies and organizations, or regularly checking reputable industry news sources and publications.
Methodology
Step 1 - Identification of Relevant Samples Size from Population Database


Step 2 - Approaches for Defining Global Market Size (Value, Volume* & Price*)

Note*: In applicable scenarios
Step 3 - Data Sources
Primary Research
- Web Analytics
- Survey Reports
- Research Institute
- Latest Research Reports
- Opinion Leaders
Secondary Research
- Annual Reports
- White Paper
- Latest Press Release
- Industry Association
- Paid Database
- Investor Presentations

Step 4 - Data Triangulation
Involves using different sources of information in order to increase the validity of a study
These sources are likely to be stakeholders in a program - participants, other researchers, program staff, other community members, and so on.
Then we put all data in single framework & apply various statistical tools to find out the dynamic on the market.
During the analysis stage, feedback from the stakeholder groups would be compared to determine areas of agreement as well as areas of divergence