

Key Insights
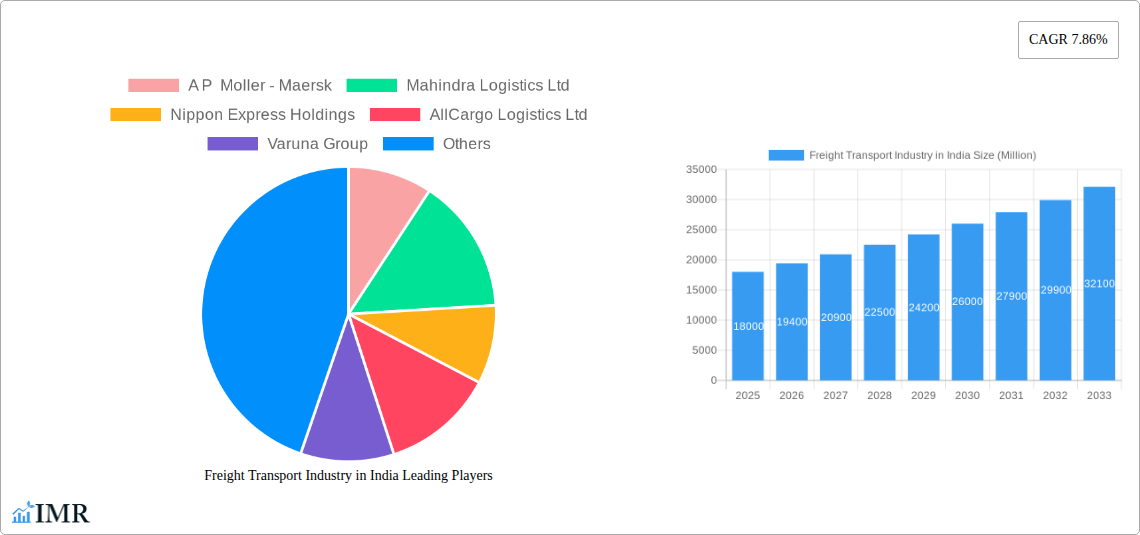
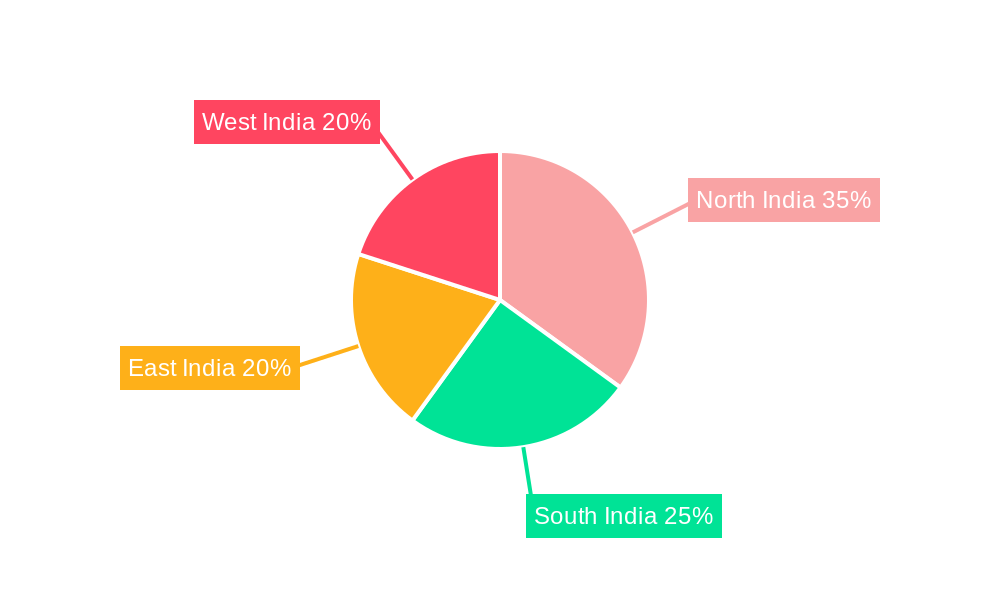
The Indian freight transport market, valued at approximately ₹150 billion (USD 18 billion) in 2025, is experiencing robust growth, projected at a 7.86% CAGR from 2025 to 2033. This expansion is fueled by several key factors. The burgeoning e-commerce sector significantly increases demand for efficient and reliable last-mile delivery solutions, driving growth across all segments, particularly LTL and short-haul transportation. Simultaneously, India's ongoing infrastructure development, including improved road networks and port facilities, is streamlining logistics and reducing transit times. Government initiatives promoting ease of doing business and digitalization within the logistics sector are further accelerating market growth. Growth is spread across segments; the Full Truck Load (FTL) segment remains dominant, although Less than Truck Load (LTL) is experiencing faster growth due to the e-commerce boom. The temperature-controlled segment is also witnessing significant growth due to the increasing demand for food and pharmaceutical transportation. While the construction, manufacturing, and e-commerce sectors are key drivers, the agriculture, fishing, and forestry sectors also contribute significantly to freight volume, especially in domestic transportation. Regional variations exist, with North and West India showing higher growth rates due to higher industrial activity and population density.
However, challenges persist. Fluctuations in fuel prices and driver shortages pose significant operational hurdles. Regulatory complexities and inconsistent implementation of policies can also create bottlenecks. The industry faces the need for improved technology adoption for enhanced efficiency, real-time tracking, and route optimization. Addressing these challenges through strategic investments in infrastructure, technology, and workforce development is crucial for sustained and inclusive growth of the Indian freight transport market. The market is expected to witness consolidation amongst players as larger logistics firms acquire smaller ones, leading to improved efficiency and service offerings.
Freight Transport Industry in India: Market Dynamics, Growth & Outlook 2019-2033
This comprehensive report provides an in-depth analysis of the Indian freight transport industry, encompassing market size, segmentation, key players, and future growth projections from 2019 to 2033. With a base year of 2025 and a forecast period of 2025-2033, this report is an essential resource for industry professionals, investors, and strategic decision-makers. We leverage extensive data to deliver actionable insights, covering various segments like FTL, LTL, domestic and international transport, and key end-user industries. This report uses Million units for all values.
Freight Transport Industry in India Market Dynamics & Structure
The Indian freight transport market is characterized by a fragmented landscape with several large players and numerous smaller operators. Market concentration is relatively low, though consolidation is ongoing through mergers and acquisitions (M&A). Technological innovation, particularly in areas like digital logistics platforms and autonomous vehicles, is driving efficiency and transparency. However, regulatory hurdles and infrastructure limitations pose significant challenges. The market is also influenced by government policies aimed at improving infrastructure and streamlining logistics operations.
- Market Concentration: xx% of market share held by top 5 players in 2024.
- M&A Activity: xx deals valued at xx Million units in 2019-2024.
- Technological Innovation: Adoption of GPS tracking, telematics, and route optimization software is increasing, improving efficiency.
- Regulatory Framework: Government initiatives such as the Bharatmala project are improving infrastructure, but bureaucratic processes remain a challenge.
- Competitive Product Substitutes: Rail and waterways offer alternatives for bulk transportation, but road transport remains dominant for shorter distances and time-sensitive deliveries.
- End-User Demographics: Growth is driven by expanding manufacturing, e-commerce, and construction sectors.
Freight Transport Industry in India Growth Trends & Insights
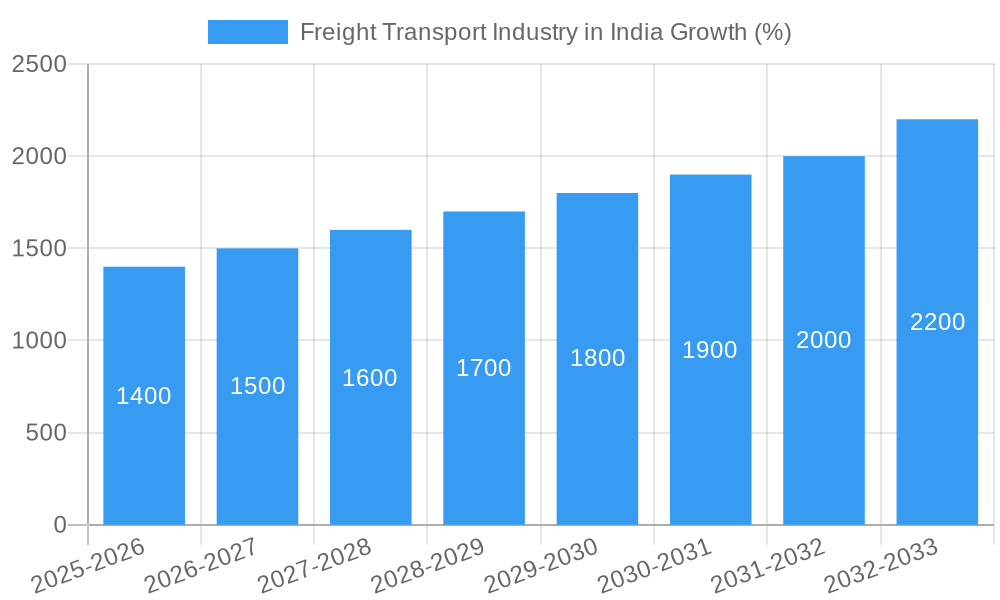
The Indian freight transport market experienced robust growth between 2019 and 2024, driven primarily by increasing industrial output, expanding e-commerce, and rising consumer demand. This trend is projected to continue, with a Compound Annual Growth Rate (CAGR) of xx% from 2025 to 2033, leading to a market size of xx Million units by 2033. Technological disruptions, such as the adoption of digital freight platforms and autonomous trucking, will further reshape the industry landscape, enhancing efficiency and lowering costs. Changing consumer behaviour, favoring faster and more reliable deliveries, also contributes to market growth. Market penetration of new technologies is expected to increase by xx% over the forecast period.
Dominant Regions, Countries, or Segments in Freight Transport Industry in India
The manufacturing sector is a dominant end-user industry, representing xx% of the total market share in 2024. Domestic transportation accounts for the largest share, reflecting the vastness of the Indian market and the high volume of inter-state movement. FTL (Full Truck Load) constitutes a significant portion of the truckload specification segment, followed by LTL (Less than Truck Load). Long-haul transportation dominates due to the geographical expanse of the country. Solid goods constitute a larger share of the goods configuration compared to fluid goods. Non-temperature controlled transportation dominates the temperature control segment, although temperature-controlled logistics is growing.
- End User Industry: Manufacturing (xx Million units), Wholesale and Retail Trade (xx Million units), Construction (xx Million units).
- Destination: Domestic (xx Million units), International (xx Million units).
- Truckload Specification: FTL (xx Million units), LTL (xx Million units).
- Distance: Long Haul (xx Million units), Short Haul (xx Million units).
- Key Growth Drivers: Government infrastructure investments, expanding e-commerce, and robust industrial growth.
Freight Transport Industry in India Product Landscape
The freight transport industry is witnessing the emergence of advanced technologies, including smart logistics platforms, predictive analytics for route optimization, and IoT-enabled tracking systems. These advancements enhance efficiency, improve transparency, and lower operational costs. Unique selling propositions (USPs) include speed, reliability, tracking capabilities, and customized solutions tailored to diverse cargo needs. The integration of AI and machine learning is driving further innovation in route optimization and predictive maintenance.
Key Drivers, Barriers & Challenges in Freight Transport Industry in India
Key Drivers: The growth of e-commerce, government initiatives to improve infrastructure, and increased manufacturing output are key drivers. The rising demand for faster and more efficient delivery services further propels market growth.
Challenges: High fuel costs, inadequate infrastructure in certain regions, stringent regulations, and intense competition create significant challenges. Driver shortages and the need for skilled labor also pose obstacles to growth. These factors contribute to increased operational costs and potential delivery delays, impacting profitability.
Emerging Opportunities in Freight Transport Industry in India
The rise of e-commerce continues to present significant opportunities for growth, particularly in last-mile delivery and specialized services. Sustainable logistics, including electric vehicles and alternative fuels, represent a growing area of opportunity. The integration of technology into logistics operations, like AI-powered route optimization and autonomous vehicles, holds immense potential.
Growth Accelerators in the Freight Transport Industry in India Industry
Technological advancements, strategic partnerships, and government policies focusing on infrastructure development will serve as critical growth accelerators. Expansion into underserved regions, providing specialized solutions for temperature-sensitive goods and hazardous materials will also enhance market penetration.
Key Players Shaping the Freight Transport Industry in India Market
- A P Moller - Maersk
- Mahindra Logistics Ltd
- Nippon Express Holdings
- AllCargo Logistics Ltd
- Varuna Group
- CJ Darcl
- DHL Group
- GEODIS
- VRL Logistics Ltd
- Delhivery Limited
- Transport Corporation of India Limited (TCI)
- Safexpress
- V-Trans
- Gati Express & Supply Chain Private Limited
- Expeditors International of Washington Inc
Notable Milestones in Freight Transport Industry in India Sector
- October 2023: CJ Darcl Logistics and Tata Motors signed an MoU to strengthen CJ Darcl's fleet.
- September 2023: Shreeji Translogistics partnered with DHL Express for bonded trucking services.
- August 2023: Maersk expanded its electric vehicle fleet to over 500 for e-commerce delivery.
In-Depth Freight Transport Industry in India Market Outlook
The Indian freight transport market is poised for significant growth, driven by sustained economic expansion, technological innovation, and government investments. Strategic partnerships, expansion into new segments, and adoption of sustainable practices will be crucial for success. The market's future potential is substantial, offering lucrative opportunities for both established players and new entrants.
Freight Transport Industry in India Segmentation
-
1. End User Industry
- 1.1. Agriculture, Fishing, and Forestry
- 1.2. Construction
- 1.3. Manufacturing
- 1.4. Oil and Gas, Mining and Quarrying
- 1.5. Wholesale and Retail Trade
- 1.6. Others
-
2. Destination
- 2.1. Domestic
- 2.2. International
-
3. Truckload Specification
- 3.1. Full-Truck-Load (FTL)
- 3.2. Less than-Truck-Load (LTL)
-
4. Containerization
- 4.1. Containerized
- 4.2. Non-Containerized
-
5. Distance
- 5.1. Long Haul
- 5.2. Short Haul
-
6. Goods Configuration
- 6.1. Fluid Goods
- 6.2. Solid Goods
-
7. Temperature Control
- 7.1. Non-Temperature Controlled
Freight Transport Industry in India Segmentation By Geography
-
1. North America
- 1.1. United States
- 1.2. Canada
- 1.3. Mexico
-
2. South America
- 2.1. Brazil
- 2.2. Argentina
- 2.3. Rest of South America
-
3. Europe
- 3.1. United Kingdom
- 3.2. Germany
- 3.3. France
- 3.4. Italy
- 3.5. Spain
- 3.6. Russia
- 3.7. Benelux
- 3.8. Nordics
- 3.9. Rest of Europe
-
4. Middle East & Africa
- 4.1. Turkey
- 4.2. Israel
- 4.3. GCC
- 4.4. North Africa
- 4.5. South Africa
- 4.6. Rest of Middle East & Africa
-
5. Asia Pacific
- 5.1. China
- 5.2. India
- 5.3. Japan
- 5.4. South Korea
- 5.5. ASEAN
- 5.6. Oceania
- 5.7. Rest of Asia Pacific
Freight Transport Industry in India REPORT HIGHLIGHTS
| Aspects | Details |
|---|---|
| Study Period | 2019-2033 |
| Base Year | 2024 |
| Estimated Year | 2025 |
| Forecast Period | 2025-2033 |
| Historical Period | 2019-2024 |
| Growth Rate | CAGR of 7.86% from 2019-2033 |
| Segmentation |
|
Table of Contents
- 1. Introduction
- 1.1. Research Scope
- 1.2. Market Segmentation
- 1.3. Research Methodology
- 1.4. Definitions and Assumptions
- 2. Executive Summary
- 2.1. Introduction
- 3. Market Dynamics
- 3.1. Introduction
- 3.2. Market Drivers
- 3.2.1. 4.; Increasing demand for efficient transportation4.; Growing eCommerce industry
- 3.3. Market Restrains
- 3.3.1. 4.; Intense competition affecting the market4.; Fluctuating fuel prices
- 3.4. Market Trends
- 3.4.1. OTHER KEY INDUSTRY TRENDS COVERED IN THE REPORT
- 4. Market Factor Analysis
- 4.1. Porters Five Forces
- 4.2. Supply/Value Chain
- 4.3. PESTEL analysis
- 4.4. Market Entropy
- 4.5. Patent/Trademark Analysis
- 5. Global Freight Transport Industry in India Analysis, Insights and Forecast, 2019-2031
- 5.1. Market Analysis, Insights and Forecast - by End User Industry
- 5.1.1. Agriculture, Fishing, and Forestry
- 5.1.2. Construction
- 5.1.3. Manufacturing
- 5.1.4. Oil and Gas, Mining and Quarrying
- 5.1.5. Wholesale and Retail Trade
- 5.1.6. Others
- 5.2. Market Analysis, Insights and Forecast - by Destination
- 5.2.1. Domestic
- 5.2.2. International
- 5.3. Market Analysis, Insights and Forecast - by Truckload Specification
- 5.3.1. Full-Truck-Load (FTL)
- 5.3.2. Less than-Truck-Load (LTL)
- 5.4. Market Analysis, Insights and Forecast - by Containerization
- 5.4.1. Containerized
- 5.4.2. Non-Containerized
- 5.5. Market Analysis, Insights and Forecast - by Distance
- 5.5.1. Long Haul
- 5.5.2. Short Haul
- 5.6. Market Analysis, Insights and Forecast - by Goods Configuration
- 5.6.1. Fluid Goods
- 5.6.2. Solid Goods
- 5.7. Market Analysis, Insights and Forecast - by Temperature Control
- 5.7.1. Non-Temperature Controlled
- 5.8. Market Analysis, Insights and Forecast - by Region
- 5.8.1. North America
- 5.8.2. South America
- 5.8.3. Europe
- 5.8.4. Middle East & Africa
- 5.8.5. Asia Pacific
- 5.1. Market Analysis, Insights and Forecast - by End User Industry
- 6. North America Freight Transport Industry in India Analysis, Insights and Forecast, 2019-2031
- 6.1. Market Analysis, Insights and Forecast - by End User Industry
- 6.1.1. Agriculture, Fishing, and Forestry
- 6.1.2. Construction
- 6.1.3. Manufacturing
- 6.1.4. Oil and Gas, Mining and Quarrying
- 6.1.5. Wholesale and Retail Trade
- 6.1.6. Others
- 6.2. Market Analysis, Insights and Forecast - by Destination
- 6.2.1. Domestic
- 6.2.2. International
- 6.3. Market Analysis, Insights and Forecast - by Truckload Specification
- 6.3.1. Full-Truck-Load (FTL)
- 6.3.2. Less than-Truck-Load (LTL)
- 6.4. Market Analysis, Insights and Forecast - by Containerization
- 6.4.1. Containerized
- 6.4.2. Non-Containerized
- 6.5. Market Analysis, Insights and Forecast - by Distance
- 6.5.1. Long Haul
- 6.5.2. Short Haul
- 6.6. Market Analysis, Insights and Forecast - by Goods Configuration
- 6.6.1. Fluid Goods
- 6.6.2. Solid Goods
- 6.7. Market Analysis, Insights and Forecast - by Temperature Control
- 6.7.1. Non-Temperature Controlled
- 6.1. Market Analysis, Insights and Forecast - by End User Industry
- 7. South America Freight Transport Industry in India Analysis, Insights and Forecast, 2019-2031
- 7.1. Market Analysis, Insights and Forecast - by End User Industry
- 7.1.1. Agriculture, Fishing, and Forestry
- 7.1.2. Construction
- 7.1.3. Manufacturing
- 7.1.4. Oil and Gas, Mining and Quarrying
- 7.1.5. Wholesale and Retail Trade
- 7.1.6. Others
- 7.2. Market Analysis, Insights and Forecast - by Destination
- 7.2.1. Domestic
- 7.2.2. International
- 7.3. Market Analysis, Insights and Forecast - by Truckload Specification
- 7.3.1. Full-Truck-Load (FTL)
- 7.3.2. Less than-Truck-Load (LTL)
- 7.4. Market Analysis, Insights and Forecast - by Containerization
- 7.4.1. Containerized
- 7.4.2. Non-Containerized
- 7.5. Market Analysis, Insights and Forecast - by Distance
- 7.5.1. Long Haul
- 7.5.2. Short Haul
- 7.6. Market Analysis, Insights and Forecast - by Goods Configuration
- 7.6.1. Fluid Goods
- 7.6.2. Solid Goods
- 7.7. Market Analysis, Insights and Forecast - by Temperature Control
- 7.7.1. Non-Temperature Controlled
- 7.1. Market Analysis, Insights and Forecast - by End User Industry
- 8. Europe Freight Transport Industry in India Analysis, Insights and Forecast, 2019-2031
- 8.1. Market Analysis, Insights and Forecast - by End User Industry
- 8.1.1. Agriculture, Fishing, and Forestry
- 8.1.2. Construction
- 8.1.3. Manufacturing
- 8.1.4. Oil and Gas, Mining and Quarrying
- 8.1.5. Wholesale and Retail Trade
- 8.1.6. Others
- 8.2. Market Analysis, Insights and Forecast - by Destination
- 8.2.1. Domestic
- 8.2.2. International
- 8.3. Market Analysis, Insights and Forecast - by Truckload Specification
- 8.3.1. Full-Truck-Load (FTL)
- 8.3.2. Less than-Truck-Load (LTL)
- 8.4. Market Analysis, Insights and Forecast - by Containerization
- 8.4.1. Containerized
- 8.4.2. Non-Containerized
- 8.5. Market Analysis, Insights and Forecast - by Distance
- 8.5.1. Long Haul
- 8.5.2. Short Haul
- 8.6. Market Analysis, Insights and Forecast - by Goods Configuration
- 8.6.1. Fluid Goods
- 8.6.2. Solid Goods
- 8.7. Market Analysis, Insights and Forecast - by Temperature Control
- 8.7.1. Non-Temperature Controlled
- 8.1. Market Analysis, Insights and Forecast - by End User Industry
- 9. Middle East & Africa Freight Transport Industry in India Analysis, Insights and Forecast, 2019-2031
- 9.1. Market Analysis, Insights and Forecast - by End User Industry
- 9.1.1. Agriculture, Fishing, and Forestry
- 9.1.2. Construction
- 9.1.3. Manufacturing
- 9.1.4. Oil and Gas, Mining and Quarrying
- 9.1.5. Wholesale and Retail Trade
- 9.1.6. Others
- 9.2. Market Analysis, Insights and Forecast - by Destination
- 9.2.1. Domestic
- 9.2.2. International
- 9.3. Market Analysis, Insights and Forecast - by Truckload Specification
- 9.3.1. Full-Truck-Load (FTL)
- 9.3.2. Less than-Truck-Load (LTL)
- 9.4. Market Analysis, Insights and Forecast - by Containerization
- 9.4.1. Containerized
- 9.4.2. Non-Containerized
- 9.5. Market Analysis, Insights and Forecast - by Distance
- 9.5.1. Long Haul
- 9.5.2. Short Haul
- 9.6. Market Analysis, Insights and Forecast - by Goods Configuration
- 9.6.1. Fluid Goods
- 9.6.2. Solid Goods
- 9.7. Market Analysis, Insights and Forecast - by Temperature Control
- 9.7.1. Non-Temperature Controlled
- 9.1. Market Analysis, Insights and Forecast - by End User Industry
- 10. Asia Pacific Freight Transport Industry in India Analysis, Insights and Forecast, 2019-2031
- 10.1. Market Analysis, Insights and Forecast - by End User Industry
- 10.1.1. Agriculture, Fishing, and Forestry
- 10.1.2. Construction
- 10.1.3. Manufacturing
- 10.1.4. Oil and Gas, Mining and Quarrying
- 10.1.5. Wholesale and Retail Trade
- 10.1.6. Others
- 10.2. Market Analysis, Insights and Forecast - by Destination
- 10.2.1. Domestic
- 10.2.2. International
- 10.3. Market Analysis, Insights and Forecast - by Truckload Specification
- 10.3.1. Full-Truck-Load (FTL)
- 10.3.2. Less than-Truck-Load (LTL)
- 10.4. Market Analysis, Insights and Forecast - by Containerization
- 10.4.1. Containerized
- 10.4.2. Non-Containerized
- 10.5. Market Analysis, Insights and Forecast - by Distance
- 10.5.1. Long Haul
- 10.5.2. Short Haul
- 10.6. Market Analysis, Insights and Forecast - by Goods Configuration
- 10.6.1. Fluid Goods
- 10.6.2. Solid Goods
- 10.7. Market Analysis, Insights and Forecast - by Temperature Control
- 10.7.1. Non-Temperature Controlled
- 10.1. Market Analysis, Insights and Forecast - by End User Industry
- 11. North India Freight Transport Industry in India Analysis, Insights and Forecast, 2019-2031
- 12. South India Freight Transport Industry in India Analysis, Insights and Forecast, 2019-2031
- 13. East India Freight Transport Industry in India Analysis, Insights and Forecast, 2019-2031
- 14. West India Freight Transport Industry in India Analysis, Insights and Forecast, 2019-2031
- 15. Competitive Analysis
- 15.1. Global Market Share Analysis 2024
- 15.2. Company Profiles
- 15.2.1 A P Moller - Maersk
- 15.2.1.1. Overview
- 15.2.1.2. Products
- 15.2.1.3. SWOT Analysis
- 15.2.1.4. Recent Developments
- 15.2.1.5. Financials (Based on Availability)
- 15.2.2 Mahindra Logistics Ltd
- 15.2.2.1. Overview
- 15.2.2.2. Products
- 15.2.2.3. SWOT Analysis
- 15.2.2.4. Recent Developments
- 15.2.2.5. Financials (Based on Availability)
- 15.2.3 Nippon Express Holdings
- 15.2.3.1. Overview
- 15.2.3.2. Products
- 15.2.3.3. SWOT Analysis
- 15.2.3.4. Recent Developments
- 15.2.3.5. Financials (Based on Availability)
- 15.2.4 AllCargo Logistics Ltd
- 15.2.4.1. Overview
- 15.2.4.2. Products
- 15.2.4.3. SWOT Analysis
- 15.2.4.4. Recent Developments
- 15.2.4.5. Financials (Based on Availability)
- 15.2.5 Varuna Group
- 15.2.5.1. Overview
- 15.2.5.2. Products
- 15.2.5.3. SWOT Analysis
- 15.2.5.4. Recent Developments
- 15.2.5.5. Financials (Based on Availability)
- 15.2.6 CJ Darcl
- 15.2.6.1. Overview
- 15.2.6.2. Products
- 15.2.6.3. SWOT Analysis
- 15.2.6.4. Recent Developments
- 15.2.6.5. Financials (Based on Availability)
- 15.2.7 DHL Group
- 15.2.7.1. Overview
- 15.2.7.2. Products
- 15.2.7.3. SWOT Analysis
- 15.2.7.4. Recent Developments
- 15.2.7.5. Financials (Based on Availability)
- 15.2.8 GEODIS
- 15.2.8.1. Overview
- 15.2.8.2. Products
- 15.2.8.3. SWOT Analysis
- 15.2.8.4. Recent Developments
- 15.2.8.5. Financials (Based on Availability)
- 15.2.9 VRL Logistics Ltd
- 15.2.9.1. Overview
- 15.2.9.2. Products
- 15.2.9.3. SWOT Analysis
- 15.2.9.4. Recent Developments
- 15.2.9.5. Financials (Based on Availability)
- 15.2.10 Delhivery Limited
- 15.2.10.1. Overview
- 15.2.10.2. Products
- 15.2.10.3. SWOT Analysis
- 15.2.10.4. Recent Developments
- 15.2.10.5. Financials (Based on Availability)
- 15.2.11 Transport Corporation of India Limited (TCI)
- 15.2.11.1. Overview
- 15.2.11.2. Products
- 15.2.11.3. SWOT Analysis
- 15.2.11.4. Recent Developments
- 15.2.11.5. Financials (Based on Availability)
- 15.2.12 Safexpress
- 15.2.12.1. Overview
- 15.2.12.2. Products
- 15.2.12.3. SWOT Analysis
- 15.2.12.4. Recent Developments
- 15.2.12.5. Financials (Based on Availability)
- 15.2.13 V-Trans
- 15.2.13.1. Overview
- 15.2.13.2. Products
- 15.2.13.3. SWOT Analysis
- 15.2.13.4. Recent Developments
- 15.2.13.5. Financials (Based on Availability)
- 15.2.14 Gati Express & Supply Chain Private Limited
- 15.2.14.1. Overview
- 15.2.14.2. Products
- 15.2.14.3. SWOT Analysis
- 15.2.14.4. Recent Developments
- 15.2.14.5. Financials (Based on Availability)
- 15.2.15 Expeditors International of Washington Inc
- 15.2.15.1. Overview
- 15.2.15.2. Products
- 15.2.15.3. SWOT Analysis
- 15.2.15.4. Recent Developments
- 15.2.15.5. Financials (Based on Availability)
- 15.2.1 A P Moller - Maersk
List of Figures
- Figure 1: Global Freight Transport Industry in India Revenue Breakdown (Million, %) by Region 2024 & 2032
- Figure 2: India Freight Transport Industry in India Revenue (Million), by Country 2024 & 2032
- Figure 3: India Freight Transport Industry in India Revenue Share (%), by Country 2024 & 2032
- Figure 4: North America Freight Transport Industry in India Revenue (Million), by End User Industry 2024 & 2032
- Figure 5: North America Freight Transport Industry in India Revenue Share (%), by End User Industry 2024 & 2032
- Figure 6: North America Freight Transport Industry in India Revenue (Million), by Destination 2024 & 2032
- Figure 7: North America Freight Transport Industry in India Revenue Share (%), by Destination 2024 & 2032
- Figure 8: North America Freight Transport Industry in India Revenue (Million), by Truckload Specification 2024 & 2032
- Figure 9: North America Freight Transport Industry in India Revenue Share (%), by Truckload Specification 2024 & 2032
- Figure 10: North America Freight Transport Industry in India Revenue (Million), by Containerization 2024 & 2032
- Figure 11: North America Freight Transport Industry in India Revenue Share (%), by Containerization 2024 & 2032
- Figure 12: North America Freight Transport Industry in India Revenue (Million), by Distance 2024 & 2032
- Figure 13: North America Freight Transport Industry in India Revenue Share (%), by Distance 2024 & 2032
- Figure 14: North America Freight Transport Industry in India Revenue (Million), by Goods Configuration 2024 & 2032
- Figure 15: North America Freight Transport Industry in India Revenue Share (%), by Goods Configuration 2024 & 2032
- Figure 16: North America Freight Transport Industry in India Revenue (Million), by Temperature Control 2024 & 2032
- Figure 17: North America Freight Transport Industry in India Revenue Share (%), by Temperature Control 2024 & 2032
- Figure 18: North America Freight Transport Industry in India Revenue (Million), by Country 2024 & 2032
- Figure 19: North America Freight Transport Industry in India Revenue Share (%), by Country 2024 & 2032
- Figure 20: South America Freight Transport Industry in India Revenue (Million), by End User Industry 2024 & 2032
- Figure 21: South America Freight Transport Industry in India Revenue Share (%), by End User Industry 2024 & 2032
- Figure 22: South America Freight Transport Industry in India Revenue (Million), by Destination 2024 & 2032
- Figure 23: South America Freight Transport Industry in India Revenue Share (%), by Destination 2024 & 2032
- Figure 24: South America Freight Transport Industry in India Revenue (Million), by Truckload Specification 2024 & 2032
- Figure 25: South America Freight Transport Industry in India Revenue Share (%), by Truckload Specification 2024 & 2032
- Figure 26: South America Freight Transport Industry in India Revenue (Million), by Containerization 2024 & 2032
- Figure 27: South America Freight Transport Industry in India Revenue Share (%), by Containerization 2024 & 2032
- Figure 28: South America Freight Transport Industry in India Revenue (Million), by Distance 2024 & 2032
- Figure 29: South America Freight Transport Industry in India Revenue Share (%), by Distance 2024 & 2032
- Figure 30: South America Freight Transport Industry in India Revenue (Million), by Goods Configuration 2024 & 2032
- Figure 31: South America Freight Transport Industry in India Revenue Share (%), by Goods Configuration 2024 & 2032
- Figure 32: South America Freight Transport Industry in India Revenue (Million), by Temperature Control 2024 & 2032
- Figure 33: South America Freight Transport Industry in India Revenue Share (%), by Temperature Control 2024 & 2032
- Figure 34: South America Freight Transport Industry in India Revenue (Million), by Country 2024 & 2032
- Figure 35: South America Freight Transport Industry in India Revenue Share (%), by Country 2024 & 2032
- Figure 36: Europe Freight Transport Industry in India Revenue (Million), by End User Industry 2024 & 2032
- Figure 37: Europe Freight Transport Industry in India Revenue Share (%), by End User Industry 2024 & 2032
- Figure 38: Europe Freight Transport Industry in India Revenue (Million), by Destination 2024 & 2032
- Figure 39: Europe Freight Transport Industry in India Revenue Share (%), by Destination 2024 & 2032
- Figure 40: Europe Freight Transport Industry in India Revenue (Million), by Truckload Specification 2024 & 2032
- Figure 41: Europe Freight Transport Industry in India Revenue Share (%), by Truckload Specification 2024 & 2032
- Figure 42: Europe Freight Transport Industry in India Revenue (Million), by Containerization 2024 & 2032
- Figure 43: Europe Freight Transport Industry in India Revenue Share (%), by Containerization 2024 & 2032
- Figure 44: Europe Freight Transport Industry in India Revenue (Million), by Distance 2024 & 2032
- Figure 45: Europe Freight Transport Industry in India Revenue Share (%), by Distance 2024 & 2032
- Figure 46: Europe Freight Transport Industry in India Revenue (Million), by Goods Configuration 2024 & 2032
- Figure 47: Europe Freight Transport Industry in India Revenue Share (%), by Goods Configuration 2024 & 2032
- Figure 48: Europe Freight Transport Industry in India Revenue (Million), by Temperature Control 2024 & 2032
- Figure 49: Europe Freight Transport Industry in India Revenue Share (%), by Temperature Control 2024 & 2032
- Figure 50: Europe Freight Transport Industry in India Revenue (Million), by Country 2024 & 2032
- Figure 51: Europe Freight Transport Industry in India Revenue Share (%), by Country 2024 & 2032
- Figure 52: Middle East & Africa Freight Transport Industry in India Revenue (Million), by End User Industry 2024 & 2032
- Figure 53: Middle East & Africa Freight Transport Industry in India Revenue Share (%), by End User Industry 2024 & 2032
- Figure 54: Middle East & Africa Freight Transport Industry in India Revenue (Million), by Destination 2024 & 2032
- Figure 55: Middle East & Africa Freight Transport Industry in India Revenue Share (%), by Destination 2024 & 2032
- Figure 56: Middle East & Africa Freight Transport Industry in India Revenue (Million), by Truckload Specification 2024 & 2032
- Figure 57: Middle East & Africa Freight Transport Industry in India Revenue Share (%), by Truckload Specification 2024 & 2032
- Figure 58: Middle East & Africa Freight Transport Industry in India Revenue (Million), by Containerization 2024 & 2032
- Figure 59: Middle East & Africa Freight Transport Industry in India Revenue Share (%), by Containerization 2024 & 2032
- Figure 60: Middle East & Africa Freight Transport Industry in India Revenue (Million), by Distance 2024 & 2032
- Figure 61: Middle East & Africa Freight Transport Industry in India Revenue Share (%), by Distance 2024 & 2032
- Figure 62: Middle East & Africa Freight Transport Industry in India Revenue (Million), by Goods Configuration 2024 & 2032
- Figure 63: Middle East & Africa Freight Transport Industry in India Revenue Share (%), by Goods Configuration 2024 & 2032
- Figure 64: Middle East & Africa Freight Transport Industry in India Revenue (Million), by Temperature Control 2024 & 2032
- Figure 65: Middle East & Africa Freight Transport Industry in India Revenue Share (%), by Temperature Control 2024 & 2032
- Figure 66: Middle East & Africa Freight Transport Industry in India Revenue (Million), by Country 2024 & 2032
- Figure 67: Middle East & Africa Freight Transport Industry in India Revenue Share (%), by Country 2024 & 2032
- Figure 68: Asia Pacific Freight Transport Industry in India Revenue (Million), by End User Industry 2024 & 2032
- Figure 69: Asia Pacific Freight Transport Industry in India Revenue Share (%), by End User Industry 2024 & 2032
- Figure 70: Asia Pacific Freight Transport Industry in India Revenue (Million), by Destination 2024 & 2032
- Figure 71: Asia Pacific Freight Transport Industry in India Revenue Share (%), by Destination 2024 & 2032
- Figure 72: Asia Pacific Freight Transport Industry in India Revenue (Million), by Truckload Specification 2024 & 2032
- Figure 73: Asia Pacific Freight Transport Industry in India Revenue Share (%), by Truckload Specification 2024 & 2032
- Figure 74: Asia Pacific Freight Transport Industry in India Revenue (Million), by Containerization 2024 & 2032
- Figure 75: Asia Pacific Freight Transport Industry in India Revenue Share (%), by Containerization 2024 & 2032
- Figure 76: Asia Pacific Freight Transport Industry in India Revenue (Million), by Distance 2024 & 2032
- Figure 77: Asia Pacific Freight Transport Industry in India Revenue Share (%), by Distance 2024 & 2032
- Figure 78: Asia Pacific Freight Transport Industry in India Revenue (Million), by Goods Configuration 2024 & 2032
- Figure 79: Asia Pacific Freight Transport Industry in India Revenue Share (%), by Goods Configuration 2024 & 2032
- Figure 80: Asia Pacific Freight Transport Industry in India Revenue (Million), by Temperature Control 2024 & 2032
- Figure 81: Asia Pacific Freight Transport Industry in India Revenue Share (%), by Temperature Control 2024 & 2032
- Figure 82: Asia Pacific Freight Transport Industry in India Revenue (Million), by Country 2024 & 2032
- Figure 83: Asia Pacific Freight Transport Industry in India Revenue Share (%), by Country 2024 & 2032
List of Tables
- Table 1: Global Freight Transport Industry in India Revenue Million Forecast, by Region 2019 & 2032
- Table 2: Global Freight Transport Industry in India Revenue Million Forecast, by End User Industry 2019 & 2032
- Table 3: Global Freight Transport Industry in India Revenue Million Forecast, by Destination 2019 & 2032
- Table 4: Global Freight Transport Industry in India Revenue Million Forecast, by Truckload Specification 2019 & 2032
- Table 5: Global Freight Transport Industry in India Revenue Million Forecast, by Containerization 2019 & 2032
- Table 6: Global Freight Transport Industry in India Revenue Million Forecast, by Distance 2019 & 2032
- Table 7: Global Freight Transport Industry in India Revenue Million Forecast, by Goods Configuration 2019 & 2032
- Table 8: Global Freight Transport Industry in India Revenue Million Forecast, by Temperature Control 2019 & 2032
- Table 9: Global Freight Transport Industry in India Revenue Million Forecast, by Region 2019 & 2032
- Table 10: Global Freight Transport Industry in India Revenue Million Forecast, by Country 2019 & 2032
- Table 11: North India Freight Transport Industry in India Revenue (Million) Forecast, by Application 2019 & 2032
- Table 12: South India Freight Transport Industry in India Revenue (Million) Forecast, by Application 2019 & 2032
- Table 13: East India Freight Transport Industry in India Revenue (Million) Forecast, by Application 2019 & 2032
- Table 14: West India Freight Transport Industry in India Revenue (Million) Forecast, by Application 2019 & 2032
- Table 15: Global Freight Transport Industry in India Revenue Million Forecast, by End User Industry 2019 & 2032
- Table 16: Global Freight Transport Industry in India Revenue Million Forecast, by Destination 2019 & 2032
- Table 17: Global Freight Transport Industry in India Revenue Million Forecast, by Truckload Specification 2019 & 2032
- Table 18: Global Freight Transport Industry in India Revenue Million Forecast, by Containerization 2019 & 2032
- Table 19: Global Freight Transport Industry in India Revenue Million Forecast, by Distance 2019 & 2032
- Table 20: Global Freight Transport Industry in India Revenue Million Forecast, by Goods Configuration 2019 & 2032
- Table 21: Global Freight Transport Industry in India Revenue Million Forecast, by Temperature Control 2019 & 2032
- Table 22: Global Freight Transport Industry in India Revenue Million Forecast, by Country 2019 & 2032
- Table 23: United States Freight Transport Industry in India Revenue (Million) Forecast, by Application 2019 & 2032
- Table 24: Canada Freight Transport Industry in India Revenue (Million) Forecast, by Application 2019 & 2032
- Table 25: Mexico Freight Transport Industry in India Revenue (Million) Forecast, by Application 2019 & 2032
- Table 26: Global Freight Transport Industry in India Revenue Million Forecast, by End User Industry 2019 & 2032
- Table 27: Global Freight Transport Industry in India Revenue Million Forecast, by Destination 2019 & 2032
- Table 28: Global Freight Transport Industry in India Revenue Million Forecast, by Truckload Specification 2019 & 2032
- Table 29: Global Freight Transport Industry in India Revenue Million Forecast, by Containerization 2019 & 2032
- Table 30: Global Freight Transport Industry in India Revenue Million Forecast, by Distance 2019 & 2032
- Table 31: Global Freight Transport Industry in India Revenue Million Forecast, by Goods Configuration 2019 & 2032
- Table 32: Global Freight Transport Industry in India Revenue Million Forecast, by Temperature Control 2019 & 2032
- Table 33: Global Freight Transport Industry in India Revenue Million Forecast, by Country 2019 & 2032
- Table 34: Brazil Freight Transport Industry in India Revenue (Million) Forecast, by Application 2019 & 2032
- Table 35: Argentina Freight Transport Industry in India Revenue (Million) Forecast, by Application 2019 & 2032
- Table 36: Rest of South America Freight Transport Industry in India Revenue (Million) Forecast, by Application 2019 & 2032
- Table 37: Global Freight Transport Industry in India Revenue Million Forecast, by End User Industry 2019 & 2032
- Table 38: Global Freight Transport Industry in India Revenue Million Forecast, by Destination 2019 & 2032
- Table 39: Global Freight Transport Industry in India Revenue Million Forecast, by Truckload Specification 2019 & 2032
- Table 40: Global Freight Transport Industry in India Revenue Million Forecast, by Containerization 2019 & 2032
- Table 41: Global Freight Transport Industry in India Revenue Million Forecast, by Distance 2019 & 2032
- Table 42: Global Freight Transport Industry in India Revenue Million Forecast, by Goods Configuration 2019 & 2032
- Table 43: Global Freight Transport Industry in India Revenue Million Forecast, by Temperature Control 2019 & 2032
- Table 44: Global Freight Transport Industry in India Revenue Million Forecast, by Country 2019 & 2032
- Table 45: United Kingdom Freight Transport Industry in India Revenue (Million) Forecast, by Application 2019 & 2032
- Table 46: Germany Freight Transport Industry in India Revenue (Million) Forecast, by Application 2019 & 2032
- Table 47: France Freight Transport Industry in India Revenue (Million) Forecast, by Application 2019 & 2032
- Table 48: Italy Freight Transport Industry in India Revenue (Million) Forecast, by Application 2019 & 2032
- Table 49: Spain Freight Transport Industry in India Revenue (Million) Forecast, by Application 2019 & 2032
- Table 50: Russia Freight Transport Industry in India Revenue (Million) Forecast, by Application 2019 & 2032
- Table 51: Benelux Freight Transport Industry in India Revenue (Million) Forecast, by Application 2019 & 2032
- Table 52: Nordics Freight Transport Industry in India Revenue (Million) Forecast, by Application 2019 & 2032
- Table 53: Rest of Europe Freight Transport Industry in India Revenue (Million) Forecast, by Application 2019 & 2032
- Table 54: Global Freight Transport Industry in India Revenue Million Forecast, by End User Industry 2019 & 2032
- Table 55: Global Freight Transport Industry in India Revenue Million Forecast, by Destination 2019 & 2032
- Table 56: Global Freight Transport Industry in India Revenue Million Forecast, by Truckload Specification 2019 & 2032
- Table 57: Global Freight Transport Industry in India Revenue Million Forecast, by Containerization 2019 & 2032
- Table 58: Global Freight Transport Industry in India Revenue Million Forecast, by Distance 2019 & 2032
- Table 59: Global Freight Transport Industry in India Revenue Million Forecast, by Goods Configuration 2019 & 2032
- Table 60: Global Freight Transport Industry in India Revenue Million Forecast, by Temperature Control 2019 & 2032
- Table 61: Global Freight Transport Industry in India Revenue Million Forecast, by Country 2019 & 2032
- Table 62: Turkey Freight Transport Industry in India Revenue (Million) Forecast, by Application 2019 & 2032
- Table 63: Israel Freight Transport Industry in India Revenue (Million) Forecast, by Application 2019 & 2032
- Table 64: GCC Freight Transport Industry in India Revenue (Million) Forecast, by Application 2019 & 2032
- Table 65: North Africa Freight Transport Industry in India Revenue (Million) Forecast, by Application 2019 & 2032
- Table 66: South Africa Freight Transport Industry in India Revenue (Million) Forecast, by Application 2019 & 2032
- Table 67: Rest of Middle East & Africa Freight Transport Industry in India Revenue (Million) Forecast, by Application 2019 & 2032
- Table 68: Global Freight Transport Industry in India Revenue Million Forecast, by End User Industry 2019 & 2032
- Table 69: Global Freight Transport Industry in India Revenue Million Forecast, by Destination 2019 & 2032
- Table 70: Global Freight Transport Industry in India Revenue Million Forecast, by Truckload Specification 2019 & 2032
- Table 71: Global Freight Transport Industry in India Revenue Million Forecast, by Containerization 2019 & 2032
- Table 72: Global Freight Transport Industry in India Revenue Million Forecast, by Distance 2019 & 2032
- Table 73: Global Freight Transport Industry in India Revenue Million Forecast, by Goods Configuration 2019 & 2032
- Table 74: Global Freight Transport Industry in India Revenue Million Forecast, by Temperature Control 2019 & 2032
- Table 75: Global Freight Transport Industry in India Revenue Million Forecast, by Country 2019 & 2032
- Table 76: China Freight Transport Industry in India Revenue (Million) Forecast, by Application 2019 & 2032
- Table 77: India Freight Transport Industry in India Revenue (Million) Forecast, by Application 2019 & 2032
- Table 78: Japan Freight Transport Industry in India Revenue (Million) Forecast, by Application 2019 & 2032
- Table 79: South Korea Freight Transport Industry in India Revenue (Million) Forecast, by Application 2019 & 2032
- Table 80: ASEAN Freight Transport Industry in India Revenue (Million) Forecast, by Application 2019 & 2032
- Table 81: Oceania Freight Transport Industry in India Revenue (Million) Forecast, by Application 2019 & 2032
- Table 82: Rest of Asia Pacific Freight Transport Industry in India Revenue (Million) Forecast, by Application 2019 & 2032
Frequently Asked Questions
1. What is the projected Compound Annual Growth Rate (CAGR) of the Freight Transport Industry in India?
The projected CAGR is approximately 7.86%.
2. Which companies are prominent players in the Freight Transport Industry in India?
Key companies in the market include A P Moller - Maersk, Mahindra Logistics Ltd, Nippon Express Holdings, AllCargo Logistics Ltd, Varuna Group, CJ Darcl, DHL Group, GEODIS, VRL Logistics Ltd, Delhivery Limited, Transport Corporation of India Limited (TCI), Safexpress, V-Trans, Gati Express & Supply Chain Private Limited, Expeditors International of Washington Inc.
3. What are the main segments of the Freight Transport Industry in India?
The market segments include End User Industry, Destination, Truckload Specification, Containerization, Distance, Goods Configuration, Temperature Control.
4. Can you provide details about the market size?
The market size is estimated to be USD XX Million as of 2022.
5. What are some drivers contributing to market growth?
4.; Increasing demand for efficient transportation4.; Growing eCommerce industry.
6. What are the notable trends driving market growth?
OTHER KEY INDUSTRY TRENDS COVERED IN THE REPORT.
7. Are there any restraints impacting market growth?
4.; Intense competition affecting the market4.; Fluctuating fuel prices.
8. Can you provide examples of recent developments in the market?
October 2023: CJ Darcl Logistics, a diversified logistics company, and Tata Motors signed a memorandum of understanding (MoU) to strengthen CJ Darcl’s fleet of vehicles and explore options of logistics services.September 2023: Shreeji Translogistics Limited (STL) one of the large integrated national logistical solution providers in India, has entered into contract with DHL Express (India) Pvt. Ltd. for providing courier cargo under bonded trucking services.August 2023: Maersk is expanding its fleet of electric vehicles to over 500 for deployment across 26 cities covering first, middle, and last-mile distribution for one of the top e-commerce platforms in India. The expansion ties with Maersk’s ambition to become net zero across businesses and provide customers with 100% green solutions by 2040.
9. What pricing options are available for accessing the report?
Pricing options include single-user, multi-user, and enterprise licenses priced at USD 3800, USD 4500, and USD 5800 respectively.
10. Is the market size provided in terms of value or volume?
The market size is provided in terms of value, measured in Million.
11. Are there any specific market keywords associated with the report?
Yes, the market keyword associated with the report is "Freight Transport Industry in India," which aids in identifying and referencing the specific market segment covered.
12. How do I determine which pricing option suits my needs best?
The pricing options vary based on user requirements and access needs. Individual users may opt for single-user licenses, while businesses requiring broader access may choose multi-user or enterprise licenses for cost-effective access to the report.
13. Are there any additional resources or data provided in the Freight Transport Industry in India report?
While the report offers comprehensive insights, it's advisable to review the specific contents or supplementary materials provided to ascertain if additional resources or data are available.
14. How can I stay updated on further developments or reports in the Freight Transport Industry in India?
To stay informed about further developments, trends, and reports in the Freight Transport Industry in India, consider subscribing to industry newsletters, following relevant companies and organizations, or regularly checking reputable industry news sources and publications.
Methodology
Step 1 - Identification of Relevant Samples Size from Population Database


Step 2 - Approaches for Defining Global Market Size (Value, Volume* & Price*)

Note*: In applicable scenarios
Step 3 - Data Sources
Primary Research
- Web Analytics
- Survey Reports
- Research Institute
- Latest Research Reports
- Opinion Leaders
Secondary Research
- Annual Reports
- White Paper
- Latest Press Release
- Industry Association
- Paid Database
- Investor Presentations

Step 4 - Data Triangulation
Involves using different sources of information in order to increase the validity of a study
These sources are likely to be stakeholders in a program - participants, other researchers, program staff, other community members, and so on.
Then we put all data in single framework & apply various statistical tools to find out the dynamic on the market.
During the analysis stage, feedback from the stakeholder groups would be compared to determine areas of agreement as well as areas of divergence
