

Key Insights
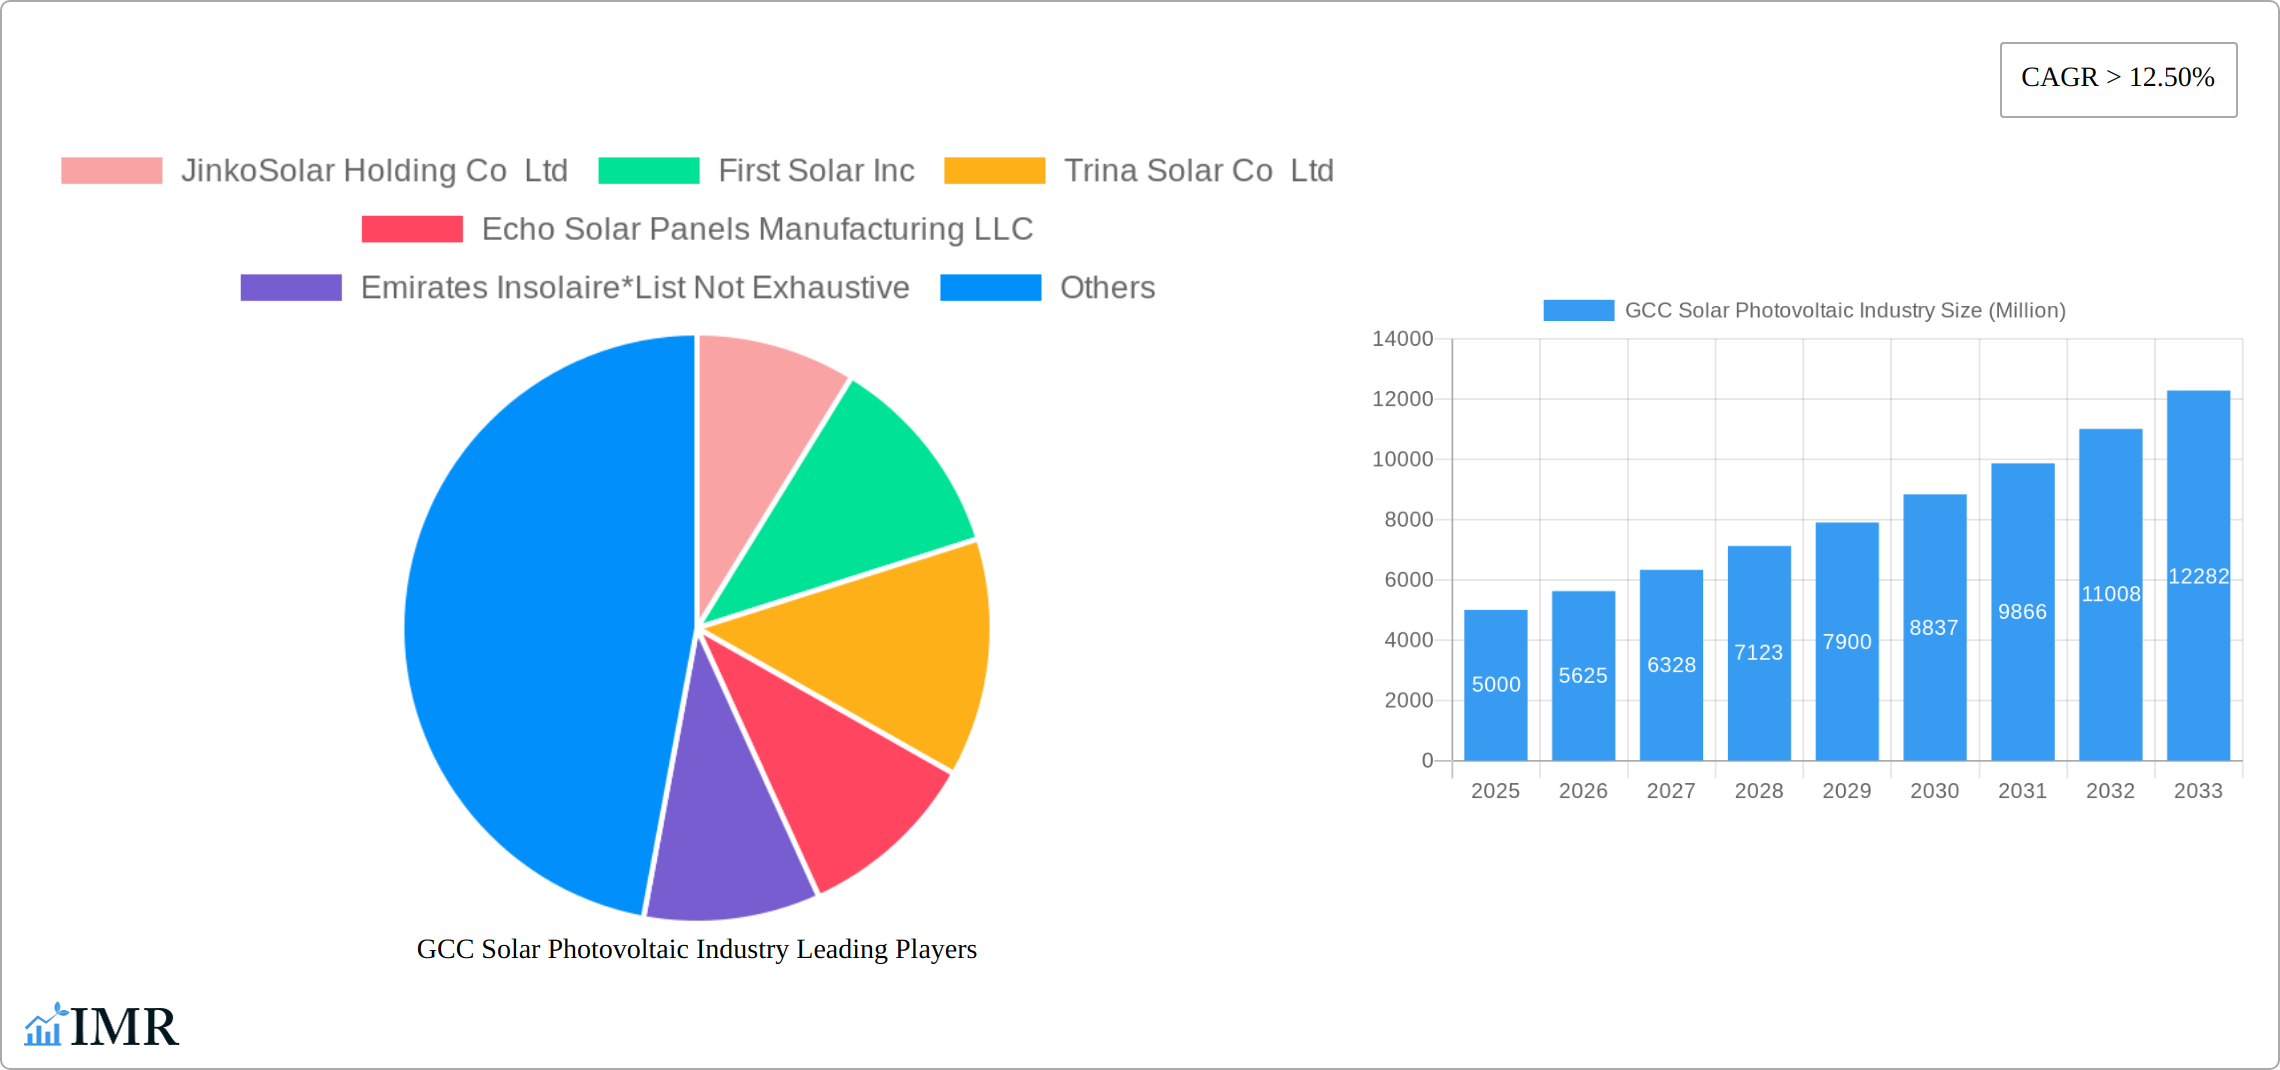
The GCC solar photovoltaic (PV) industry is experiencing robust growth, driven by ambitious government targets for renewable energy integration, the region's abundant sunshine, and decreasing PV system costs. The market's Compound Annual Growth Rate (CAGR) exceeding 12.50% indicates a significant expansion trajectory through 2033. Key drivers include supportive government policies such as feed-in tariffs, net metering schemes, and substantial investments in large-scale solar projects. Furthermore, the increasing awareness of environmental sustainability and the need for energy diversification are bolstering market demand. Deployment across utility, commercial & industrial, and residential sectors is anticipated to continue its upward trend, with utility-scale projects leading the growth due to economies of scale and governmental support. While challenges remain, such as grid integration complexities and the intermittent nature of solar energy, ongoing technological advancements in PV technology and energy storage solutions are mitigating these concerns. The competitive landscape is characterized by a mix of international players like JinkoSolar, First Solar, and Trina Solar, and regional companies, creating a dynamic market environment.
The GCC's strategic location and commitment to sustainable development place it favorably within the global renewable energy market. The region's economic diversification initiatives are intrinsically linked to renewable energy adoption, leading to further investments in research and development, improved infrastructure, and skilled workforce development within the solar sector. The residential segment, while currently smaller than utility and commercial applications, is showing significant growth potential as solar rooftop installations become more accessible and affordable. The continued focus on developing local manufacturing capabilities will reduce reliance on imports, enhancing the sector's resilience and overall contribution to the regional economy. Considering the projected CAGR and current market dynamics, the GCC solar PV market is poised for significant expansion, making it an attractive investment opportunity and a crucial element in the region's energy transition.
GCC Solar Photovoltaic Industry Market Report: 2019-2033
This comprehensive report provides an in-depth analysis of the GCC solar photovoltaic (PV) industry, encompassing market dynamics, growth trends, key players, and future outlook. The report covers the parent market of Renewable Energy in the GCC and the child market of Solar PV, offering valuable insights for industry professionals, investors, and policymakers. The study period spans from 2019 to 2033, with 2025 as the base and estimated year.
Study Period: 2019-2033 Base Year: 2025 Estimated Year: 2025 Forecast Period: 2025-2033 Historical Period: 2019-2024
GCC Solar Photovoltaic Industry Market Dynamics & Structure
The GCC solar PV market is experiencing rapid growth, driven by supportive government policies, increasing energy demand, and falling technology costs. Market concentration is moderate, with several international and regional players competing. Technological innovation is a key driver, with advancements in PV cell efficiency and energy storage solutions shaping the industry landscape. Regulatory frameworks, including feed-in tariffs and renewable energy targets, are crucial in fostering market expansion. While there are some competitive substitutes such as wind energy, solar PV's cost-effectiveness and scalability give it a significant advantage. End-user demographics show increasing adoption across utility, commercial & industrial (C&I), and residential sectors. M&A activity remains significant, with larger players consolidating their market share.
- Market Concentration: Moderate, with top 5 players holding approximately xx% market share in 2025.
- Technological Innovation: Focus on increasing cell efficiency, reducing production costs, and integrating advanced energy storage.
- Regulatory Framework: Supportive policies, including renewable energy targets and feed-in tariffs, driving market growth.
- Competitive Substitutes: Wind energy, but solar PV offers advantages in terms of scalability and land-use efficiency.
- End-User Demographics: Growing demand across all segments - Utility, C&I, and Residential.
- M&A Trends: xx major M&A deals recorded in the historical period (2019-2024), indicating a trend towards consolidation.
GCC Solar Photovoltaic Industry Growth Trends & Insights
The GCC solar PV market exhibits robust growth, fueled by a combination of factors. Market size has increased significantly from xx million units in 2019 to an estimated xx million units in 2025, exhibiting a Compound Annual Growth Rate (CAGR) of xx% during the historical period. Technological disruptions, such as the development of more efficient PV cells and improved energy storage technologies, are accelerating adoption rates. Shifting consumer behavior, driven by environmental awareness and cost savings, further contributes to market expansion. Market penetration is steadily increasing, with residential adoption gaining momentum in recent years.
(Note: This section requires XXX – presumed to be data to populate this section with specific numbers and more detailed analysis of market trends and consumer behavior shift data).

Dominant Regions, Countries, or Segments in GCC Solar Photovoltaic Industry
The Utility-scale segment dominates the GCC solar PV market, accounting for approximately xx% of total installations in 2025. Saudi Arabia and the UAE are the leading countries, driven by substantial government investments in renewable energy projects and ambitious national targets.
- Key Drivers in the Utility Segment: Government support through renewable energy targets, favorable feed-in tariffs, and large-scale project development initiatives.
- Key Drivers in the C&I Segment: Rising energy costs, corporate sustainability goals, and government incentives.
- Key Drivers in the Residential Segment: Increasing affordability of solar PV systems, government subsidies, and growing environmental awareness.
Saudi Arabia's dominance is primarily attributed to its vast land area suitable for large-scale solar farms and its commitment to diversifying its energy mix. The UAE, driven by ambitious renewable energy targets and strong private sector involvement, also demonstrates significant growth potential. The C&I segment is experiencing rapid growth, driven by increasing energy costs and corporate sustainability goals. Residential adoption is gradually increasing, propelled by falling technology costs and government incentives.
GCC Solar Photovoltaic Industry Product Landscape
The GCC solar PV market offers a diverse range of products, including monocrystalline, polycrystalline, and thin-film PV modules. Technological advancements are focused on enhancing cell efficiency, improving durability, and reducing production costs. Unique selling propositions include high power output, increased energy yield, and long-term warranties. Advances in bifacial technology and advanced trackers are boosting energy production capabilities.
Key Drivers, Barriers & Challenges in GCC Solar Photovoltaic Industry
Key Drivers:
- Supportive government policies and substantial investments in renewable energy.
- Decreasing solar PV technology costs, making it increasingly competitive with traditional energy sources.
- Growing energy demand and the need to diversify energy sources.
Challenges:
- Land acquisition and grid integration challenges can hinder large-scale project development.
- Supply chain disruptions and reliance on imported components can affect project timelines and costs.
- Regulatory uncertainties and bureaucratic hurdles can create delays in project implementation. The impact of these delays is estimated to result in a xx% decrease in project completion rates, based on analysis of historical data.
Emerging Opportunities in GCC Solar Photovoltaic Industry
- Growing demand for energy storage solutions to address intermittency issues associated with solar PV.
- Expansion into new applications, such as agrivoltaics (combining agriculture and solar power generation).
- Development of innovative financing mechanisms to reduce barriers to entry for smaller players.
Growth Accelerators in the GCC Solar Photovoltaic Industry
Technological breakthroughs, particularly in perovskite solar cells and advancements in energy storage technologies, are set to significantly enhance the efficiency and cost-effectiveness of solar PV systems. Strategic partnerships between international and regional players, fostering knowledge transfer and technology adoption, are key to unlocking market potential. The expansion of solar PV applications into new sectors, including desalination and water purification, presents significant growth opportunities.
Key Players Shaping the GCC Solar Photovoltaic Industry Market
- JinkoSolar Holding Co Ltd
- First Solar Inc
- Trina Solar Co Ltd
- Echo Solar Panels Manufacturing LLC
- Emirates Insolaire
- Sunergy Solar
- Canadian Solar Inc
- Dubai Electricity and Water Authority
- Masdar Abu Dhabi Future Energy Company
- ACWA Power
Notable Milestones in GCC Solar Photovoltaic Industry Sector
- April 2021: ACWA Power inaugurates the 300 MW Sakaka PV IPP, Saudi Arabia's first utility-scale renewable energy project, at a cost of SAR 1.2 billion (USD 320 million). The project was awarded at a record-breaking tariff of USD 2.3417 cents/kWh.
- Early 2020: Hanergy Thin Film Power Group announces plans to build a thin-film industrial park in Saudi Arabia, with an estimated investment of USD 1 billion (EUR 870 million).
In-Depth GCC Solar Photovoltaic Industry Market Outlook
The GCC solar PV market is poised for sustained growth, driven by supportive government policies, technological advancements, and increasing energy demand. Strategic opportunities exist for players who can leverage innovative technologies, forge strategic partnerships, and adapt to evolving market dynamics. The long-term potential is substantial, with significant growth anticipated across all segments, particularly in the utility and C&I sectors. The market is expected to reach xx million units by 2033.
GCC Solar Photovoltaic Industry Segmentation
-
1. Deployment
- 1.1. Utility
- 1.2. Commercial and Industrial
- 1.3. Residential
-
2. Geography
- 2.1. United Arab Emirates
- 2.2. Saudi Arabia
- 2.3. Rest of GCC
GCC Solar Photovoltaic Industry Segmentation By Geography
- 1. United Arab Emirates
- 2. Saudi Arabia
- 3. Rest of GCC

GCC Solar Photovoltaic Industry REPORT HIGHLIGHTS
| Aspects | Details |
|---|---|
| Study Period | 2019-2033 |
| Base Year | 2024 |
| Estimated Year | 2025 |
| Forecast Period | 2025-2033 |
| Historical Period | 2019-2024 |
| Growth Rate | CAGR of > 12.50% from 2019-2033 |
| Segmentation |
|
Table of Contents
- 1. Introduction
- 1.1. Research Scope
- 1.2. Market Segmentation
- 1.3. Research Methodology
- 1.4. Definitions and Assumptions
- 2. Executive Summary
- 2.1. Introduction
- 3. Market Dynamics
- 3.1. Introduction
- 3.2. Market Drivers
- 3.2.1. 4.; Increasing Solar Energy Demand4.; Declining Cost of Solar PV Systems
- 3.3. Market Restrains
- 3.3.1. 4.; Strong Dependence on Prevailing Weather Condition
- 3.4. Market Trends
- 3.4.1. Utility Sector as a Significant Sector
- 4. Market Factor Analysis
- 4.1. Porters Five Forces
- 4.2. Supply/Value Chain
- 4.3. PESTEL analysis
- 4.4. Market Entropy
- 4.5. Patent/Trademark Analysis
- 5. Global GCC Solar Photovoltaic Industry Analysis, Insights and Forecast, 2019-2031
- 5.1. Market Analysis, Insights and Forecast - by Deployment
- 5.1.1. Utility
- 5.1.2. Commercial and Industrial
- 5.1.3. Residential
- 5.2. Market Analysis, Insights and Forecast - by Geography
- 5.2.1. United Arab Emirates
- 5.2.2. Saudi Arabia
- 5.2.3. Rest of GCC
- 5.3. Market Analysis, Insights and Forecast - by Region
- 5.3.1. United Arab Emirates
- 5.3.2. Saudi Arabia
- 5.3.3. Rest of GCC
- 5.1. Market Analysis, Insights and Forecast - by Deployment
- 6. United Arab Emirates GCC Solar Photovoltaic Industry Analysis, Insights and Forecast, 2019-2031
- 6.1. Market Analysis, Insights and Forecast - by Deployment
- 6.1.1. Utility
- 6.1.2. Commercial and Industrial
- 6.1.3. Residential
- 6.2. Market Analysis, Insights and Forecast - by Geography
- 6.2.1. United Arab Emirates
- 6.2.2. Saudi Arabia
- 6.2.3. Rest of GCC
- 6.1. Market Analysis, Insights and Forecast - by Deployment
- 7. Saudi Arabia GCC Solar Photovoltaic Industry Analysis, Insights and Forecast, 2019-2031
- 7.1. Market Analysis, Insights and Forecast - by Deployment
- 7.1.1. Utility
- 7.1.2. Commercial and Industrial
- 7.1.3. Residential
- 7.2. Market Analysis, Insights and Forecast - by Geography
- 7.2.1. United Arab Emirates
- 7.2.2. Saudi Arabia
- 7.2.3. Rest of GCC
- 7.1. Market Analysis, Insights and Forecast - by Deployment
- 8. Rest of GCC GCC Solar Photovoltaic Industry Analysis, Insights and Forecast, 2019-2031
- 8.1. Market Analysis, Insights and Forecast - by Deployment
- 8.1.1. Utility
- 8.1.2. Commercial and Industrial
- 8.1.3. Residential
- 8.2. Market Analysis, Insights and Forecast - by Geography
- 8.2.1. United Arab Emirates
- 8.2.2. Saudi Arabia
- 8.2.3. Rest of GCC
- 8.1. Market Analysis, Insights and Forecast - by Deployment
- 9. North America GCC Solar Photovoltaic Industry Analysis, Insights and Forecast, 2019-2031
- 9.1. Market Analysis, Insights and Forecast - By Country/Sub-region
- 9.1.1 United States
- 9.1.2 Canada
- 9.1.3 Mexico
- 10. Europe GCC Solar Photovoltaic Industry Analysis, Insights and Forecast, 2019-2031
- 10.1. Market Analysis, Insights and Forecast - By Country/Sub-region
- 10.1.1 Germany
- 10.1.2 United Kingdom
- 10.1.3 France
- 10.1.4 Spain
- 10.1.5 Italy
- 10.1.6 Spain
- 10.1.7 Belgium
- 10.1.8 Netherland
- 10.1.9 Nordics
- 10.1.10 Rest of Europe
- 11. Asia Pacific GCC Solar Photovoltaic Industry Analysis, Insights and Forecast, 2019-2031
- 11.1. Market Analysis, Insights and Forecast - By Country/Sub-region
- 11.1.1 China
- 11.1.2 Japan
- 11.1.3 India
- 11.1.4 South Korea
- 11.1.5 Southeast Asia
- 11.1.6 Australia
- 11.1.7 Indonesia
- 11.1.8 Phillipes
- 11.1.9 Singapore
- 11.1.10 Thailandc
- 11.1.11 Rest of Asia Pacific
- 12. South America GCC Solar Photovoltaic Industry Analysis, Insights and Forecast, 2019-2031
- 12.1. Market Analysis, Insights and Forecast - By Country/Sub-region
- 12.1.1 Brazil
- 12.1.2 Argentina
- 12.1.3 Peru
- 12.1.4 Chile
- 12.1.5 Colombia
- 12.1.6 Ecuador
- 12.1.7 Venezuela
- 12.1.8 Rest of South America
- 13. North America GCC Solar Photovoltaic Industry Analysis, Insights and Forecast, 2019-2031
- 13.1. Market Analysis, Insights and Forecast - By Country/Sub-region
- 13.1.1 United States
- 13.1.2 Canada
- 13.1.3 Mexico
- 14. MEA GCC Solar Photovoltaic Industry Analysis, Insights and Forecast, 2019-2031
- 14.1. Market Analysis, Insights and Forecast - By Country/Sub-region
- 14.1.1 United Arab Emirates
- 14.1.2 Saudi Arabia
- 14.1.3 South Africa
- 14.1.4 Rest of Middle East and Africa
- 15. Competitive Analysis
- 15.1. Global Market Share Analysis 2024
- 15.2. Company Profiles
- 15.2.1 JinkoSolar Holding Co Ltd
- 15.2.1.1. Overview
- 15.2.1.2. Products
- 15.2.1.3. SWOT Analysis
- 15.2.1.4. Recent Developments
- 15.2.1.5. Financials (Based on Availability)
- 15.2.2 First Solar Inc
- 15.2.2.1. Overview
- 15.2.2.2. Products
- 15.2.2.3. SWOT Analysis
- 15.2.2.4. Recent Developments
- 15.2.2.5. Financials (Based on Availability)
- 15.2.3 Trina Solar Co Ltd
- 15.2.3.1. Overview
- 15.2.3.2. Products
- 15.2.3.3. SWOT Analysis
- 15.2.3.4. Recent Developments
- 15.2.3.5. Financials (Based on Availability)
- 15.2.4 Echo Solar Panels Manufacturing LLC
- 15.2.4.1. Overview
- 15.2.4.2. Products
- 15.2.4.3. SWOT Analysis
- 15.2.4.4. Recent Developments
- 15.2.4.5. Financials (Based on Availability)
- 15.2.5 Emirates Insolaire*List Not Exhaustive
- 15.2.5.1. Overview
- 15.2.5.2. Products
- 15.2.5.3. SWOT Analysis
- 15.2.5.4. Recent Developments
- 15.2.5.5. Financials (Based on Availability)
- 15.2.6 Sunergy Solar
- 15.2.6.1. Overview
- 15.2.6.2. Products
- 15.2.6.3. SWOT Analysis
- 15.2.6.4. Recent Developments
- 15.2.6.5. Financials (Based on Availability)
- 15.2.7 Canadian Solar Inc
- 15.2.7.1. Overview
- 15.2.7.2. Products
- 15.2.7.3. SWOT Analysis
- 15.2.7.4. Recent Developments
- 15.2.7.5. Financials (Based on Availability)
- 15.2.8 Dubai Electricity and Water Authority
- 15.2.8.1. Overview
- 15.2.8.2. Products
- 15.2.8.3. SWOT Analysis
- 15.2.8.4. Recent Developments
- 15.2.8.5. Financials (Based on Availability)
- 15.2.9 Masdar Abu Dhabi Future Energy Company
- 15.2.9.1. Overview
- 15.2.9.2. Products
- 15.2.9.3. SWOT Analysis
- 15.2.9.4. Recent Developments
- 15.2.9.5. Financials (Based on Availability)
- 15.2.10 ACWA Power
- 15.2.10.1. Overview
- 15.2.10.2. Products
- 15.2.10.3. SWOT Analysis
- 15.2.10.4. Recent Developments
- 15.2.10.5. Financials (Based on Availability)
- 15.2.1 JinkoSolar Holding Co Ltd
List of Figures
- Figure 1: Global GCC Solar Photovoltaic Industry Revenue Breakdown (Million, %) by Region 2024 & 2032
- Figure 2: North America GCC Solar Photovoltaic Industry Revenue (Million), by Country 2024 & 2032
- Figure 3: North America GCC Solar Photovoltaic Industry Revenue Share (%), by Country 2024 & 2032
- Figure 4: Europe GCC Solar Photovoltaic Industry Revenue (Million), by Country 2024 & 2032
- Figure 5: Europe GCC Solar Photovoltaic Industry Revenue Share (%), by Country 2024 & 2032
- Figure 6: Asia Pacific GCC Solar Photovoltaic Industry Revenue (Million), by Country 2024 & 2032
- Figure 7: Asia Pacific GCC Solar Photovoltaic Industry Revenue Share (%), by Country 2024 & 2032
- Figure 8: South America GCC Solar Photovoltaic Industry Revenue (Million), by Country 2024 & 2032
- Figure 9: South America GCC Solar Photovoltaic Industry Revenue Share (%), by Country 2024 & 2032
- Figure 10: North America GCC Solar Photovoltaic Industry Revenue (Million), by Country 2024 & 2032
- Figure 11: North America GCC Solar Photovoltaic Industry Revenue Share (%), by Country 2024 & 2032
- Figure 12: MEA GCC Solar Photovoltaic Industry Revenue (Million), by Country 2024 & 2032
- Figure 13: MEA GCC Solar Photovoltaic Industry Revenue Share (%), by Country 2024 & 2032
- Figure 14: United Arab Emirates GCC Solar Photovoltaic Industry Revenue (Million), by Deployment 2024 & 2032
- Figure 15: United Arab Emirates GCC Solar Photovoltaic Industry Revenue Share (%), by Deployment 2024 & 2032
- Figure 16: United Arab Emirates GCC Solar Photovoltaic Industry Revenue (Million), by Geography 2024 & 2032
- Figure 17: United Arab Emirates GCC Solar Photovoltaic Industry Revenue Share (%), by Geography 2024 & 2032
- Figure 18: United Arab Emirates GCC Solar Photovoltaic Industry Revenue (Million), by Country 2024 & 2032
- Figure 19: United Arab Emirates GCC Solar Photovoltaic Industry Revenue Share (%), by Country 2024 & 2032
- Figure 20: Saudi Arabia GCC Solar Photovoltaic Industry Revenue (Million), by Deployment 2024 & 2032
- Figure 21: Saudi Arabia GCC Solar Photovoltaic Industry Revenue Share (%), by Deployment 2024 & 2032
- Figure 22: Saudi Arabia GCC Solar Photovoltaic Industry Revenue (Million), by Geography 2024 & 2032
- Figure 23: Saudi Arabia GCC Solar Photovoltaic Industry Revenue Share (%), by Geography 2024 & 2032
- Figure 24: Saudi Arabia GCC Solar Photovoltaic Industry Revenue (Million), by Country 2024 & 2032
- Figure 25: Saudi Arabia GCC Solar Photovoltaic Industry Revenue Share (%), by Country 2024 & 2032
- Figure 26: Rest of GCC GCC Solar Photovoltaic Industry Revenue (Million), by Deployment 2024 & 2032
- Figure 27: Rest of GCC GCC Solar Photovoltaic Industry Revenue Share (%), by Deployment 2024 & 2032
- Figure 28: Rest of GCC GCC Solar Photovoltaic Industry Revenue (Million), by Geography 2024 & 2032
- Figure 29: Rest of GCC GCC Solar Photovoltaic Industry Revenue Share (%), by Geography 2024 & 2032
- Figure 30: Rest of GCC GCC Solar Photovoltaic Industry Revenue (Million), by Country 2024 & 2032
- Figure 31: Rest of GCC GCC Solar Photovoltaic Industry Revenue Share (%), by Country 2024 & 2032
List of Tables
- Table 1: Global GCC Solar Photovoltaic Industry Revenue Million Forecast, by Region 2019 & 2032
- Table 2: Global GCC Solar Photovoltaic Industry Revenue Million Forecast, by Deployment 2019 & 2032
- Table 3: Global GCC Solar Photovoltaic Industry Revenue Million Forecast, by Geography 2019 & 2032
- Table 4: Global GCC Solar Photovoltaic Industry Revenue Million Forecast, by Region 2019 & 2032
- Table 5: Global GCC Solar Photovoltaic Industry Revenue Million Forecast, by Country 2019 & 2032
- Table 6: United States GCC Solar Photovoltaic Industry Revenue (Million) Forecast, by Application 2019 & 2032
- Table 7: Canada GCC Solar Photovoltaic Industry Revenue (Million) Forecast, by Application 2019 & 2032
- Table 8: Mexico GCC Solar Photovoltaic Industry Revenue (Million) Forecast, by Application 2019 & 2032
- Table 9: Global GCC Solar Photovoltaic Industry Revenue Million Forecast, by Country 2019 & 2032
- Table 10: Germany GCC Solar Photovoltaic Industry Revenue (Million) Forecast, by Application 2019 & 2032
- Table 11: United Kingdom GCC Solar Photovoltaic Industry Revenue (Million) Forecast, by Application 2019 & 2032
- Table 12: France GCC Solar Photovoltaic Industry Revenue (Million) Forecast, by Application 2019 & 2032
- Table 13: Spain GCC Solar Photovoltaic Industry Revenue (Million) Forecast, by Application 2019 & 2032
- Table 14: Italy GCC Solar Photovoltaic Industry Revenue (Million) Forecast, by Application 2019 & 2032
- Table 15: Spain GCC Solar Photovoltaic Industry Revenue (Million) Forecast, by Application 2019 & 2032
- Table 16: Belgium GCC Solar Photovoltaic Industry Revenue (Million) Forecast, by Application 2019 & 2032
- Table 17: Netherland GCC Solar Photovoltaic Industry Revenue (Million) Forecast, by Application 2019 & 2032
- Table 18: Nordics GCC Solar Photovoltaic Industry Revenue (Million) Forecast, by Application 2019 & 2032
- Table 19: Rest of Europe GCC Solar Photovoltaic Industry Revenue (Million) Forecast, by Application 2019 & 2032
- Table 20: Global GCC Solar Photovoltaic Industry Revenue Million Forecast, by Country 2019 & 2032
- Table 21: China GCC Solar Photovoltaic Industry Revenue (Million) Forecast, by Application 2019 & 2032
- Table 22: Japan GCC Solar Photovoltaic Industry Revenue (Million) Forecast, by Application 2019 & 2032
- Table 23: India GCC Solar Photovoltaic Industry Revenue (Million) Forecast, by Application 2019 & 2032
- Table 24: South Korea GCC Solar Photovoltaic Industry Revenue (Million) Forecast, by Application 2019 & 2032
- Table 25: Southeast Asia GCC Solar Photovoltaic Industry Revenue (Million) Forecast, by Application 2019 & 2032
- Table 26: Australia GCC Solar Photovoltaic Industry Revenue (Million) Forecast, by Application 2019 & 2032
- Table 27: Indonesia GCC Solar Photovoltaic Industry Revenue (Million) Forecast, by Application 2019 & 2032
- Table 28: Phillipes GCC Solar Photovoltaic Industry Revenue (Million) Forecast, by Application 2019 & 2032
- Table 29: Singapore GCC Solar Photovoltaic Industry Revenue (Million) Forecast, by Application 2019 & 2032
- Table 30: Thailandc GCC Solar Photovoltaic Industry Revenue (Million) Forecast, by Application 2019 & 2032
- Table 31: Rest of Asia Pacific GCC Solar Photovoltaic Industry Revenue (Million) Forecast, by Application 2019 & 2032
- Table 32: Global GCC Solar Photovoltaic Industry Revenue Million Forecast, by Country 2019 & 2032
- Table 33: Brazil GCC Solar Photovoltaic Industry Revenue (Million) Forecast, by Application 2019 & 2032
- Table 34: Argentina GCC Solar Photovoltaic Industry Revenue (Million) Forecast, by Application 2019 & 2032
- Table 35: Peru GCC Solar Photovoltaic Industry Revenue (Million) Forecast, by Application 2019 & 2032
- Table 36: Chile GCC Solar Photovoltaic Industry Revenue (Million) Forecast, by Application 2019 & 2032
- Table 37: Colombia GCC Solar Photovoltaic Industry Revenue (Million) Forecast, by Application 2019 & 2032
- Table 38: Ecuador GCC Solar Photovoltaic Industry Revenue (Million) Forecast, by Application 2019 & 2032
- Table 39: Venezuela GCC Solar Photovoltaic Industry Revenue (Million) Forecast, by Application 2019 & 2032
- Table 40: Rest of South America GCC Solar Photovoltaic Industry Revenue (Million) Forecast, by Application 2019 & 2032
- Table 41: Global GCC Solar Photovoltaic Industry Revenue Million Forecast, by Country 2019 & 2032
- Table 42: United States GCC Solar Photovoltaic Industry Revenue (Million) Forecast, by Application 2019 & 2032
- Table 43: Canada GCC Solar Photovoltaic Industry Revenue (Million) Forecast, by Application 2019 & 2032
- Table 44: Mexico GCC Solar Photovoltaic Industry Revenue (Million) Forecast, by Application 2019 & 2032
- Table 45: Global GCC Solar Photovoltaic Industry Revenue Million Forecast, by Country 2019 & 2032
- Table 46: United Arab Emirates GCC Solar Photovoltaic Industry Revenue (Million) Forecast, by Application 2019 & 2032
- Table 47: Saudi Arabia GCC Solar Photovoltaic Industry Revenue (Million) Forecast, by Application 2019 & 2032
- Table 48: South Africa GCC Solar Photovoltaic Industry Revenue (Million) Forecast, by Application 2019 & 2032
- Table 49: Rest of Middle East and Africa GCC Solar Photovoltaic Industry Revenue (Million) Forecast, by Application 2019 & 2032
- Table 50: Global GCC Solar Photovoltaic Industry Revenue Million Forecast, by Deployment 2019 & 2032
- Table 51: Global GCC Solar Photovoltaic Industry Revenue Million Forecast, by Geography 2019 & 2032
- Table 52: Global GCC Solar Photovoltaic Industry Revenue Million Forecast, by Country 2019 & 2032
- Table 53: Global GCC Solar Photovoltaic Industry Revenue Million Forecast, by Deployment 2019 & 2032
- Table 54: Global GCC Solar Photovoltaic Industry Revenue Million Forecast, by Geography 2019 & 2032
- Table 55: Global GCC Solar Photovoltaic Industry Revenue Million Forecast, by Country 2019 & 2032
- Table 56: Global GCC Solar Photovoltaic Industry Revenue Million Forecast, by Deployment 2019 & 2032
- Table 57: Global GCC Solar Photovoltaic Industry Revenue Million Forecast, by Geography 2019 & 2032
- Table 58: Global GCC Solar Photovoltaic Industry Revenue Million Forecast, by Country 2019 & 2032
Frequently Asked Questions
1. What is the projected Compound Annual Growth Rate (CAGR) of the GCC Solar Photovoltaic Industry?
The projected CAGR is approximately > 12.50%.
2. Which companies are prominent players in the GCC Solar Photovoltaic Industry?
Key companies in the market include JinkoSolar Holding Co Ltd, First Solar Inc, Trina Solar Co Ltd, Echo Solar Panels Manufacturing LLC, Emirates Insolaire*List Not Exhaustive, Sunergy Solar, Canadian Solar Inc, Dubai Electricity and Water Authority, Masdar Abu Dhabi Future Energy Company, ACWA Power.
3. What are the main segments of the GCC Solar Photovoltaic Industry?
The market segments include Deployment, Geography.
4. Can you provide details about the market size?
The market size is estimated to be USD XX Million as of 2022.
5. What are some drivers contributing to market growth?
4.; Increasing Solar Energy Demand4.; Declining Cost of Solar PV Systems.
6. What are the notable trends driving market growth?
Utility Sector as a Significant Sector.
7. Are there any restraints impacting market growth?
4.; Strong Dependence on Prevailing Weather Condition.
8. Can you provide examples of recent developments in the market?
In April 2021, ACWA Power inaugurated the 300 MW Sakaka PV IPP, the country's first utility-scale renewable energy project, at an investment cost of SAR 1.2 billion. The project was awarded to ACWA Power at a record-breaking tariff of USD 2.3417 cents/kWh (8.781 halalas/kWh).
9. What pricing options are available for accessing the report?
Pricing options include single-user, multi-user, and enterprise licenses priced at USD 4750, USD 5250, and USD 8750 respectively.
10. Is the market size provided in terms of value or volume?
The market size is provided in terms of value, measured in Million.
11. Are there any specific market keywords associated with the report?
Yes, the market keyword associated with the report is "GCC Solar Photovoltaic Industry," which aids in identifying and referencing the specific market segment covered.
12. How do I determine which pricing option suits my needs best?
The pricing options vary based on user requirements and access needs. Individual users may opt for single-user licenses, while businesses requiring broader access may choose multi-user or enterprise licenses for cost-effective access to the report.
13. Are there any additional resources or data provided in the GCC Solar Photovoltaic Industry report?
While the report offers comprehensive insights, it's advisable to review the specific contents or supplementary materials provided to ascertain if additional resources or data are available.
14. How can I stay updated on further developments or reports in the GCC Solar Photovoltaic Industry?
To stay informed about further developments, trends, and reports in the GCC Solar Photovoltaic Industry, consider subscribing to industry newsletters, following relevant companies and organizations, or regularly checking reputable industry news sources and publications.
Methodology
Step 1 - Identification of Relevant Samples Size from Population Database


Step 2 - Approaches for Defining Global Market Size (Value, Volume* & Price*)

Note*: In applicable scenarios
Step 3 - Data Sources
Primary Research
- Web Analytics
- Survey Reports
- Research Institute
- Latest Research Reports
- Opinion Leaders
Secondary Research
- Annual Reports
- White Paper
- Latest Press Release
- Industry Association
- Paid Database
- Investor Presentations

Step 4 - Data Triangulation
Involves using different sources of information in order to increase the validity of a study
These sources are likely to be stakeholders in a program - participants, other researchers, program staff, other community members, and so on.
Then we put all data in single framework & apply various statistical tools to find out the dynamic on the market.
During the analysis stage, feedback from the stakeholder groups would be compared to determine areas of agreement as well as areas of divergence
