

Key Insights
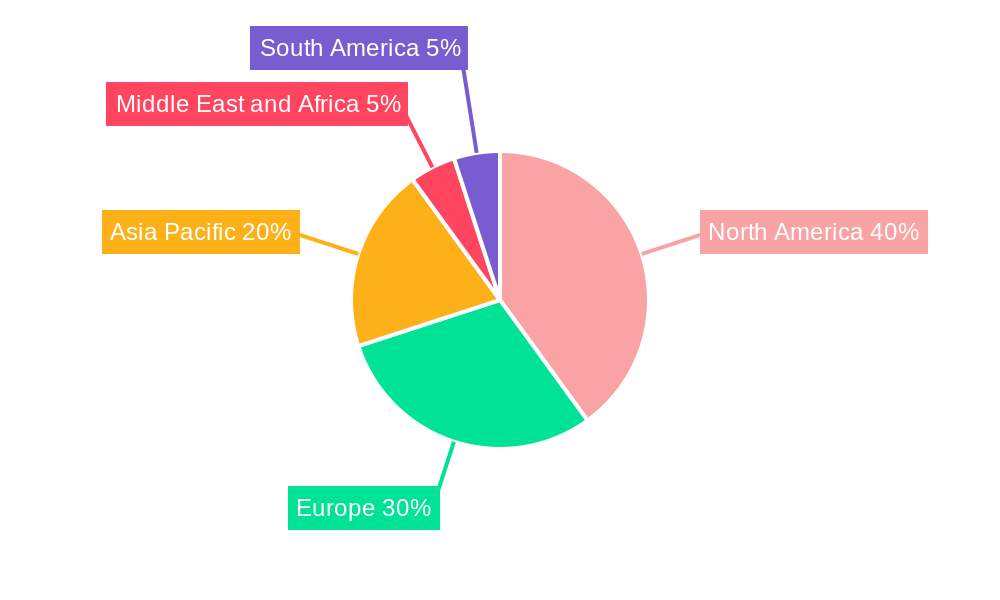
The global ophthalmology PACS (Picture Archiving and Communication Systems) market is experiencing robust growth, driven by the increasing prevalence of ophthalmic diseases, technological advancements in imaging techniques, and the rising adoption of electronic health records (EHRs). The market's substantial size, estimated at $XX million in 2025, is projected to expand significantly, fueled by an 8% compound annual growth rate (CAGR) throughout the forecast period (2025-2033). Key growth drivers include the increasing demand for efficient image management and storage solutions within ophthalmology practices, the need for improved collaboration among healthcare professionals, and the rising adoption of cloud-based PACS solutions offering enhanced accessibility and scalability. The market is segmented by type (integrated and standalone PACS), delivery model (cloud-based and on-premise), and end-user (hospitals & clinics, ambulatory surgical centers). Cloud-based PACS is gaining significant traction due to its cost-effectiveness and flexibility, while integrated PACS solutions are preferred for comprehensive workflow management. North America currently holds a substantial market share due to advanced healthcare infrastructure and high adoption rates of digital imaging technologies. However, the Asia-Pacific region is poised for rapid expansion in the coming years, driven by increasing healthcare expenditure and rising awareness of ophthalmic health. While the market faces certain restraints, including high initial investment costs for some systems and concerns regarding data security, the overall outlook remains positive, with significant growth potential across diverse geographical regions.
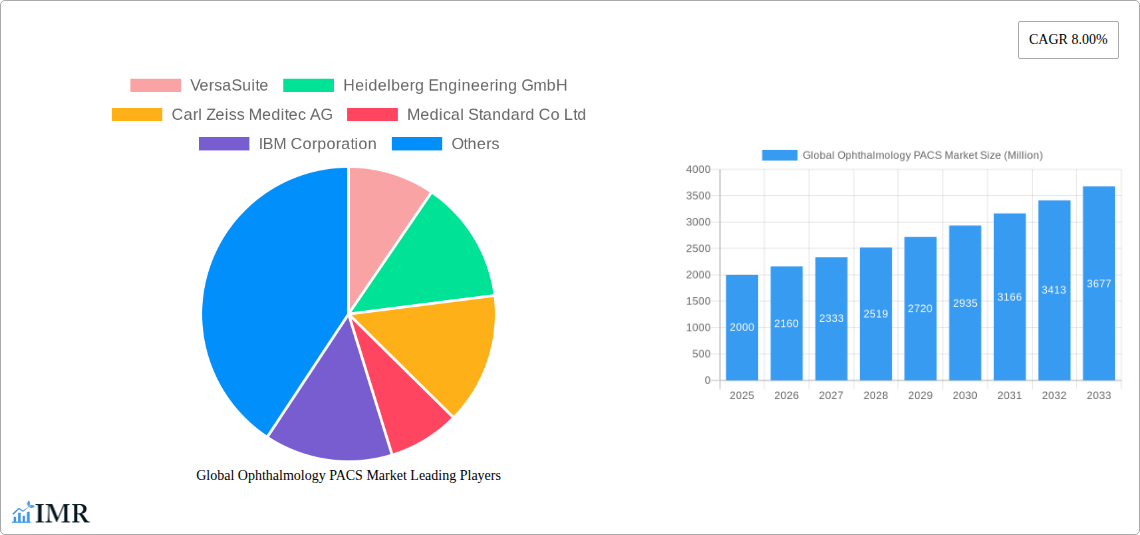
The competitive landscape is characterized by a mix of established players and emerging companies offering innovative PACS solutions. Key players like VersaSuite, Heidelberg Engineering GmbH, Carl Zeiss Meditec AG, Medical Standard Co Ltd, IBM Corporation, Agfa-Gevaert N V, Visbion Limited, and Sonomed Escalon are actively engaged in developing advanced features, expanding their product portfolios, and forging strategic partnerships to strengthen their market positions. Future growth will be influenced by further technological advancements such as AI-powered image analysis, improved integration with other healthcare IT systems, and the expanding utilization of telehealth platforms for remote ophthalmic care. The market’s evolution will be closely tied to broader trends in digital healthcare, including the growing emphasis on data analytics and the increasing importance of interoperability standards to facilitate seamless data exchange.
Global Ophthalmology PACS Market: A Comprehensive Report (2019-2033)
This in-depth report provides a comprehensive analysis of the global ophthalmology PACS market, encompassing market dynamics, growth trends, regional segmentation, product landscape, key players, and future outlook. The study period covers 2019-2033, with a base year of 2025 and a forecast period of 2025-2033. The report is essential for ophthalmology professionals, investors, and industry stakeholders seeking to understand and capitalize on the market's significant growth potential. The market is segmented by type (Integrated PACS, Standalone PACS), delivery model (Cloud-Based, On-Premise), and end-user (Hospitals & Clinics, Ambulatory Surgical Centers). The parent market is the broader medical imaging PACS market, while the child market includes specialized ophthalmic imaging applications. The total market value is projected to reach xx Million by 2033.
Global Ophthalmology PACS Market Dynamics & Structure
The global ophthalmology PACS market is characterized by a moderately concentrated structure, with key players like VersaSuite, Heidelberg Engineering GmbH, Carl Zeiss Meditec AG, Medical Standard Co Ltd, IBM Corporation, Agfa-Gevaert N V, Visbion Limited, and Sonomed Escalon competing for market share. Technological innovation, particularly in AI-powered image analysis and cloud-based solutions, is a major driver. Regulatory frameworks, including HIPAA and GDPR compliance, significantly influence market practices. The increasing prevalence of ophthalmic diseases and the rising adoption of digital health technologies are key growth factors. Mergers and acquisitions (M&A) activity is moderate, with xx deals recorded between 2019 and 2024. Competition from alternative imaging technologies poses a challenge.
- Market Concentration: Moderately concentrated, with top 5 players holding approximately xx% market share in 2024.
- Technological Innovation: AI-powered image analysis, cloud-based solutions, and integration with EMR systems are key drivers.
- Regulatory Landscape: HIPAA, GDPR, and other regional regulations influence market dynamics.
- Competitive Substitutes: Traditional film-based imaging and other diagnostic methods.
- End-User Demographics: Aging population, rising prevalence of eye diseases, and increased healthcare spending fuel market growth.
- M&A Trends: xx M&A deals in 2019-2024, suggesting consolidation and strategic partnerships.
- Innovation Barriers: High R&D costs and regulatory approvals.
Global Ophthalmology PACS Market Growth Trends & Insights
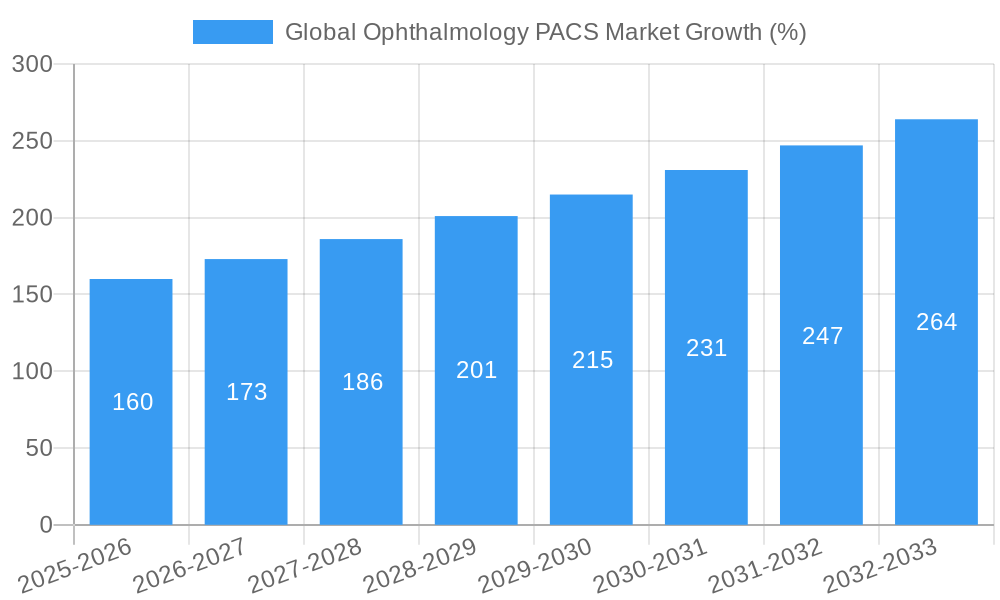
The global ophthalmology PACS market experienced significant growth from 2019 to 2024, expanding from xx Million to xx Million at a CAGR of xx%. This growth is primarily attributed to the increasing adoption of PACS systems in ophthalmology clinics and hospitals, driven by improved efficiency, enhanced image management, and improved collaboration among healthcare professionals. Technological advancements, such as AI-powered image analysis tools and the growing integration of PACS with other healthcare IT systems, have significantly accelerated market expansion. The shift towards cloud-based PACS solutions is also gaining momentum, offering scalability, cost-effectiveness, and remote access capabilities. The market is expected to maintain a robust growth trajectory throughout the forecast period (2025-2033), reaching xx Million by 2033, driven by factors such as increasing prevalence of chronic eye diseases, technological innovations, and rising investments in healthcare infrastructure. Market penetration in developing economies is expected to increase substantially.
Dominant Regions, Countries, or Segments in Global Ophthalmology PACS Market
North America currently dominates the global ophthalmology PACS market, driven by high healthcare expenditure, advanced healthcare infrastructure, and early adoption of advanced technologies. However, the Asia-Pacific region is projected to witness the fastest growth rate over the forecast period due to increasing healthcare awareness, rising prevalence of eye diseases, and government initiatives supporting healthcare infrastructure development.
- Type: Integrated PACS holds a larger market share than standalone PACS due to enhanced functionalities and better integration with other systems.
- Delivery Model: Cloud-based PACS is expected to witness faster growth than on-premise models due to advantages in scalability, accessibility, and reduced capital expenditure.
- End-User: Hospitals & Clinics segment currently holds the largest market share followed by ambulatory surgical centers, owing to higher volume of patients and advanced infrastructure.
- Key Drivers: Increasing prevalence of age-related eye diseases, government funding for healthcare infrastructure, growing adoption of digital health technologies, improving healthcare infrastructure in developing countries.
Global Ophthalmology PACS Market Product Landscape
Ophthalmology PACS systems offer advanced features including image acquisition, storage, retrieval, and viewing capabilities, along with advanced image analysis tools. Many systems integrate with Electronic Medical Records (EMR) systems for seamless patient data management. Technological advancements like AI-powered diagnostic assistance, enhanced image quality, and improved workflow efficiency are shaping the product landscape. Unique selling propositions include advanced image processing algorithms, intuitive user interfaces, and robust security features.
Key Drivers, Barriers & Challenges in Global Ophthalmology PACS Market
Key Drivers:
- Rising prevalence of ophthalmic diseases
- Increasing adoption of digital health technologies
- Growing demand for efficient image management solutions
- Government initiatives promoting healthcare infrastructure development
Challenges & Restraints:
- High initial investment costs for PACS implementation
- Complexity of integration with existing healthcare IT infrastructure
- Concerns regarding data security and privacy
- Limited awareness and adoption in certain regions
Emerging Opportunities in Global Ophthalmology PACS Market
- Expansion into untapped markets in developing countries
- Integration of telehealth platforms with PACS systems
- Development of AI-powered diagnostic tools for improved accuracy and efficiency
- Growing demand for cloud-based PACS solutions offering flexibility and scalability
Growth Accelerators in the Global Ophthalmology PACS Market Industry
Technological advancements, strategic partnerships between PACS vendors and ophthalmology practices, and increasing government initiatives promoting the use of digital health technologies are major growth accelerators in the global ophthalmology PACS market. Expansion into emerging markets and the development of tailored solutions for specific ophthalmic applications are also expected to contribute to market growth.
Key Players Shaping the Global Ophthalmology PACS Market Market
- VersaSuite
- Heidelberg Engineering GmbH
- Carl Zeiss Meditec AG
- Medical Standard Co Ltd
- IBM Corporation
- Agfa-Gevaert N V
- Visbion Limited
- Sonomed Escalon
Notable Milestones in Global Ophthalmology PACS Market Sector
- April 2022: ZEISS Medical Technology's QUATERA 700 received FDA approval, enhancing surgical workflow efficiency.
- May 2022: OMNY Health partnered with ophthalmology practices to launch a real-world data ecosystem for collaborative research.
In-Depth Global Ophthalmology PACS Market Market Outlook
The global ophthalmology PACS market is poised for sustained growth, driven by increasing demand for advanced imaging solutions, rising adoption of cloud-based systems, and the integration of AI-powered diagnostic tools. Strategic partnerships and technological innovations will further propel market expansion. The market presents significant opportunities for companies to develop innovative products and services catering to the evolving needs of ophthalmology professionals and patients.
Global Ophthalmology PACS Market Segmentation
-
1. Type
- 1.1. Integrated PACS
- 1.2. Standalone PACS
-
2. Delivery Model
- 2.1. Cloud-Based Model
- 2.2. On-Premise Model
-
3. End User
- 3.1. Hospitals & Clinics
- 3.2. Ambulatory Surgical Centers
Global Ophthalmology PACS Market Segmentation By Geography
-
1. North America
- 1.1. United States
- 1.2. Canada
- 1.3. Mexico
-
2. Europe
- 2.1. Germany
- 2.2. United Kingdom
- 2.3. France
- 2.4. Italy
- 2.5. Spain
- 2.6. Rest of Europe
-
3. Asia Pacific
- 3.1. China
- 3.2. Japan
- 3.3. India
- 3.4. Australia
- 3.5. South Korea
- 3.6. Rest of Asia Pacific
-
4. Middle East and Africa
- 4.1. GCC
- 4.2. South Africa
- 4.3. Rest of Middle East and Africa
-
5. South America
- 5.1. Brazil
- 5.2. Argentina
- 5.3. Rest of South America
Global Ophthalmology PACS Market REPORT HIGHLIGHTS
| Aspects | Details |
|---|---|
| Study Period | 2019-2033 |
| Base Year | 2024 |
| Estimated Year | 2025 |
| Forecast Period | 2025-2033 |
| Historical Period | 2019-2024 |
| Growth Rate | CAGR of 8.00% from 2019-2033 |
| Segmentation |
|
Table of Contents
- 1. Introduction
- 1.1. Research Scope
- 1.2. Market Segmentation
- 1.3. Research Methodology
- 1.4. Definitions and Assumptions
- 2. Executive Summary
- 2.1. Introduction
- 3. Market Dynamics
- 3.1. Introduction
- 3.2. Market Drivers
- 3.2.1. High Prevalence of Eye Diseases; Increasing Geriatric Population; Expansion of Teleophthalmology
- 3.3. Market Restrains
- 3.3.1. High Implementation and Maintenance Costs
- 3.4. Market Trends
- 3.4.1. Integrated PACS Segment is Expected to Show Better Growth Over the Forecast Years
- 4. Market Factor Analysis
- 4.1. Porters Five Forces
- 4.2. Supply/Value Chain
- 4.3. PESTEL analysis
- 4.4. Market Entropy
- 4.5. Patent/Trademark Analysis
- 5. Global Ophthalmology PACS Market Analysis, Insights and Forecast, 2019-2031
- 5.1. Market Analysis, Insights and Forecast - by Type
- 5.1.1. Integrated PACS
- 5.1.2. Standalone PACS
- 5.2. Market Analysis, Insights and Forecast - by Delivery Model
- 5.2.1. Cloud-Based Model
- 5.2.2. On-Premise Model
- 5.3. Market Analysis, Insights and Forecast - by End User
- 5.3.1. Hospitals & Clinics
- 5.3.2. Ambulatory Surgical Centers
- 5.4. Market Analysis, Insights and Forecast - by Region
- 5.4.1. North America
- 5.4.2. Europe
- 5.4.3. Asia Pacific
- 5.4.4. Middle East and Africa
- 5.4.5. South America
- 5.1. Market Analysis, Insights and Forecast - by Type
- 6. North America Global Ophthalmology PACS Market Analysis, Insights and Forecast, 2019-2031
- 6.1. Market Analysis, Insights and Forecast - by Type
- 6.1.1. Integrated PACS
- 6.1.2. Standalone PACS
- 6.2. Market Analysis, Insights and Forecast - by Delivery Model
- 6.2.1. Cloud-Based Model
- 6.2.2. On-Premise Model
- 6.3. Market Analysis, Insights and Forecast - by End User
- 6.3.1. Hospitals & Clinics
- 6.3.2. Ambulatory Surgical Centers
- 6.1. Market Analysis, Insights and Forecast - by Type
- 7. Europe Global Ophthalmology PACS Market Analysis, Insights and Forecast, 2019-2031
- 7.1. Market Analysis, Insights and Forecast - by Type
- 7.1.1. Integrated PACS
- 7.1.2. Standalone PACS
- 7.2. Market Analysis, Insights and Forecast - by Delivery Model
- 7.2.1. Cloud-Based Model
- 7.2.2. On-Premise Model
- 7.3. Market Analysis, Insights and Forecast - by End User
- 7.3.1. Hospitals & Clinics
- 7.3.2. Ambulatory Surgical Centers
- 7.1. Market Analysis, Insights and Forecast - by Type
- 8. Asia Pacific Global Ophthalmology PACS Market Analysis, Insights and Forecast, 2019-2031
- 8.1. Market Analysis, Insights and Forecast - by Type
- 8.1.1. Integrated PACS
- 8.1.2. Standalone PACS
- 8.2. Market Analysis, Insights and Forecast - by Delivery Model
- 8.2.1. Cloud-Based Model
- 8.2.2. On-Premise Model
- 8.3. Market Analysis, Insights and Forecast - by End User
- 8.3.1. Hospitals & Clinics
- 8.3.2. Ambulatory Surgical Centers
- 8.1. Market Analysis, Insights and Forecast - by Type
- 9. Middle East and Africa Global Ophthalmology PACS Market Analysis, Insights and Forecast, 2019-2031
- 9.1. Market Analysis, Insights and Forecast - by Type
- 9.1.1. Integrated PACS
- 9.1.2. Standalone PACS
- 9.2. Market Analysis, Insights and Forecast - by Delivery Model
- 9.2.1. Cloud-Based Model
- 9.2.2. On-Premise Model
- 9.3. Market Analysis, Insights and Forecast - by End User
- 9.3.1. Hospitals & Clinics
- 9.3.2. Ambulatory Surgical Centers
- 9.1. Market Analysis, Insights and Forecast - by Type
- 10. South America Global Ophthalmology PACS Market Analysis, Insights and Forecast, 2019-2031
- 10.1. Market Analysis, Insights and Forecast - by Type
- 10.1.1. Integrated PACS
- 10.1.2. Standalone PACS
- 10.2. Market Analysis, Insights and Forecast - by Delivery Model
- 10.2.1. Cloud-Based Model
- 10.2.2. On-Premise Model
- 10.3. Market Analysis, Insights and Forecast - by End User
- 10.3.1. Hospitals & Clinics
- 10.3.2. Ambulatory Surgical Centers
- 10.1. Market Analysis, Insights and Forecast - by Type
- 11. North America Global Ophthalmology PACS Market Analysis, Insights and Forecast, 2019-2031
- 11.1. Market Analysis, Insights and Forecast - By Country/Sub-region
- 11.1.1 United States
- 11.1.2 Canada
- 11.1.3 Mexico
- 12. Europe Global Ophthalmology PACS Market Analysis, Insights and Forecast, 2019-2031
- 12.1. Market Analysis, Insights and Forecast - By Country/Sub-region
- 12.1.1 Germany
- 12.1.2 United Kingdom
- 12.1.3 France
- 12.1.4 Italy
- 12.1.5 Spain
- 12.1.6 Rest of Europe
- 13. Asia Pacific Global Ophthalmology PACS Market Analysis, Insights and Forecast, 2019-2031
- 13.1. Market Analysis, Insights and Forecast - By Country/Sub-region
- 13.1.1 China
- 13.1.2 Japan
- 13.1.3 India
- 13.1.4 Australia
- 13.1.5 South Korea
- 13.1.6 Rest of Asia Pacific
- 14. Middle East and Africa Global Ophthalmology PACS Market Analysis, Insights and Forecast, 2019-2031
- 14.1. Market Analysis, Insights and Forecast - By Country/Sub-region
- 14.1.1 GCC
- 14.1.2 South Africa
- 14.1.3 Rest of Middle East and Africa
- 15. South America Global Ophthalmology PACS Market Analysis, Insights and Forecast, 2019-2031
- 15.1. Market Analysis, Insights and Forecast - By Country/Sub-region
- 15.1.1 Brazil
- 15.1.2 Argentina
- 15.1.3 Rest of South America
- 16. Competitive Analysis
- 16.1. Market Share Analysis 2024
- 16.2. Company Profiles
- 16.2.1 VersaSuite
- 16.2.1.1. Overview
- 16.2.1.2. Products
- 16.2.1.3. SWOT Analysis
- 16.2.1.4. Recent Developments
- 16.2.1.5. Financials (Based on Availability)
- 16.2.2 Heidelberg Engineering GmbH
- 16.2.2.1. Overview
- 16.2.2.2. Products
- 16.2.2.3. SWOT Analysis
- 16.2.2.4. Recent Developments
- 16.2.2.5. Financials (Based on Availability)
- 16.2.3 Carl Zeiss Meditec AG
- 16.2.3.1. Overview
- 16.2.3.2. Products
- 16.2.3.3. SWOT Analysis
- 16.2.3.4. Recent Developments
- 16.2.3.5. Financials (Based on Availability)
- 16.2.4 Medical Standard Co Ltd
- 16.2.4.1. Overview
- 16.2.4.2. Products
- 16.2.4.3. SWOT Analysis
- 16.2.4.4. Recent Developments
- 16.2.4.5. Financials (Based on Availability)
- 16.2.5 IBM Corporation
- 16.2.5.1. Overview
- 16.2.5.2. Products
- 16.2.5.3. SWOT Analysis
- 16.2.5.4. Recent Developments
- 16.2.5.5. Financials (Based on Availability)
- 16.2.6 Agfa-Gevaert N V
- 16.2.6.1. Overview
- 16.2.6.2. Products
- 16.2.6.3. SWOT Analysis
- 16.2.6.4. Recent Developments
- 16.2.6.5. Financials (Based on Availability)
- 16.2.7 Visbion Limited
- 16.2.7.1. Overview
- 16.2.7.2. Products
- 16.2.7.3. SWOT Analysis
- 16.2.7.4. Recent Developments
- 16.2.7.5. Financials (Based on Availability)
- 16.2.8 Sonomed Escalon
- 16.2.8.1. Overview
- 16.2.8.2. Products
- 16.2.8.3. SWOT Analysis
- 16.2.8.4. Recent Developments
- 16.2.8.5. Financials (Based on Availability)
- 16.2.1 VersaSuite
List of Figures
- Figure 1: Global Global Ophthalmology PACS Market Revenue Breakdown (Million, %) by Region 2024 & 2032
- Figure 2: Global Global Ophthalmology PACS Market Volume Breakdown (K Unit, %) by Region 2024 & 2032
- Figure 3: North America Global Ophthalmology PACS Market Revenue (Million), by Country 2024 & 2032
- Figure 4: North America Global Ophthalmology PACS Market Volume (K Unit), by Country 2024 & 2032
- Figure 5: North America Global Ophthalmology PACS Market Revenue Share (%), by Country 2024 & 2032
- Figure 6: North America Global Ophthalmology PACS Market Volume Share (%), by Country 2024 & 2032
- Figure 7: Europe Global Ophthalmology PACS Market Revenue (Million), by Country 2024 & 2032
- Figure 8: Europe Global Ophthalmology PACS Market Volume (K Unit), by Country 2024 & 2032
- Figure 9: Europe Global Ophthalmology PACS Market Revenue Share (%), by Country 2024 & 2032
- Figure 10: Europe Global Ophthalmology PACS Market Volume Share (%), by Country 2024 & 2032
- Figure 11: Asia Pacific Global Ophthalmology PACS Market Revenue (Million), by Country 2024 & 2032
- Figure 12: Asia Pacific Global Ophthalmology PACS Market Volume (K Unit), by Country 2024 & 2032
- Figure 13: Asia Pacific Global Ophthalmology PACS Market Revenue Share (%), by Country 2024 & 2032
- Figure 14: Asia Pacific Global Ophthalmology PACS Market Volume Share (%), by Country 2024 & 2032
- Figure 15: Middle East and Africa Global Ophthalmology PACS Market Revenue (Million), by Country 2024 & 2032
- Figure 16: Middle East and Africa Global Ophthalmology PACS Market Volume (K Unit), by Country 2024 & 2032
- Figure 17: Middle East and Africa Global Ophthalmology PACS Market Revenue Share (%), by Country 2024 & 2032
- Figure 18: Middle East and Africa Global Ophthalmology PACS Market Volume Share (%), by Country 2024 & 2032
- Figure 19: South America Global Ophthalmology PACS Market Revenue (Million), by Country 2024 & 2032
- Figure 20: South America Global Ophthalmology PACS Market Volume (K Unit), by Country 2024 & 2032
- Figure 21: South America Global Ophthalmology PACS Market Revenue Share (%), by Country 2024 & 2032
- Figure 22: South America Global Ophthalmology PACS Market Volume Share (%), by Country 2024 & 2032
- Figure 23: North America Global Ophthalmology PACS Market Revenue (Million), by Type 2024 & 2032
- Figure 24: North America Global Ophthalmology PACS Market Volume (K Unit), by Type 2024 & 2032
- Figure 25: North America Global Ophthalmology PACS Market Revenue Share (%), by Type 2024 & 2032
- Figure 26: North America Global Ophthalmology PACS Market Volume Share (%), by Type 2024 & 2032
- Figure 27: North America Global Ophthalmology PACS Market Revenue (Million), by Delivery Model 2024 & 2032
- Figure 28: North America Global Ophthalmology PACS Market Volume (K Unit), by Delivery Model 2024 & 2032
- Figure 29: North America Global Ophthalmology PACS Market Revenue Share (%), by Delivery Model 2024 & 2032
- Figure 30: North America Global Ophthalmology PACS Market Volume Share (%), by Delivery Model 2024 & 2032
- Figure 31: North America Global Ophthalmology PACS Market Revenue (Million), by End User 2024 & 2032
- Figure 32: North America Global Ophthalmology PACS Market Volume (K Unit), by End User 2024 & 2032
- Figure 33: North America Global Ophthalmology PACS Market Revenue Share (%), by End User 2024 & 2032
- Figure 34: North America Global Ophthalmology PACS Market Volume Share (%), by End User 2024 & 2032
- Figure 35: North America Global Ophthalmology PACS Market Revenue (Million), by Country 2024 & 2032
- Figure 36: North America Global Ophthalmology PACS Market Volume (K Unit), by Country 2024 & 2032
- Figure 37: North America Global Ophthalmology PACS Market Revenue Share (%), by Country 2024 & 2032
- Figure 38: North America Global Ophthalmology PACS Market Volume Share (%), by Country 2024 & 2032
- Figure 39: Europe Global Ophthalmology PACS Market Revenue (Million), by Type 2024 & 2032
- Figure 40: Europe Global Ophthalmology PACS Market Volume (K Unit), by Type 2024 & 2032
- Figure 41: Europe Global Ophthalmology PACS Market Revenue Share (%), by Type 2024 & 2032
- Figure 42: Europe Global Ophthalmology PACS Market Volume Share (%), by Type 2024 & 2032
- Figure 43: Europe Global Ophthalmology PACS Market Revenue (Million), by Delivery Model 2024 & 2032
- Figure 44: Europe Global Ophthalmology PACS Market Volume (K Unit), by Delivery Model 2024 & 2032
- Figure 45: Europe Global Ophthalmology PACS Market Revenue Share (%), by Delivery Model 2024 & 2032
- Figure 46: Europe Global Ophthalmology PACS Market Volume Share (%), by Delivery Model 2024 & 2032
- Figure 47: Europe Global Ophthalmology PACS Market Revenue (Million), by End User 2024 & 2032
- Figure 48: Europe Global Ophthalmology PACS Market Volume (K Unit), by End User 2024 & 2032
- Figure 49: Europe Global Ophthalmology PACS Market Revenue Share (%), by End User 2024 & 2032
- Figure 50: Europe Global Ophthalmology PACS Market Volume Share (%), by End User 2024 & 2032
- Figure 51: Europe Global Ophthalmology PACS Market Revenue (Million), by Country 2024 & 2032
- Figure 52: Europe Global Ophthalmology PACS Market Volume (K Unit), by Country 2024 & 2032
- Figure 53: Europe Global Ophthalmology PACS Market Revenue Share (%), by Country 2024 & 2032
- Figure 54: Europe Global Ophthalmology PACS Market Volume Share (%), by Country 2024 & 2032
- Figure 55: Asia Pacific Global Ophthalmology PACS Market Revenue (Million), by Type 2024 & 2032
- Figure 56: Asia Pacific Global Ophthalmology PACS Market Volume (K Unit), by Type 2024 & 2032
- Figure 57: Asia Pacific Global Ophthalmology PACS Market Revenue Share (%), by Type 2024 & 2032
- Figure 58: Asia Pacific Global Ophthalmology PACS Market Volume Share (%), by Type 2024 & 2032
- Figure 59: Asia Pacific Global Ophthalmology PACS Market Revenue (Million), by Delivery Model 2024 & 2032
- Figure 60: Asia Pacific Global Ophthalmology PACS Market Volume (K Unit), by Delivery Model 2024 & 2032
- Figure 61: Asia Pacific Global Ophthalmology PACS Market Revenue Share (%), by Delivery Model 2024 & 2032
- Figure 62: Asia Pacific Global Ophthalmology PACS Market Volume Share (%), by Delivery Model 2024 & 2032
- Figure 63: Asia Pacific Global Ophthalmology PACS Market Revenue (Million), by End User 2024 & 2032
- Figure 64: Asia Pacific Global Ophthalmology PACS Market Volume (K Unit), by End User 2024 & 2032
- Figure 65: Asia Pacific Global Ophthalmology PACS Market Revenue Share (%), by End User 2024 & 2032
- Figure 66: Asia Pacific Global Ophthalmology PACS Market Volume Share (%), by End User 2024 & 2032
- Figure 67: Asia Pacific Global Ophthalmology PACS Market Revenue (Million), by Country 2024 & 2032
- Figure 68: Asia Pacific Global Ophthalmology PACS Market Volume (K Unit), by Country 2024 & 2032
- Figure 69: Asia Pacific Global Ophthalmology PACS Market Revenue Share (%), by Country 2024 & 2032
- Figure 70: Asia Pacific Global Ophthalmology PACS Market Volume Share (%), by Country 2024 & 2032
- Figure 71: Middle East and Africa Global Ophthalmology PACS Market Revenue (Million), by Type 2024 & 2032
- Figure 72: Middle East and Africa Global Ophthalmology PACS Market Volume (K Unit), by Type 2024 & 2032
- Figure 73: Middle East and Africa Global Ophthalmology PACS Market Revenue Share (%), by Type 2024 & 2032
- Figure 74: Middle East and Africa Global Ophthalmology PACS Market Volume Share (%), by Type 2024 & 2032
- Figure 75: Middle East and Africa Global Ophthalmology PACS Market Revenue (Million), by Delivery Model 2024 & 2032
- Figure 76: Middle East and Africa Global Ophthalmology PACS Market Volume (K Unit), by Delivery Model 2024 & 2032
- Figure 77: Middle East and Africa Global Ophthalmology PACS Market Revenue Share (%), by Delivery Model 2024 & 2032
- Figure 78: Middle East and Africa Global Ophthalmology PACS Market Volume Share (%), by Delivery Model 2024 & 2032
- Figure 79: Middle East and Africa Global Ophthalmology PACS Market Revenue (Million), by End User 2024 & 2032
- Figure 80: Middle East and Africa Global Ophthalmology PACS Market Volume (K Unit), by End User 2024 & 2032
- Figure 81: Middle East and Africa Global Ophthalmology PACS Market Revenue Share (%), by End User 2024 & 2032
- Figure 82: Middle East and Africa Global Ophthalmology PACS Market Volume Share (%), by End User 2024 & 2032
- Figure 83: Middle East and Africa Global Ophthalmology PACS Market Revenue (Million), by Country 2024 & 2032
- Figure 84: Middle East and Africa Global Ophthalmology PACS Market Volume (K Unit), by Country 2024 & 2032
- Figure 85: Middle East and Africa Global Ophthalmology PACS Market Revenue Share (%), by Country 2024 & 2032
- Figure 86: Middle East and Africa Global Ophthalmology PACS Market Volume Share (%), by Country 2024 & 2032
- Figure 87: South America Global Ophthalmology PACS Market Revenue (Million), by Type 2024 & 2032
- Figure 88: South America Global Ophthalmology PACS Market Volume (K Unit), by Type 2024 & 2032
- Figure 89: South America Global Ophthalmology PACS Market Revenue Share (%), by Type 2024 & 2032
- Figure 90: South America Global Ophthalmology PACS Market Volume Share (%), by Type 2024 & 2032
- Figure 91: South America Global Ophthalmology PACS Market Revenue (Million), by Delivery Model 2024 & 2032
- Figure 92: South America Global Ophthalmology PACS Market Volume (K Unit), by Delivery Model 2024 & 2032
- Figure 93: South America Global Ophthalmology PACS Market Revenue Share (%), by Delivery Model 2024 & 2032
- Figure 94: South America Global Ophthalmology PACS Market Volume Share (%), by Delivery Model 2024 & 2032
- Figure 95: South America Global Ophthalmology PACS Market Revenue (Million), by End User 2024 & 2032
- Figure 96: South America Global Ophthalmology PACS Market Volume (K Unit), by End User 2024 & 2032
- Figure 97: South America Global Ophthalmology PACS Market Revenue Share (%), by End User 2024 & 2032
- Figure 98: South America Global Ophthalmology PACS Market Volume Share (%), by End User 2024 & 2032
- Figure 99: South America Global Ophthalmology PACS Market Revenue (Million), by Country 2024 & 2032
- Figure 100: South America Global Ophthalmology PACS Market Volume (K Unit), by Country 2024 & 2032
- Figure 101: South America Global Ophthalmology PACS Market Revenue Share (%), by Country 2024 & 2032
- Figure 102: South America Global Ophthalmology PACS Market Volume Share (%), by Country 2024 & 2032
List of Tables
- Table 1: Global Ophthalmology PACS Market Revenue Million Forecast, by Region 2019 & 2032
- Table 2: Global Ophthalmology PACS Market Volume K Unit Forecast, by Region 2019 & 2032
- Table 3: Global Ophthalmology PACS Market Revenue Million Forecast, by Type 2019 & 2032
- Table 4: Global Ophthalmology PACS Market Volume K Unit Forecast, by Type 2019 & 2032
- Table 5: Global Ophthalmology PACS Market Revenue Million Forecast, by Delivery Model 2019 & 2032
- Table 6: Global Ophthalmology PACS Market Volume K Unit Forecast, by Delivery Model 2019 & 2032
- Table 7: Global Ophthalmology PACS Market Revenue Million Forecast, by End User 2019 & 2032
- Table 8: Global Ophthalmology PACS Market Volume K Unit Forecast, by End User 2019 & 2032
- Table 9: Global Ophthalmology PACS Market Revenue Million Forecast, by Region 2019 & 2032
- Table 10: Global Ophthalmology PACS Market Volume K Unit Forecast, by Region 2019 & 2032
- Table 11: Global Ophthalmology PACS Market Revenue Million Forecast, by Country 2019 & 2032
- Table 12: Global Ophthalmology PACS Market Volume K Unit Forecast, by Country 2019 & 2032
- Table 13: United States Global Ophthalmology PACS Market Revenue (Million) Forecast, by Application 2019 & 2032
- Table 14: United States Global Ophthalmology PACS Market Volume (K Unit) Forecast, by Application 2019 & 2032
- Table 15: Canada Global Ophthalmology PACS Market Revenue (Million) Forecast, by Application 2019 & 2032
- Table 16: Canada Global Ophthalmology PACS Market Volume (K Unit) Forecast, by Application 2019 & 2032
- Table 17: Mexico Global Ophthalmology PACS Market Revenue (Million) Forecast, by Application 2019 & 2032
- Table 18: Mexico Global Ophthalmology PACS Market Volume (K Unit) Forecast, by Application 2019 & 2032
- Table 19: Global Ophthalmology PACS Market Revenue Million Forecast, by Country 2019 & 2032
- Table 20: Global Ophthalmology PACS Market Volume K Unit Forecast, by Country 2019 & 2032
- Table 21: Germany Global Ophthalmology PACS Market Revenue (Million) Forecast, by Application 2019 & 2032
- Table 22: Germany Global Ophthalmology PACS Market Volume (K Unit) Forecast, by Application 2019 & 2032
- Table 23: United Kingdom Global Ophthalmology PACS Market Revenue (Million) Forecast, by Application 2019 & 2032
- Table 24: United Kingdom Global Ophthalmology PACS Market Volume (K Unit) Forecast, by Application 2019 & 2032
- Table 25: France Global Ophthalmology PACS Market Revenue (Million) Forecast, by Application 2019 & 2032
- Table 26: France Global Ophthalmology PACS Market Volume (K Unit) Forecast, by Application 2019 & 2032
- Table 27: Italy Global Ophthalmology PACS Market Revenue (Million) Forecast, by Application 2019 & 2032
- Table 28: Italy Global Ophthalmology PACS Market Volume (K Unit) Forecast, by Application 2019 & 2032
- Table 29: Spain Global Ophthalmology PACS Market Revenue (Million) Forecast, by Application 2019 & 2032
- Table 30: Spain Global Ophthalmology PACS Market Volume (K Unit) Forecast, by Application 2019 & 2032
- Table 31: Rest of Europe Global Ophthalmology PACS Market Revenue (Million) Forecast, by Application 2019 & 2032
- Table 32: Rest of Europe Global Ophthalmology PACS Market Volume (K Unit) Forecast, by Application 2019 & 2032
- Table 33: Global Ophthalmology PACS Market Revenue Million Forecast, by Country 2019 & 2032
- Table 34: Global Ophthalmology PACS Market Volume K Unit Forecast, by Country 2019 & 2032
- Table 35: China Global Ophthalmology PACS Market Revenue (Million) Forecast, by Application 2019 & 2032
- Table 36: China Global Ophthalmology PACS Market Volume (K Unit) Forecast, by Application 2019 & 2032
- Table 37: Japan Global Ophthalmology PACS Market Revenue (Million) Forecast, by Application 2019 & 2032
- Table 38: Japan Global Ophthalmology PACS Market Volume (K Unit) Forecast, by Application 2019 & 2032
- Table 39: India Global Ophthalmology PACS Market Revenue (Million) Forecast, by Application 2019 & 2032
- Table 40: India Global Ophthalmology PACS Market Volume (K Unit) Forecast, by Application 2019 & 2032
- Table 41: Australia Global Ophthalmology PACS Market Revenue (Million) Forecast, by Application 2019 & 2032
- Table 42: Australia Global Ophthalmology PACS Market Volume (K Unit) Forecast, by Application 2019 & 2032
- Table 43: South Korea Global Ophthalmology PACS Market Revenue (Million) Forecast, by Application 2019 & 2032
- Table 44: South Korea Global Ophthalmology PACS Market Volume (K Unit) Forecast, by Application 2019 & 2032
- Table 45: Rest of Asia Pacific Global Ophthalmology PACS Market Revenue (Million) Forecast, by Application 2019 & 2032
- Table 46: Rest of Asia Pacific Global Ophthalmology PACS Market Volume (K Unit) Forecast, by Application 2019 & 2032
- Table 47: Global Ophthalmology PACS Market Revenue Million Forecast, by Country 2019 & 2032
- Table 48: Global Ophthalmology PACS Market Volume K Unit Forecast, by Country 2019 & 2032
- Table 49: GCC Global Ophthalmology PACS Market Revenue (Million) Forecast, by Application 2019 & 2032
- Table 50: GCC Global Ophthalmology PACS Market Volume (K Unit) Forecast, by Application 2019 & 2032
- Table 51: South Africa Global Ophthalmology PACS Market Revenue (Million) Forecast, by Application 2019 & 2032
- Table 52: South Africa Global Ophthalmology PACS Market Volume (K Unit) Forecast, by Application 2019 & 2032
- Table 53: Rest of Middle East and Africa Global Ophthalmology PACS Market Revenue (Million) Forecast, by Application 2019 & 2032
- Table 54: Rest of Middle East and Africa Global Ophthalmology PACS Market Volume (K Unit) Forecast, by Application 2019 & 2032
- Table 55: Global Ophthalmology PACS Market Revenue Million Forecast, by Country 2019 & 2032
- Table 56: Global Ophthalmology PACS Market Volume K Unit Forecast, by Country 2019 & 2032
- Table 57: Brazil Global Ophthalmology PACS Market Revenue (Million) Forecast, by Application 2019 & 2032
- Table 58: Brazil Global Ophthalmology PACS Market Volume (K Unit) Forecast, by Application 2019 & 2032
- Table 59: Argentina Global Ophthalmology PACS Market Revenue (Million) Forecast, by Application 2019 & 2032
- Table 60: Argentina Global Ophthalmology PACS Market Volume (K Unit) Forecast, by Application 2019 & 2032
- Table 61: Rest of South America Global Ophthalmology PACS Market Revenue (Million) Forecast, by Application 2019 & 2032
- Table 62: Rest of South America Global Ophthalmology PACS Market Volume (K Unit) Forecast, by Application 2019 & 2032
- Table 63: Global Ophthalmology PACS Market Revenue Million Forecast, by Type 2019 & 2032
- Table 64: Global Ophthalmology PACS Market Volume K Unit Forecast, by Type 2019 & 2032
- Table 65: Global Ophthalmology PACS Market Revenue Million Forecast, by Delivery Model 2019 & 2032
- Table 66: Global Ophthalmology PACS Market Volume K Unit Forecast, by Delivery Model 2019 & 2032
- Table 67: Global Ophthalmology PACS Market Revenue Million Forecast, by End User 2019 & 2032
- Table 68: Global Ophthalmology PACS Market Volume K Unit Forecast, by End User 2019 & 2032
- Table 69: Global Ophthalmology PACS Market Revenue Million Forecast, by Country 2019 & 2032
- Table 70: Global Ophthalmology PACS Market Volume K Unit Forecast, by Country 2019 & 2032
- Table 71: United States Global Ophthalmology PACS Market Revenue (Million) Forecast, by Application 2019 & 2032
- Table 72: United States Global Ophthalmology PACS Market Volume (K Unit) Forecast, by Application 2019 & 2032
- Table 73: Canada Global Ophthalmology PACS Market Revenue (Million) Forecast, by Application 2019 & 2032
- Table 74: Canada Global Ophthalmology PACS Market Volume (K Unit) Forecast, by Application 2019 & 2032
- Table 75: Mexico Global Ophthalmology PACS Market Revenue (Million) Forecast, by Application 2019 & 2032
- Table 76: Mexico Global Ophthalmology PACS Market Volume (K Unit) Forecast, by Application 2019 & 2032
- Table 77: Global Ophthalmology PACS Market Revenue Million Forecast, by Type 2019 & 2032
- Table 78: Global Ophthalmology PACS Market Volume K Unit Forecast, by Type 2019 & 2032
- Table 79: Global Ophthalmology PACS Market Revenue Million Forecast, by Delivery Model 2019 & 2032
- Table 80: Global Ophthalmology PACS Market Volume K Unit Forecast, by Delivery Model 2019 & 2032
- Table 81: Global Ophthalmology PACS Market Revenue Million Forecast, by End User 2019 & 2032
- Table 82: Global Ophthalmology PACS Market Volume K Unit Forecast, by End User 2019 & 2032
- Table 83: Global Ophthalmology PACS Market Revenue Million Forecast, by Country 2019 & 2032
- Table 84: Global Ophthalmology PACS Market Volume K Unit Forecast, by Country 2019 & 2032
- Table 85: Germany Global Ophthalmology PACS Market Revenue (Million) Forecast, by Application 2019 & 2032
- Table 86: Germany Global Ophthalmology PACS Market Volume (K Unit) Forecast, by Application 2019 & 2032
- Table 87: United Kingdom Global Ophthalmology PACS Market Revenue (Million) Forecast, by Application 2019 & 2032
- Table 88: United Kingdom Global Ophthalmology PACS Market Volume (K Unit) Forecast, by Application 2019 & 2032
- Table 89: France Global Ophthalmology PACS Market Revenue (Million) Forecast, by Application 2019 & 2032
- Table 90: France Global Ophthalmology PACS Market Volume (K Unit) Forecast, by Application 2019 & 2032
- Table 91: Italy Global Ophthalmology PACS Market Revenue (Million) Forecast, by Application 2019 & 2032
- Table 92: Italy Global Ophthalmology PACS Market Volume (K Unit) Forecast, by Application 2019 & 2032
- Table 93: Spain Global Ophthalmology PACS Market Revenue (Million) Forecast, by Application 2019 & 2032
- Table 94: Spain Global Ophthalmology PACS Market Volume (K Unit) Forecast, by Application 2019 & 2032
- Table 95: Rest of Europe Global Ophthalmology PACS Market Revenue (Million) Forecast, by Application 2019 & 2032
- Table 96: Rest of Europe Global Ophthalmology PACS Market Volume (K Unit) Forecast, by Application 2019 & 2032
- Table 97: Global Ophthalmology PACS Market Revenue Million Forecast, by Type 2019 & 2032
- Table 98: Global Ophthalmology PACS Market Volume K Unit Forecast, by Type 2019 & 2032
- Table 99: Global Ophthalmology PACS Market Revenue Million Forecast, by Delivery Model 2019 & 2032
- Table 100: Global Ophthalmology PACS Market Volume K Unit Forecast, by Delivery Model 2019 & 2032
- Table 101: Global Ophthalmology PACS Market Revenue Million Forecast, by End User 2019 & 2032
- Table 102: Global Ophthalmology PACS Market Volume K Unit Forecast, by End User 2019 & 2032
- Table 103: Global Ophthalmology PACS Market Revenue Million Forecast, by Country 2019 & 2032
- Table 104: Global Ophthalmology PACS Market Volume K Unit Forecast, by Country 2019 & 2032
- Table 105: China Global Ophthalmology PACS Market Revenue (Million) Forecast, by Application 2019 & 2032
- Table 106: China Global Ophthalmology PACS Market Volume (K Unit) Forecast, by Application 2019 & 2032
- Table 107: Japan Global Ophthalmology PACS Market Revenue (Million) Forecast, by Application 2019 & 2032
- Table 108: Japan Global Ophthalmology PACS Market Volume (K Unit) Forecast, by Application 2019 & 2032
- Table 109: India Global Ophthalmology PACS Market Revenue (Million) Forecast, by Application 2019 & 2032
- Table 110: India Global Ophthalmology PACS Market Volume (K Unit) Forecast, by Application 2019 & 2032
- Table 111: Australia Global Ophthalmology PACS Market Revenue (Million) Forecast, by Application 2019 & 2032
- Table 112: Australia Global Ophthalmology PACS Market Volume (K Unit) Forecast, by Application 2019 & 2032
- Table 113: South Korea Global Ophthalmology PACS Market Revenue (Million) Forecast, by Application 2019 & 2032
- Table 114: South Korea Global Ophthalmology PACS Market Volume (K Unit) Forecast, by Application 2019 & 2032
- Table 115: Rest of Asia Pacific Global Ophthalmology PACS Market Revenue (Million) Forecast, by Application 2019 & 2032
- Table 116: Rest of Asia Pacific Global Ophthalmology PACS Market Volume (K Unit) Forecast, by Application 2019 & 2032
- Table 117: Global Ophthalmology PACS Market Revenue Million Forecast, by Type 2019 & 2032
- Table 118: Global Ophthalmology PACS Market Volume K Unit Forecast, by Type 2019 & 2032
- Table 119: Global Ophthalmology PACS Market Revenue Million Forecast, by Delivery Model 2019 & 2032
- Table 120: Global Ophthalmology PACS Market Volume K Unit Forecast, by Delivery Model 2019 & 2032
- Table 121: Global Ophthalmology PACS Market Revenue Million Forecast, by End User 2019 & 2032
- Table 122: Global Ophthalmology PACS Market Volume K Unit Forecast, by End User 2019 & 2032
- Table 123: Global Ophthalmology PACS Market Revenue Million Forecast, by Country 2019 & 2032
- Table 124: Global Ophthalmology PACS Market Volume K Unit Forecast, by Country 2019 & 2032
- Table 125: GCC Global Ophthalmology PACS Market Revenue (Million) Forecast, by Application 2019 & 2032
- Table 126: GCC Global Ophthalmology PACS Market Volume (K Unit) Forecast, by Application 2019 & 2032
- Table 127: South Africa Global Ophthalmology PACS Market Revenue (Million) Forecast, by Application 2019 & 2032
- Table 128: South Africa Global Ophthalmology PACS Market Volume (K Unit) Forecast, by Application 2019 & 2032
- Table 129: Rest of Middle East and Africa Global Ophthalmology PACS Market Revenue (Million) Forecast, by Application 2019 & 2032
- Table 130: Rest of Middle East and Africa Global Ophthalmology PACS Market Volume (K Unit) Forecast, by Application 2019 & 2032
- Table 131: Global Ophthalmology PACS Market Revenue Million Forecast, by Type 2019 & 2032
- Table 132: Global Ophthalmology PACS Market Volume K Unit Forecast, by Type 2019 & 2032
- Table 133: Global Ophthalmology PACS Market Revenue Million Forecast, by Delivery Model 2019 & 2032
- Table 134: Global Ophthalmology PACS Market Volume K Unit Forecast, by Delivery Model 2019 & 2032
- Table 135: Global Ophthalmology PACS Market Revenue Million Forecast, by End User 2019 & 2032
- Table 136: Global Ophthalmology PACS Market Volume K Unit Forecast, by End User 2019 & 2032
- Table 137: Global Ophthalmology PACS Market Revenue Million Forecast, by Country 2019 & 2032
- Table 138: Global Ophthalmology PACS Market Volume K Unit Forecast, by Country 2019 & 2032
- Table 139: Brazil Global Ophthalmology PACS Market Revenue (Million) Forecast, by Application 2019 & 2032
- Table 140: Brazil Global Ophthalmology PACS Market Volume (K Unit) Forecast, by Application 2019 & 2032
- Table 141: Argentina Global Ophthalmology PACS Market Revenue (Million) Forecast, by Application 2019 & 2032
- Table 142: Argentina Global Ophthalmology PACS Market Volume (K Unit) Forecast, by Application 2019 & 2032
- Table 143: Rest of South America Global Ophthalmology PACS Market Revenue (Million) Forecast, by Application 2019 & 2032
- Table 144: Rest of South America Global Ophthalmology PACS Market Volume (K Unit) Forecast, by Application 2019 & 2032
Frequently Asked Questions
1. What is the projected Compound Annual Growth Rate (CAGR) of the Global Ophthalmology PACS Market?
The projected CAGR is approximately 8.00%.
2. Which companies are prominent players in the Global Ophthalmology PACS Market?
Key companies in the market include VersaSuite, Heidelberg Engineering GmbH, Carl Zeiss Meditec AG, Medical Standard Co Ltd, IBM Corporation, Agfa-Gevaert N V, Visbion Limited, Sonomed Escalon.
3. What are the main segments of the Global Ophthalmology PACS Market?
The market segments include Type, Delivery Model, End User.
4. Can you provide details about the market size?
The market size is estimated to be USD XX Million as of 2022.
5. What are some drivers contributing to market growth?
High Prevalence of Eye Diseases; Increasing Geriatric Population; Expansion of Teleophthalmology.
6. What are the notable trends driving market growth?
Integrated PACS Segment is Expected to Show Better Growth Over the Forecast Years.
7. Are there any restraints impacting market growth?
High Implementation and Maintenance Costs.
8. Can you provide examples of recent developments in the market?
May 2022: OMNY Health partnered with community-based ophthalmology practices to launch a real-world data ecosystem focused on driving collaborative research partnerships to advance treatments and improve outcomes for patients with ophthalmic disorders.
9. What pricing options are available for accessing the report?
Pricing options include single-user, multi-user, and enterprise licenses priced at USD 4750, USD 5250, and USD 8750 respectively.
10. Is the market size provided in terms of value or volume?
The market size is provided in terms of value, measured in Million and volume, measured in K Unit.
11. Are there any specific market keywords associated with the report?
Yes, the market keyword associated with the report is "Global Ophthalmology PACS Market," which aids in identifying and referencing the specific market segment covered.
12. How do I determine which pricing option suits my needs best?
The pricing options vary based on user requirements and access needs. Individual users may opt for single-user licenses, while businesses requiring broader access may choose multi-user or enterprise licenses for cost-effective access to the report.
13. Are there any additional resources or data provided in the Global Ophthalmology PACS Market report?
While the report offers comprehensive insights, it's advisable to review the specific contents or supplementary materials provided to ascertain if additional resources or data are available.
14. How can I stay updated on further developments or reports in the Global Ophthalmology PACS Market?
To stay informed about further developments, trends, and reports in the Global Ophthalmology PACS Market, consider subscribing to industry newsletters, following relevant companies and organizations, or regularly checking reputable industry news sources and publications.
Methodology
Step 1 - Identification of Relevant Samples Size from Population Database


Step 2 - Approaches for Defining Global Market Size (Value, Volume* & Price*)

Note*: In applicable scenarios
Step 3 - Data Sources
Primary Research
- Web Analytics
- Survey Reports
- Research Institute
- Latest Research Reports
- Opinion Leaders
Secondary Research
- Annual Reports
- White Paper
- Latest Press Release
- Industry Association
- Paid Database
- Investor Presentations

Step 4 - Data Triangulation
Involves using different sources of information in order to increase the validity of a study
These sources are likely to be stakeholders in a program - participants, other researchers, program staff, other community members, and so on.
Then we put all data in single framework & apply various statistical tools to find out the dynamic on the market.
During the analysis stage, feedback from the stakeholder groups would be compared to determine areas of agreement as well as areas of divergence
