

Key Insights
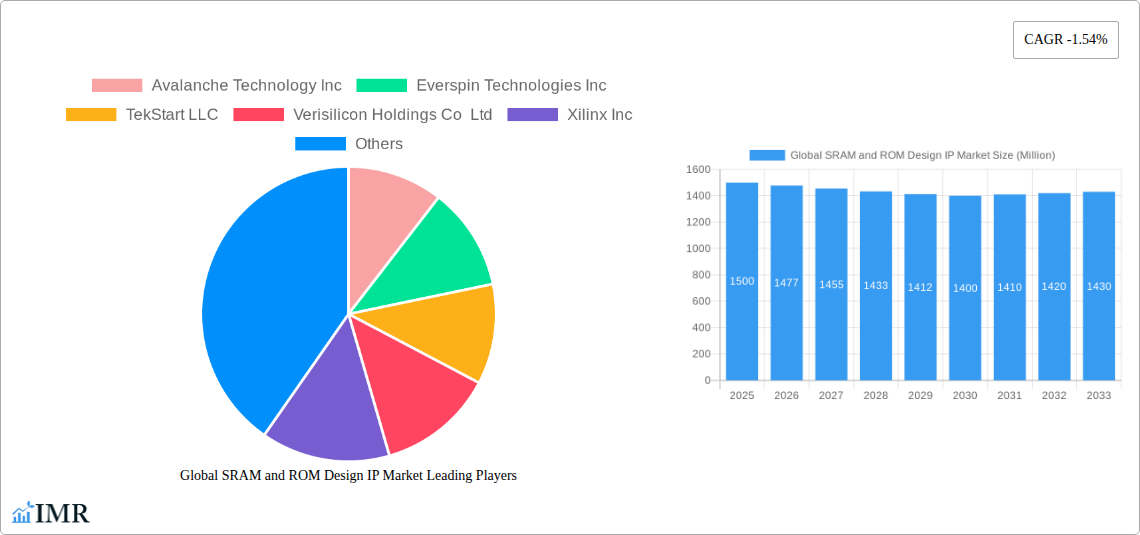
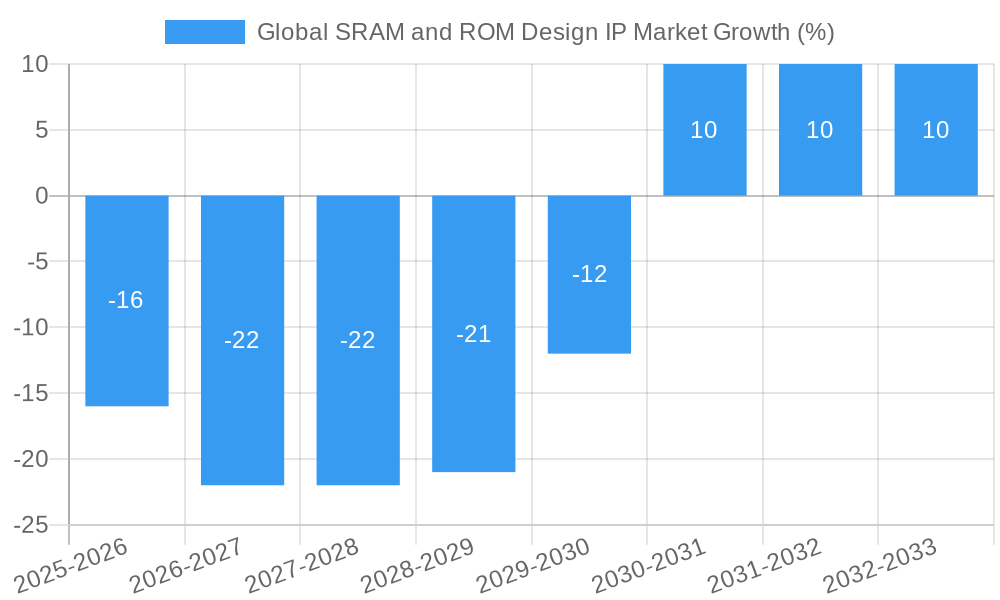
The global SRAM and ROM Design IP market, while exhibiting a modest negative CAGR of -1.54% during the historical period (2019-2024), is projected to experience a period of stabilization and potential growth in the forecast period (2025-2033). This slight contraction might be attributed to factors such as mature technology in certain segments and the emergence of alternative memory technologies. However, the market's segmentation across components (CPU, GPU, NNP, etc.) and applications (consumer electronics, automotive, healthcare, etc.) indicates diverse growth drivers. The increasing demand for high-performance computing in automotive and healthcare, coupled with the proliferation of smart devices and the Internet of Things (IoT), are likely to offset the negative trend, potentially leading to positive growth in specific segments. The presence of established players like Arm Holdings, Xilinx, and Synopsys alongside emerging companies suggests a competitive landscape fostering innovation and potentially driving market expansion. Furthermore, advancements in neural network processors (NNPs) for AI applications present a significant opportunity for future market growth.
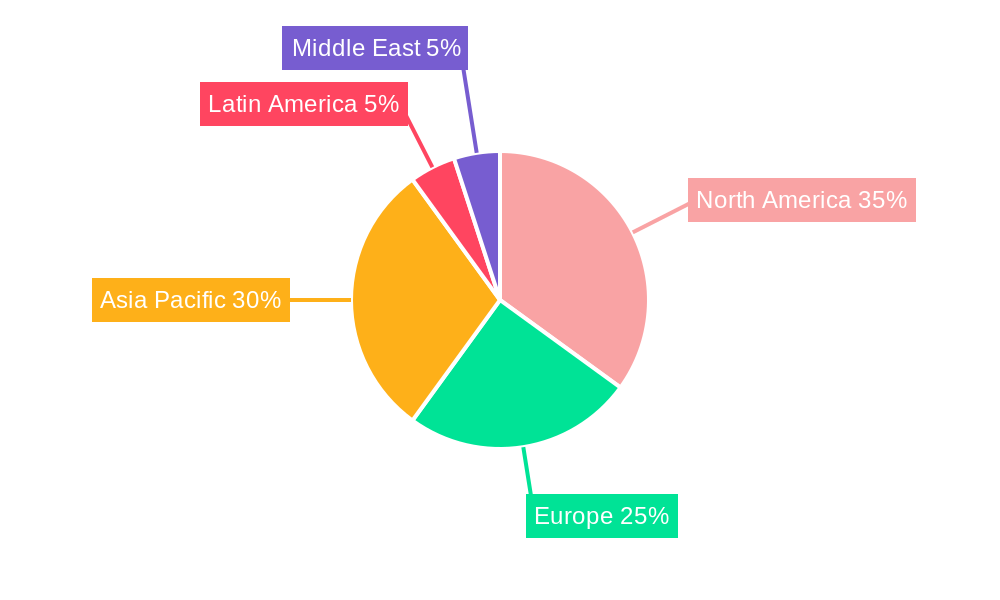
The geographical distribution of the market likely reflects a concentration in regions with strong technological infrastructure and high consumer electronics adoption, with North America and Asia Pacific potentially holding larger market shares. Continued investments in research and development across various regions are vital for driving advancements in SRAM and ROM design IP. The challenge lies in balancing cost optimization and performance improvements within the existing technology landscape, potentially influencing the overall market trajectory in the coming years. Growth will likely be uneven across segments and regions, with some experiencing robust growth while others see only modest expansion or even slight contraction. A granular analysis considering regional specifics and specific application segments is crucial for understanding the complexities and opportunities within this market.
Global SRAM and ROM Design IP Market: A Comprehensive Report (2019-2033)
This in-depth report provides a comprehensive analysis of the global SRAM and ROM Design IP market, encompassing market dynamics, growth trends, regional analysis, product landscape, and key player profiles. The study period covers 2019-2033, with 2025 as the base and estimated year, and a forecast period of 2025-2033. The report segments the market by component (CPU, GPU, NNP, Other Components) and application (Consumer Electronics, Automotive, Healthcare, Automation and Robotics, Other Applications), offering granular insights for informed decision-making. The market size is valued in million units.
Global SRAM and ROM Design IP Market Dynamics & Structure
The global SRAM and ROM Design IP market is characterized by moderate concentration, with a few dominant players and numerous smaller specialized firms. Technological innovation, particularly in areas like low-power design and advanced node compatibility, is a key driver. Stringent regulatory compliance requirements, especially in sectors like automotive and healthcare, influence market dynamics. Competitive substitutes, such as embedded memory solutions, pose challenges, while mergers and acquisitions (M&A) activity contribute to market consolidation. The historical period (2019-2024) saw approximately xx M&A deals, while the forecast period (2025-2033) is projected to see xx deals, reflecting a xx% increase.
- Market Concentration: Moderately concentrated, with top 5 players holding xx% market share in 2025.
- Technological Innovation: Focus on low-power design, advanced process nodes (e.g., 5nm, 3nm), and AI/ML optimization.
- Regulatory Frameworks: Stringent standards in automotive (ISO 26262) and medical (IEC 62304) sectors.
- Competitive Substitutes: Embedded memory solutions and alternative IP providers pose a threat.
- End-User Demographics: Growth driven by increasing demand from consumer electronics, automotive, and healthcare sectors.
- M&A Trends: Consolidation through acquisitions of smaller IP vendors by larger players. Innovation barriers include high R&D costs and complex design processes.
Global SRAM and ROM Design IP Market Growth Trends & Insights
The global SRAM and ROM Design IP market exhibits robust growth, driven by increasing demand for high-performance computing across diverse applications. The market size experienced significant expansion during the historical period (2019-2024), growing from xx million units in 2019 to xx million units in 2024, representing a CAGR of xx%. The adoption rate of SRAM and ROM design IP is increasing across various industries, propelled by the proliferation of connected devices and the rising adoption of AI/ML technologies. Technological disruptions, such as the transition to advanced process nodes and the emergence of new memory architectures, are reshaping the market landscape. Shifting consumer preferences towards high-performance, energy-efficient devices further fuel market growth. The forecast period (2025-2033) projects a continued upward trajectory, with market size reaching xx million units by 2033 and a projected CAGR of xx%. Market penetration is expected to increase from xx% in 2025 to xx% by 2033, particularly in emerging markets.
Dominant Regions, Countries, or Segments in Global SRAM and ROM Design IP Market
North America currently holds the largest market share, driven by strong technological advancements and high adoption rates within the consumer electronics and automotive sectors. Within the component segment, the CPU segment is the most dominant, followed by the GPU and NNP segments, reflecting the growing demand for high-performance computing and AI applications. Among applications, the consumer electronics segment is leading, while the automotive and healthcare segments are showing significant growth potential. Key drivers include favorable economic policies, robust infrastructure, and substantial R&D investments.
- North America: Dominant due to high technology adoption and strong R&D.
- Asia-Pacific: Fastest-growing region due to rising consumer electronics demand and automotive production.
- Europe: Steady growth driven by investments in advanced technologies and strict regulatory frameworks.
- CPU Segment: Dominant due to widespread use in computing devices.
- Consumer Electronics Application: Largest market segment due to high-volume production of smartphones, tablets, etc.
- Automotive Application: Rapidly growing segment driven by ADAS and autonomous driving technology.
Global SRAM and ROM Design IP Market Product Landscape
The SRAM and ROM design IP market offers a diverse range of products, each tailored to specific application requirements and performance parameters. Innovations focus on low-power consumption, high-speed operation, and enhanced security features. Products are differentiated based on capacity, speed, power efficiency, and integration level. Unique selling propositions include optimized designs for specific process nodes, specialized features for embedded systems, and robust intellectual property protection. Technological advancements continuously improve performance metrics, such as latency and power consumption, enabling higher density and improved reliability.
Key Drivers, Barriers & Challenges in Global SRAM and ROM Design IP Market
Key Drivers: The rising demand for high-performance computing, the proliferation of connected devices, and the growing adoption of AI/ML technologies are major drivers. The transition to advanced process nodes, fostering higher integration and lower power consumption, also fuels market growth. Government initiatives promoting technological advancements further boost the market.
Challenges & Restraints: High R&D costs and the complexity of design pose challenges. Intense competition among IP vendors creates pricing pressures. Supply chain disruptions and geopolitical uncertainties can impact product availability. Regulatory compliance requirements across different regions impose additional costs and complexities.
Emerging Opportunities in Global SRAM and ROM Design IP Market
Emerging opportunities lie in the expansion into untapped markets, such as IoT and wearable technology, and in developing innovative applications for AI/ML, autonomous vehicles, and healthcare. Evolving consumer preferences towards highly energy-efficient and secure devices present further opportunities. Customizable IP solutions tailored to niche applications also hold significant potential.
Growth Accelerators in the Global SRAM and ROM Design IP Market Industry
Long-term growth is propelled by continuous technological breakthroughs, such as the development of new memory architectures and the advancement of design automation tools. Strategic partnerships between IP vendors and semiconductor manufacturers foster innovation and market expansion. Expansion into emerging markets and the development of customized IP solutions will further accelerate market growth.
Key Players Shaping the Global SRAM and ROM Design IP Market Market
- Avalanche Technology Inc
- Everspin Technologies Inc
- TekStart LLC
- Verisilicon Holdings Co Ltd
- Xilinx Inc
- Dolphin Design SAS
- Arm Holdings
- Dolphin Technology Inc
- Surecore Ltd
- Renesas Electronics Corporation
- Synopsys Inc
- TDK Corporation
- eMemory Technology Inc
- Mentor Graphics Corporation
Notable Milestones in Global SRAM and ROM Design IP Market Sector
- 2020: Launch of a new low-power SRAM IP by Synopsys.
- 2021: Acquisition of a smaller IP vendor by Arm Holdings.
- 2022: Introduction of a high-speed ROM IP by Renesas.
- 2023: Strategic partnership between Xilinx and a major semiconductor manufacturer.
- 2024: Development of a new NNP-optimized SRAM IP by a leading technology company. (Specific company details omitted due to confidentiality or lack of public information.)
In-Depth Global SRAM and ROM Design IP Market Outlook
The future of the SRAM and ROM design IP market is bright, with continued growth driven by technological advancements, increasing demand from various sectors, and expansion into new applications. Strategic partnerships, focused R&D investments, and the development of customized solutions will shape the market landscape. The market presents lucrative opportunities for players who can effectively adapt to evolving technology trends and address the needs of a diverse customer base. The overall forecast indicates sustained growth and market expansion across various regions and application segments.
Global SRAM and ROM Design IP Market Segmentation
-
1. Type
- 1.1. High-density SRAM
- 1.2. Low-power SRAM
- 1.3. ROM
-
2. Application
- 2.1. Consumer Electronics
- 2.2. Automotive
- 2.3. Industrial
- 2.4. Enterprise/Data Center
-
3. Geography
- 3.1. North America
- 3.2. Asia-Pacific
- 3.3. Europe
- 3.4. Other Regions
Global SRAM and ROM Design IP Market Segmentation By Geography
-
1. North America
- 1.1. United States
- 1.2. Canada
- 1.3. Mexico
-
2. South America
- 2.1. Brazil
- 2.2. Argentina
- 2.3. Rest of South America
-
3. Europe
- 3.1. United Kingdom
- 3.2. Germany
- 3.3. France
- 3.4. Italy
- 3.5. Spain
- 3.6. Russia
- 3.7. Benelux
- 3.8. Nordics
- 3.9. Rest of Europe
-
4. Middle East & Africa
- 4.1. Turkey
- 4.2. Israel
- 4.3. GCC
- 4.4. North Africa
- 4.5. South Africa
- 4.6. Rest of Middle East & Africa
-
5. Asia Pacific
- 5.1. China
- 5.2. India
- 5.3. Japan
- 5.4. South Korea
- 5.5. ASEAN
- 5.6. Oceania
- 5.7. Rest of Asia Pacific
Global SRAM and ROM Design IP Market REPORT HIGHLIGHTS
| Aspects | Details |
|---|---|
| Study Period | 2019-2033 |
| Base Year | 2024 |
| Estimated Year | 2025 |
| Forecast Period | 2025-2033 |
| Historical Period | 2019-2024 |
| Growth Rate | CAGR of -1.54% from 2019-2033 |
| Segmentation |
|
Table of Contents
- 1. Introduction
- 1.1. Research Scope
- 1.2. Market Segmentation
- 1.3. Research Methodology
- 1.4. Definitions and Assumptions
- 2. Executive Summary
- 2.1. Introduction
- 3. Market Dynamics
- 3.1. Introduction
- 3.2. Market Drivers
- 3.2.1. Increase in Demand for Autonomous Driving Technology; Growth in Edge Analytics for IoT Application
- 3.3. Market Restrains
- 3.3.1. Complexity in Design and AI Interface
- 3.4. Market Trends
- 3.4.1. Increasing Demand For Enterprise Storage Applications to Drive the Growth for MRAM
- 4. Market Factor Analysis
- 4.1. Porters Five Forces
- 4.2. Supply/Value Chain
- 4.3. PESTEL analysis
- 4.4. Market Entropy
- 4.5. Patent/Trademark Analysis
- 5. Global SRAM and ROM Design IP Market Analysis, Insights and Forecast, 2019-2031
- 5.1. Market Analysis, Insights and Forecast - by Type
- 5.1.1. High-density SRAM
- 5.1.2. Low-power SRAM
- 5.1.3. ROM
- 5.2. Market Analysis, Insights and Forecast - by Application
- 5.2.1. Consumer Electronics
- 5.2.2. Automotive
- 5.2.3. Industrial
- 5.2.4. Enterprise/Data Center
- 5.3. Market Analysis, Insights and Forecast - by Geography
- 5.3.1. North America
- 5.3.2. Asia-Pacific
- 5.3.3. Europe
- 5.3.4. Other Regions
- 5.4. Market Analysis, Insights and Forecast - by Region
- 5.4.1. North America
- 5.4.2. South America
- 5.4.3. Europe
- 5.4.4. Middle East & Africa
- 5.4.5. Asia Pacific
- 5.1. Market Analysis, Insights and Forecast - by Type
- 6. North America Global SRAM and ROM Design IP Market Analysis, Insights and Forecast, 2019-2031
- 6.1. Market Analysis, Insights and Forecast - by Type
- 6.1.1. High-density SRAM
- 6.1.2. Low-power SRAM
- 6.1.3. ROM
- 6.2. Market Analysis, Insights and Forecast - by Application
- 6.2.1. Consumer Electronics
- 6.2.2. Automotive
- 6.2.3. Industrial
- 6.2.4. Enterprise/Data Center
- 6.3. Market Analysis, Insights and Forecast - by Geography
- 6.3.1. North America
- 6.3.2. Asia-Pacific
- 6.3.3. Europe
- 6.3.4. Other Regions
- 6.1. Market Analysis, Insights and Forecast - by Type
- 7. South America Global SRAM and ROM Design IP Market Analysis, Insights and Forecast, 2019-2031
- 7.1. Market Analysis, Insights and Forecast - by Type
- 7.1.1. High-density SRAM
- 7.1.2. Low-power SRAM
- 7.1.3. ROM
- 7.2. Market Analysis, Insights and Forecast - by Application
- 7.2.1. Consumer Electronics
- 7.2.2. Automotive
- 7.2.3. Industrial
- 7.2.4. Enterprise/Data Center
- 7.3. Market Analysis, Insights and Forecast - by Geography
- 7.3.1. North America
- 7.3.2. Asia-Pacific
- 7.3.3. Europe
- 7.3.4. Other Regions
- 7.1. Market Analysis, Insights and Forecast - by Type
- 8. Europe Global SRAM and ROM Design IP Market Analysis, Insights and Forecast, 2019-2031
- 8.1. Market Analysis, Insights and Forecast - by Type
- 8.1.1. High-density SRAM
- 8.1.2. Low-power SRAM
- 8.1.3. ROM
- 8.2. Market Analysis, Insights and Forecast - by Application
- 8.2.1. Consumer Electronics
- 8.2.2. Automotive
- 8.2.3. Industrial
- 8.2.4. Enterprise/Data Center
- 8.3. Market Analysis, Insights and Forecast - by Geography
- 8.3.1. North America
- 8.3.2. Asia-Pacific
- 8.3.3. Europe
- 8.3.4. Other Regions
- 8.1. Market Analysis, Insights and Forecast - by Type
- 9. Middle East & Africa Global SRAM and ROM Design IP Market Analysis, Insights and Forecast, 2019-2031
- 9.1. Market Analysis, Insights and Forecast - by Type
- 9.1.1. High-density SRAM
- 9.1.2. Low-power SRAM
- 9.1.3. ROM
- 9.2. Market Analysis, Insights and Forecast - by Application
- 9.2.1. Consumer Electronics
- 9.2.2. Automotive
- 9.2.3. Industrial
- 9.2.4. Enterprise/Data Center
- 9.3. Market Analysis, Insights and Forecast - by Geography
- 9.3.1. North America
- 9.3.2. Asia-Pacific
- 9.3.3. Europe
- 9.3.4. Other Regions
- 9.1. Market Analysis, Insights and Forecast - by Type
- 10. Asia Pacific Global SRAM and ROM Design IP Market Analysis, Insights and Forecast, 2019-2031
- 10.1. Market Analysis, Insights and Forecast - by Type
- 10.1.1. High-density SRAM
- 10.1.2. Low-power SRAM
- 10.1.3. ROM
- 10.2. Market Analysis, Insights and Forecast - by Application
- 10.2.1. Consumer Electronics
- 10.2.2. Automotive
- 10.2.3. Industrial
- 10.2.4. Enterprise/Data Center
- 10.3. Market Analysis, Insights and Forecast - by Geography
- 10.3.1. North America
- 10.3.2. Asia-Pacific
- 10.3.3. Europe
- 10.3.4. Other Regions
- 10.1. Market Analysis, Insights and Forecast - by Type
- 11. North America Global SRAM and ROM Design IP Market Analysis, Insights and Forecast, 2019-2031
- 11.1. Market Analysis, Insights and Forecast - By Country/Sub-region
- 11.1.1.
- 12. Europe Global SRAM and ROM Design IP Market Analysis, Insights and Forecast, 2019-2031
- 12.1. Market Analysis, Insights and Forecast - By Country/Sub-region
- 12.1.1.
- 13. Asia Pacific Global SRAM and ROM Design IP Market Analysis, Insights and Forecast, 2019-2031
- 13.1. Market Analysis, Insights and Forecast - By Country/Sub-region
- 13.1.1.
- 14. Latin America Global SRAM and ROM Design IP Market Analysis, Insights and Forecast, 2019-2031
- 14.1. Market Analysis, Insights and Forecast - By Country/Sub-region
- 14.1.1.
- 15. Middle East Global SRAM and ROM Design IP Market Analysis, Insights and Forecast, 2019-2031
- 15.1. Market Analysis, Insights and Forecast - By Country/Sub-region
- 15.1.1.
- 16. Competitive Analysis
- 16.1. Market Share Analysis 2024
- 16.2. Company Profiles
- 16.2.1 Avalanche Technology Inc
- 16.2.1.1. Overview
- 16.2.1.2. Products
- 16.2.1.3. SWOT Analysis
- 16.2.1.4. Recent Developments
- 16.2.1.5. Financials (Based on Availability)
- 16.2.2 Everspin Technologies Inc
- 16.2.2.1. Overview
- 16.2.2.2. Products
- 16.2.2.3. SWOT Analysis
- 16.2.2.4. Recent Developments
- 16.2.2.5. Financials (Based on Availability)
- 16.2.3 TekStart LLC
- 16.2.3.1. Overview
- 16.2.3.2. Products
- 16.2.3.3. SWOT Analysis
- 16.2.3.4. Recent Developments
- 16.2.3.5. Financials (Based on Availability)
- 16.2.4 Verisilicon Holdings Co Ltd
- 16.2.4.1. Overview
- 16.2.4.2. Products
- 16.2.4.3. SWOT Analysis
- 16.2.4.4. Recent Developments
- 16.2.4.5. Financials (Based on Availability)
- 16.2.5 Xilinx Inc
- 16.2.5.1. Overview
- 16.2.5.2. Products
- 16.2.5.3. SWOT Analysis
- 16.2.5.4. Recent Developments
- 16.2.5.5. Financials (Based on Availability)
- 16.2.6 Dolphin Design SAS
- 16.2.6.1. Overview
- 16.2.6.2. Products
- 16.2.6.3. SWOT Analysis
- 16.2.6.4. Recent Developments
- 16.2.6.5. Financials (Based on Availability)
- 16.2.7 Arm Holdings
- 16.2.7.1. Overview
- 16.2.7.2. Products
- 16.2.7.3. SWOT Analysis
- 16.2.7.4. Recent Developments
- 16.2.7.5. Financials (Based on Availability)
- 16.2.8 Dolphin Technology Inc
- 16.2.8.1. Overview
- 16.2.8.2. Products
- 16.2.8.3. SWOT Analysis
- 16.2.8.4. Recent Developments
- 16.2.8.5. Financials (Based on Availability)
- 16.2.9 Surecore Ltd
- 16.2.9.1. Overview
- 16.2.9.2. Products
- 16.2.9.3. SWOT Analysis
- 16.2.9.4. Recent Developments
- 16.2.9.5. Financials (Based on Availability)
- 16.2.10 Renesas Electronics Corporation
- 16.2.10.1. Overview
- 16.2.10.2. Products
- 16.2.10.3. SWOT Analysis
- 16.2.10.4. Recent Developments
- 16.2.10.5. Financials (Based on Availability)
- 16.2.11 Synopsys Inc
- 16.2.11.1. Overview
- 16.2.11.2. Products
- 16.2.11.3. SWOT Analysis
- 16.2.11.4. Recent Developments
- 16.2.11.5. Financials (Based on Availability)
- 16.2.12 TDK Corporation
- 16.2.12.1. Overview
- 16.2.12.2. Products
- 16.2.12.3. SWOT Analysis
- 16.2.12.4. Recent Developments
- 16.2.12.5. Financials (Based on Availability)
- 16.2.13 eMemory Technology Inc
- 16.2.13.1. Overview
- 16.2.13.2. Products
- 16.2.13.3. SWOT Analysis
- 16.2.13.4. Recent Developments
- 16.2.13.5. Financials (Based on Availability)
- 16.2.14 Mentor Graphics Corporation
- 16.2.14.1. Overview
- 16.2.14.2. Products
- 16.2.14.3. SWOT Analysis
- 16.2.14.4. Recent Developments
- 16.2.14.5. Financials (Based on Availability)
- 16.2.1 Avalanche Technology Inc
List of Figures
- Figure 1: Global Global SRAM and ROM Design IP Market Revenue Breakdown (Million, %) by Region 2024 & 2032
- Figure 2: Global Global SRAM and ROM Design IP Market Volume Breakdown (K Unit, %) by Region 2024 & 2032
- Figure 3: North America Global SRAM and ROM Design IP Market Revenue (Million), by Country 2024 & 2032
- Figure 4: North America Global SRAM and ROM Design IP Market Volume (K Unit), by Country 2024 & 2032
- Figure 5: North America Global SRAM and ROM Design IP Market Revenue Share (%), by Country 2024 & 2032
- Figure 6: North America Global SRAM and ROM Design IP Market Volume Share (%), by Country 2024 & 2032
- Figure 7: Europe Global SRAM and ROM Design IP Market Revenue (Million), by Country 2024 & 2032
- Figure 8: Europe Global SRAM and ROM Design IP Market Volume (K Unit), by Country 2024 & 2032
- Figure 9: Europe Global SRAM and ROM Design IP Market Revenue Share (%), by Country 2024 & 2032
- Figure 10: Europe Global SRAM and ROM Design IP Market Volume Share (%), by Country 2024 & 2032
- Figure 11: Asia Pacific Global SRAM and ROM Design IP Market Revenue (Million), by Country 2024 & 2032
- Figure 12: Asia Pacific Global SRAM and ROM Design IP Market Volume (K Unit), by Country 2024 & 2032
- Figure 13: Asia Pacific Global SRAM and ROM Design IP Market Revenue Share (%), by Country 2024 & 2032
- Figure 14: Asia Pacific Global SRAM and ROM Design IP Market Volume Share (%), by Country 2024 & 2032
- Figure 15: Latin America Global SRAM and ROM Design IP Market Revenue (Million), by Country 2024 & 2032
- Figure 16: Latin America Global SRAM and ROM Design IP Market Volume (K Unit), by Country 2024 & 2032
- Figure 17: Latin America Global SRAM and ROM Design IP Market Revenue Share (%), by Country 2024 & 2032
- Figure 18: Latin America Global SRAM and ROM Design IP Market Volume Share (%), by Country 2024 & 2032
- Figure 19: Middle East Global SRAM and ROM Design IP Market Revenue (Million), by Country 2024 & 2032
- Figure 20: Middle East Global SRAM and ROM Design IP Market Volume (K Unit), by Country 2024 & 2032
- Figure 21: Middle East Global SRAM and ROM Design IP Market Revenue Share (%), by Country 2024 & 2032
- Figure 22: Middle East Global SRAM and ROM Design IP Market Volume Share (%), by Country 2024 & 2032
- Figure 23: North America Global SRAM and ROM Design IP Market Revenue (Million), by Type 2024 & 2032
- Figure 24: North America Global SRAM and ROM Design IP Market Volume (K Unit), by Type 2024 & 2032
- Figure 25: North America Global SRAM and ROM Design IP Market Revenue Share (%), by Type 2024 & 2032
- Figure 26: North America Global SRAM and ROM Design IP Market Volume Share (%), by Type 2024 & 2032
- Figure 27: North America Global SRAM and ROM Design IP Market Revenue (Million), by Application 2024 & 2032
- Figure 28: North America Global SRAM and ROM Design IP Market Volume (K Unit), by Application 2024 & 2032
- Figure 29: North America Global SRAM and ROM Design IP Market Revenue Share (%), by Application 2024 & 2032
- Figure 30: North America Global SRAM and ROM Design IP Market Volume Share (%), by Application 2024 & 2032
- Figure 31: North America Global SRAM and ROM Design IP Market Revenue (Million), by Geography 2024 & 2032
- Figure 32: North America Global SRAM and ROM Design IP Market Volume (K Unit), by Geography 2024 & 2032
- Figure 33: North America Global SRAM and ROM Design IP Market Revenue Share (%), by Geography 2024 & 2032
- Figure 34: North America Global SRAM and ROM Design IP Market Volume Share (%), by Geography 2024 & 2032
- Figure 35: North America Global SRAM and ROM Design IP Market Revenue (Million), by Country 2024 & 2032
- Figure 36: North America Global SRAM and ROM Design IP Market Volume (K Unit), by Country 2024 & 2032
- Figure 37: North America Global SRAM and ROM Design IP Market Revenue Share (%), by Country 2024 & 2032
- Figure 38: North America Global SRAM and ROM Design IP Market Volume Share (%), by Country 2024 & 2032
- Figure 39: South America Global SRAM and ROM Design IP Market Revenue (Million), by Type 2024 & 2032
- Figure 40: South America Global SRAM and ROM Design IP Market Volume (K Unit), by Type 2024 & 2032
- Figure 41: South America Global SRAM and ROM Design IP Market Revenue Share (%), by Type 2024 & 2032
- Figure 42: South America Global SRAM and ROM Design IP Market Volume Share (%), by Type 2024 & 2032
- Figure 43: South America Global SRAM and ROM Design IP Market Revenue (Million), by Application 2024 & 2032
- Figure 44: South America Global SRAM and ROM Design IP Market Volume (K Unit), by Application 2024 & 2032
- Figure 45: South America Global SRAM and ROM Design IP Market Revenue Share (%), by Application 2024 & 2032
- Figure 46: South America Global SRAM and ROM Design IP Market Volume Share (%), by Application 2024 & 2032
- Figure 47: South America Global SRAM and ROM Design IP Market Revenue (Million), by Geography 2024 & 2032
- Figure 48: South America Global SRAM and ROM Design IP Market Volume (K Unit), by Geography 2024 & 2032
- Figure 49: South America Global SRAM and ROM Design IP Market Revenue Share (%), by Geography 2024 & 2032
- Figure 50: South America Global SRAM and ROM Design IP Market Volume Share (%), by Geography 2024 & 2032
- Figure 51: South America Global SRAM and ROM Design IP Market Revenue (Million), by Country 2024 & 2032
- Figure 52: South America Global SRAM and ROM Design IP Market Volume (K Unit), by Country 2024 & 2032
- Figure 53: South America Global SRAM and ROM Design IP Market Revenue Share (%), by Country 2024 & 2032
- Figure 54: South America Global SRAM and ROM Design IP Market Volume Share (%), by Country 2024 & 2032
- Figure 55: Europe Global SRAM and ROM Design IP Market Revenue (Million), by Type 2024 & 2032
- Figure 56: Europe Global SRAM and ROM Design IP Market Volume (K Unit), by Type 2024 & 2032
- Figure 57: Europe Global SRAM and ROM Design IP Market Revenue Share (%), by Type 2024 & 2032
- Figure 58: Europe Global SRAM and ROM Design IP Market Volume Share (%), by Type 2024 & 2032
- Figure 59: Europe Global SRAM and ROM Design IP Market Revenue (Million), by Application 2024 & 2032
- Figure 60: Europe Global SRAM and ROM Design IP Market Volume (K Unit), by Application 2024 & 2032
- Figure 61: Europe Global SRAM and ROM Design IP Market Revenue Share (%), by Application 2024 & 2032
- Figure 62: Europe Global SRAM and ROM Design IP Market Volume Share (%), by Application 2024 & 2032
- Figure 63: Europe Global SRAM and ROM Design IP Market Revenue (Million), by Geography 2024 & 2032
- Figure 64: Europe Global SRAM and ROM Design IP Market Volume (K Unit), by Geography 2024 & 2032
- Figure 65: Europe Global SRAM and ROM Design IP Market Revenue Share (%), by Geography 2024 & 2032
- Figure 66: Europe Global SRAM and ROM Design IP Market Volume Share (%), by Geography 2024 & 2032
- Figure 67: Europe Global SRAM and ROM Design IP Market Revenue (Million), by Country 2024 & 2032
- Figure 68: Europe Global SRAM and ROM Design IP Market Volume (K Unit), by Country 2024 & 2032
- Figure 69: Europe Global SRAM and ROM Design IP Market Revenue Share (%), by Country 2024 & 2032
- Figure 70: Europe Global SRAM and ROM Design IP Market Volume Share (%), by Country 2024 & 2032
- Figure 71: Middle East & Africa Global SRAM and ROM Design IP Market Revenue (Million), by Type 2024 & 2032
- Figure 72: Middle East & Africa Global SRAM and ROM Design IP Market Volume (K Unit), by Type 2024 & 2032
- Figure 73: Middle East & Africa Global SRAM and ROM Design IP Market Revenue Share (%), by Type 2024 & 2032
- Figure 74: Middle East & Africa Global SRAM and ROM Design IP Market Volume Share (%), by Type 2024 & 2032
- Figure 75: Middle East & Africa Global SRAM and ROM Design IP Market Revenue (Million), by Application 2024 & 2032
- Figure 76: Middle East & Africa Global SRAM and ROM Design IP Market Volume (K Unit), by Application 2024 & 2032
- Figure 77: Middle East & Africa Global SRAM and ROM Design IP Market Revenue Share (%), by Application 2024 & 2032
- Figure 78: Middle East & Africa Global SRAM and ROM Design IP Market Volume Share (%), by Application 2024 & 2032
- Figure 79: Middle East & Africa Global SRAM and ROM Design IP Market Revenue (Million), by Geography 2024 & 2032
- Figure 80: Middle East & Africa Global SRAM and ROM Design IP Market Volume (K Unit), by Geography 2024 & 2032
- Figure 81: Middle East & Africa Global SRAM and ROM Design IP Market Revenue Share (%), by Geography 2024 & 2032
- Figure 82: Middle East & Africa Global SRAM and ROM Design IP Market Volume Share (%), by Geography 2024 & 2032
- Figure 83: Middle East & Africa Global SRAM and ROM Design IP Market Revenue (Million), by Country 2024 & 2032
- Figure 84: Middle East & Africa Global SRAM and ROM Design IP Market Volume (K Unit), by Country 2024 & 2032
- Figure 85: Middle East & Africa Global SRAM and ROM Design IP Market Revenue Share (%), by Country 2024 & 2032
- Figure 86: Middle East & Africa Global SRAM and ROM Design IP Market Volume Share (%), by Country 2024 & 2032
- Figure 87: Asia Pacific Global SRAM and ROM Design IP Market Revenue (Million), by Type 2024 & 2032
- Figure 88: Asia Pacific Global SRAM and ROM Design IP Market Volume (K Unit), by Type 2024 & 2032
- Figure 89: Asia Pacific Global SRAM and ROM Design IP Market Revenue Share (%), by Type 2024 & 2032
- Figure 90: Asia Pacific Global SRAM and ROM Design IP Market Volume Share (%), by Type 2024 & 2032
- Figure 91: Asia Pacific Global SRAM and ROM Design IP Market Revenue (Million), by Application 2024 & 2032
- Figure 92: Asia Pacific Global SRAM and ROM Design IP Market Volume (K Unit), by Application 2024 & 2032
- Figure 93: Asia Pacific Global SRAM and ROM Design IP Market Revenue Share (%), by Application 2024 & 2032
- Figure 94: Asia Pacific Global SRAM and ROM Design IP Market Volume Share (%), by Application 2024 & 2032
- Figure 95: Asia Pacific Global SRAM and ROM Design IP Market Revenue (Million), by Geography 2024 & 2032
- Figure 96: Asia Pacific Global SRAM and ROM Design IP Market Volume (K Unit), by Geography 2024 & 2032
- Figure 97: Asia Pacific Global SRAM and ROM Design IP Market Revenue Share (%), by Geography 2024 & 2032
- Figure 98: Asia Pacific Global SRAM and ROM Design IP Market Volume Share (%), by Geography 2024 & 2032
- Figure 99: Asia Pacific Global SRAM and ROM Design IP Market Revenue (Million), by Country 2024 & 2032
- Figure 100: Asia Pacific Global SRAM and ROM Design IP Market Volume (K Unit), by Country 2024 & 2032
- Figure 101: Asia Pacific Global SRAM and ROM Design IP Market Revenue Share (%), by Country 2024 & 2032
- Figure 102: Asia Pacific Global SRAM and ROM Design IP Market Volume Share (%), by Country 2024 & 2032
List of Tables
- Table 1: Global SRAM and ROM Design IP Market Revenue Million Forecast, by Region 2019 & 2032
- Table 2: Global SRAM and ROM Design IP Market Volume K Unit Forecast, by Region 2019 & 2032
- Table 3: Global SRAM and ROM Design IP Market Revenue Million Forecast, by Type 2019 & 2032
- Table 4: Global SRAM and ROM Design IP Market Volume K Unit Forecast, by Type 2019 & 2032
- Table 5: Global SRAM and ROM Design IP Market Revenue Million Forecast, by Application 2019 & 2032
- Table 6: Global SRAM and ROM Design IP Market Volume K Unit Forecast, by Application 2019 & 2032
- Table 7: Global SRAM and ROM Design IP Market Revenue Million Forecast, by Geography 2019 & 2032
- Table 8: Global SRAM and ROM Design IP Market Volume K Unit Forecast, by Geography 2019 & 2032
- Table 9: Global SRAM and ROM Design IP Market Revenue Million Forecast, by Region 2019 & 2032
- Table 10: Global SRAM and ROM Design IP Market Volume K Unit Forecast, by Region 2019 & 2032
- Table 11: Global SRAM and ROM Design IP Market Revenue Million Forecast, by Country 2019 & 2032
- Table 12: Global SRAM and ROM Design IP Market Volume K Unit Forecast, by Country 2019 & 2032
- Table 13: Global SRAM and ROM Design IP Market Revenue (Million) Forecast, by Application 2019 & 2032
- Table 14: Global SRAM and ROM Design IP Market Volume (K Unit) Forecast, by Application 2019 & 2032
- Table 15: Global SRAM and ROM Design IP Market Revenue Million Forecast, by Country 2019 & 2032
- Table 16: Global SRAM and ROM Design IP Market Volume K Unit Forecast, by Country 2019 & 2032
- Table 17: Global SRAM and ROM Design IP Market Revenue (Million) Forecast, by Application 2019 & 2032
- Table 18: Global SRAM and ROM Design IP Market Volume (K Unit) Forecast, by Application 2019 & 2032
- Table 19: Global SRAM and ROM Design IP Market Revenue Million Forecast, by Country 2019 & 2032
- Table 20: Global SRAM and ROM Design IP Market Volume K Unit Forecast, by Country 2019 & 2032
- Table 21: Global SRAM and ROM Design IP Market Revenue (Million) Forecast, by Application 2019 & 2032
- Table 22: Global SRAM and ROM Design IP Market Volume (K Unit) Forecast, by Application 2019 & 2032
- Table 23: Global SRAM and ROM Design IP Market Revenue Million Forecast, by Country 2019 & 2032
- Table 24: Global SRAM and ROM Design IP Market Volume K Unit Forecast, by Country 2019 & 2032
- Table 25: Global SRAM and ROM Design IP Market Revenue (Million) Forecast, by Application 2019 & 2032
- Table 26: Global SRAM and ROM Design IP Market Volume (K Unit) Forecast, by Application 2019 & 2032
- Table 27: Global SRAM and ROM Design IP Market Revenue Million Forecast, by Country 2019 & 2032
- Table 28: Global SRAM and ROM Design IP Market Volume K Unit Forecast, by Country 2019 & 2032
- Table 29: Global SRAM and ROM Design IP Market Revenue (Million) Forecast, by Application 2019 & 2032
- Table 30: Global SRAM and ROM Design IP Market Volume (K Unit) Forecast, by Application 2019 & 2032
- Table 31: Global SRAM and ROM Design IP Market Revenue Million Forecast, by Type 2019 & 2032
- Table 32: Global SRAM and ROM Design IP Market Volume K Unit Forecast, by Type 2019 & 2032
- Table 33: Global SRAM and ROM Design IP Market Revenue Million Forecast, by Application 2019 & 2032
- Table 34: Global SRAM and ROM Design IP Market Volume K Unit Forecast, by Application 2019 & 2032
- Table 35: Global SRAM and ROM Design IP Market Revenue Million Forecast, by Geography 2019 & 2032
- Table 36: Global SRAM and ROM Design IP Market Volume K Unit Forecast, by Geography 2019 & 2032
- Table 37: Global SRAM and ROM Design IP Market Revenue Million Forecast, by Country 2019 & 2032
- Table 38: Global SRAM and ROM Design IP Market Volume K Unit Forecast, by Country 2019 & 2032
- Table 39: United States Global SRAM and ROM Design IP Market Revenue (Million) Forecast, by Application 2019 & 2032
- Table 40: United States Global SRAM and ROM Design IP Market Volume (K Unit) Forecast, by Application 2019 & 2032
- Table 41: Canada Global SRAM and ROM Design IP Market Revenue (Million) Forecast, by Application 2019 & 2032
- Table 42: Canada Global SRAM and ROM Design IP Market Volume (K Unit) Forecast, by Application 2019 & 2032
- Table 43: Mexico Global SRAM and ROM Design IP Market Revenue (Million) Forecast, by Application 2019 & 2032
- Table 44: Mexico Global SRAM and ROM Design IP Market Volume (K Unit) Forecast, by Application 2019 & 2032
- Table 45: Global SRAM and ROM Design IP Market Revenue Million Forecast, by Type 2019 & 2032
- Table 46: Global SRAM and ROM Design IP Market Volume K Unit Forecast, by Type 2019 & 2032
- Table 47: Global SRAM and ROM Design IP Market Revenue Million Forecast, by Application 2019 & 2032
- Table 48: Global SRAM and ROM Design IP Market Volume K Unit Forecast, by Application 2019 & 2032
- Table 49: Global SRAM and ROM Design IP Market Revenue Million Forecast, by Geography 2019 & 2032
- Table 50: Global SRAM and ROM Design IP Market Volume K Unit Forecast, by Geography 2019 & 2032
- Table 51: Global SRAM and ROM Design IP Market Revenue Million Forecast, by Country 2019 & 2032
- Table 52: Global SRAM and ROM Design IP Market Volume K Unit Forecast, by Country 2019 & 2032
- Table 53: Brazil Global SRAM and ROM Design IP Market Revenue (Million) Forecast, by Application 2019 & 2032
- Table 54: Brazil Global SRAM and ROM Design IP Market Volume (K Unit) Forecast, by Application 2019 & 2032
- Table 55: Argentina Global SRAM and ROM Design IP Market Revenue (Million) Forecast, by Application 2019 & 2032
- Table 56: Argentina Global SRAM and ROM Design IP Market Volume (K Unit) Forecast, by Application 2019 & 2032
- Table 57: Rest of South America Global SRAM and ROM Design IP Market Revenue (Million) Forecast, by Application 2019 & 2032
- Table 58: Rest of South America Global SRAM and ROM Design IP Market Volume (K Unit) Forecast, by Application 2019 & 2032
- Table 59: Global SRAM and ROM Design IP Market Revenue Million Forecast, by Type 2019 & 2032
- Table 60: Global SRAM and ROM Design IP Market Volume K Unit Forecast, by Type 2019 & 2032
- Table 61: Global SRAM and ROM Design IP Market Revenue Million Forecast, by Application 2019 & 2032
- Table 62: Global SRAM and ROM Design IP Market Volume K Unit Forecast, by Application 2019 & 2032
- Table 63: Global SRAM and ROM Design IP Market Revenue Million Forecast, by Geography 2019 & 2032
- Table 64: Global SRAM and ROM Design IP Market Volume K Unit Forecast, by Geography 2019 & 2032
- Table 65: Global SRAM and ROM Design IP Market Revenue Million Forecast, by Country 2019 & 2032
- Table 66: Global SRAM and ROM Design IP Market Volume K Unit Forecast, by Country 2019 & 2032
- Table 67: United Kingdom Global SRAM and ROM Design IP Market Revenue (Million) Forecast, by Application 2019 & 2032
- Table 68: United Kingdom Global SRAM and ROM Design IP Market Volume (K Unit) Forecast, by Application 2019 & 2032
- Table 69: Germany Global SRAM and ROM Design IP Market Revenue (Million) Forecast, by Application 2019 & 2032
- Table 70: Germany Global SRAM and ROM Design IP Market Volume (K Unit) Forecast, by Application 2019 & 2032
- Table 71: France Global SRAM and ROM Design IP Market Revenue (Million) Forecast, by Application 2019 & 2032
- Table 72: France Global SRAM and ROM Design IP Market Volume (K Unit) Forecast, by Application 2019 & 2032
- Table 73: Italy Global SRAM and ROM Design IP Market Revenue (Million) Forecast, by Application 2019 & 2032
- Table 74: Italy Global SRAM and ROM Design IP Market Volume (K Unit) Forecast, by Application 2019 & 2032
- Table 75: Spain Global SRAM and ROM Design IP Market Revenue (Million) Forecast, by Application 2019 & 2032
- Table 76: Spain Global SRAM and ROM Design IP Market Volume (K Unit) Forecast, by Application 2019 & 2032
- Table 77: Russia Global SRAM and ROM Design IP Market Revenue (Million) Forecast, by Application 2019 & 2032
- Table 78: Russia Global SRAM and ROM Design IP Market Volume (K Unit) Forecast, by Application 2019 & 2032
- Table 79: Benelux Global SRAM and ROM Design IP Market Revenue (Million) Forecast, by Application 2019 & 2032
- Table 80: Benelux Global SRAM and ROM Design IP Market Volume (K Unit) Forecast, by Application 2019 & 2032
- Table 81: Nordics Global SRAM and ROM Design IP Market Revenue (Million) Forecast, by Application 2019 & 2032
- Table 82: Nordics Global SRAM and ROM Design IP Market Volume (K Unit) Forecast, by Application 2019 & 2032
- Table 83: Rest of Europe Global SRAM and ROM Design IP Market Revenue (Million) Forecast, by Application 2019 & 2032
- Table 84: Rest of Europe Global SRAM and ROM Design IP Market Volume (K Unit) Forecast, by Application 2019 & 2032
- Table 85: Global SRAM and ROM Design IP Market Revenue Million Forecast, by Type 2019 & 2032
- Table 86: Global SRAM and ROM Design IP Market Volume K Unit Forecast, by Type 2019 & 2032
- Table 87: Global SRAM and ROM Design IP Market Revenue Million Forecast, by Application 2019 & 2032
- Table 88: Global SRAM and ROM Design IP Market Volume K Unit Forecast, by Application 2019 & 2032
- Table 89: Global SRAM and ROM Design IP Market Revenue Million Forecast, by Geography 2019 & 2032
- Table 90: Global SRAM and ROM Design IP Market Volume K Unit Forecast, by Geography 2019 & 2032
- Table 91: Global SRAM and ROM Design IP Market Revenue Million Forecast, by Country 2019 & 2032
- Table 92: Global SRAM and ROM Design IP Market Volume K Unit Forecast, by Country 2019 & 2032
- Table 93: Turkey Global SRAM and ROM Design IP Market Revenue (Million) Forecast, by Application 2019 & 2032
- Table 94: Turkey Global SRAM and ROM Design IP Market Volume (K Unit) Forecast, by Application 2019 & 2032
- Table 95: Israel Global SRAM and ROM Design IP Market Revenue (Million) Forecast, by Application 2019 & 2032
- Table 96: Israel Global SRAM and ROM Design IP Market Volume (K Unit) Forecast, by Application 2019 & 2032
- Table 97: GCC Global SRAM and ROM Design IP Market Revenue (Million) Forecast, by Application 2019 & 2032
- Table 98: GCC Global SRAM and ROM Design IP Market Volume (K Unit) Forecast, by Application 2019 & 2032
- Table 99: North Africa Global SRAM and ROM Design IP Market Revenue (Million) Forecast, by Application 2019 & 2032
- Table 100: North Africa Global SRAM and ROM Design IP Market Volume (K Unit) Forecast, by Application 2019 & 2032
- Table 101: South Africa Global SRAM and ROM Design IP Market Revenue (Million) Forecast, by Application 2019 & 2032
- Table 102: South Africa Global SRAM and ROM Design IP Market Volume (K Unit) Forecast, by Application 2019 & 2032
- Table 103: Rest of Middle East & Africa Global SRAM and ROM Design IP Market Revenue (Million) Forecast, by Application 2019 & 2032
- Table 104: Rest of Middle East & Africa Global SRAM and ROM Design IP Market Volume (K Unit) Forecast, by Application 2019 & 2032
- Table 105: Global SRAM and ROM Design IP Market Revenue Million Forecast, by Type 2019 & 2032
- Table 106: Global SRAM and ROM Design IP Market Volume K Unit Forecast, by Type 2019 & 2032
- Table 107: Global SRAM and ROM Design IP Market Revenue Million Forecast, by Application 2019 & 2032
- Table 108: Global SRAM and ROM Design IP Market Volume K Unit Forecast, by Application 2019 & 2032
- Table 109: Global SRAM and ROM Design IP Market Revenue Million Forecast, by Geography 2019 & 2032
- Table 110: Global SRAM and ROM Design IP Market Volume K Unit Forecast, by Geography 2019 & 2032
- Table 111: Global SRAM and ROM Design IP Market Revenue Million Forecast, by Country 2019 & 2032
- Table 112: Global SRAM and ROM Design IP Market Volume K Unit Forecast, by Country 2019 & 2032
- Table 113: China Global SRAM and ROM Design IP Market Revenue (Million) Forecast, by Application 2019 & 2032
- Table 114: China Global SRAM and ROM Design IP Market Volume (K Unit) Forecast, by Application 2019 & 2032
- Table 115: India Global SRAM and ROM Design IP Market Revenue (Million) Forecast, by Application 2019 & 2032
- Table 116: India Global SRAM and ROM Design IP Market Volume (K Unit) Forecast, by Application 2019 & 2032
- Table 117: Japan Global SRAM and ROM Design IP Market Revenue (Million) Forecast, by Application 2019 & 2032
- Table 118: Japan Global SRAM and ROM Design IP Market Volume (K Unit) Forecast, by Application 2019 & 2032
- Table 119: South Korea Global SRAM and ROM Design IP Market Revenue (Million) Forecast, by Application 2019 & 2032
- Table 120: South Korea Global SRAM and ROM Design IP Market Volume (K Unit) Forecast, by Application 2019 & 2032
- Table 121: ASEAN Global SRAM and ROM Design IP Market Revenue (Million) Forecast, by Application 2019 & 2032
- Table 122: ASEAN Global SRAM and ROM Design IP Market Volume (K Unit) Forecast, by Application 2019 & 2032
- Table 123: Oceania Global SRAM and ROM Design IP Market Revenue (Million) Forecast, by Application 2019 & 2032
- Table 124: Oceania Global SRAM and ROM Design IP Market Volume (K Unit) Forecast, by Application 2019 & 2032
- Table 125: Rest of Asia Pacific Global SRAM and ROM Design IP Market Revenue (Million) Forecast, by Application 2019 & 2032
- Table 126: Rest of Asia Pacific Global SRAM and ROM Design IP Market Volume (K Unit) Forecast, by Application 2019 & 2032
Frequently Asked Questions
1. What is the projected Compound Annual Growth Rate (CAGR) of the Global SRAM and ROM Design IP Market?
The projected CAGR is approximately -1.54%.
2. Which companies are prominent players in the Global SRAM and ROM Design IP Market?
Key companies in the market include Avalanche Technology Inc, Everspin Technologies Inc, TekStart LLC, Verisilicon Holdings Co Ltd, Xilinx Inc, Dolphin Design SAS, Arm Holdings, Dolphin Technology Inc, Surecore Ltd, Renesas Electronics Corporation, Synopsys Inc, TDK Corporation, eMemory Technology Inc, Mentor Graphics Corporation.
3. What are the main segments of the Global SRAM and ROM Design IP Market?
The market segments include Type, Application, Geography.
4. Can you provide details about the market size?
The market size is estimated to be USD XX Million as of 2022.
5. What are some drivers contributing to market growth?
Increase in Demand for Autonomous Driving Technology; Growth in Edge Analytics for IoT Application.
6. What are the notable trends driving market growth?
Increasing Demand For Enterprise Storage Applications to Drive the Growth for MRAM.
7. Are there any restraints impacting market growth?
Complexity in Design and AI Interface.
8. Can you provide examples of recent developments in the market?
N/A
9. What pricing options are available for accessing the report?
Pricing options include single-user, multi-user, and enterprise licenses priced at USD 3800, USD 4500, and USD 5800 respectively.
10. Is the market size provided in terms of value or volume?
The market size is provided in terms of value, measured in Million and volume, measured in K Unit.
11. Are there any specific market keywords associated with the report?
Yes, the market keyword associated with the report is "Global SRAM and ROM Design IP Market," which aids in identifying and referencing the specific market segment covered.
12. How do I determine which pricing option suits my needs best?
The pricing options vary based on user requirements and access needs. Individual users may opt for single-user licenses, while businesses requiring broader access may choose multi-user or enterprise licenses for cost-effective access to the report.
13. Are there any additional resources or data provided in the Global SRAM and ROM Design IP Market report?
While the report offers comprehensive insights, it's advisable to review the specific contents or supplementary materials provided to ascertain if additional resources or data are available.
14. How can I stay updated on further developments or reports in the Global SRAM and ROM Design IP Market?
To stay informed about further developments, trends, and reports in the Global SRAM and ROM Design IP Market, consider subscribing to industry newsletters, following relevant companies and organizations, or regularly checking reputable industry news sources and publications.
Methodology
Step 1 - Identification of Relevant Samples Size from Population Database


Step 2 - Approaches for Defining Global Market Size (Value, Volume* & Price*)

Note*: In applicable scenarios
Step 3 - Data Sources
Primary Research
- Web Analytics
- Survey Reports
- Research Institute
- Latest Research Reports
- Opinion Leaders
Secondary Research
- Annual Reports
- White Paper
- Latest Press Release
- Industry Association
- Paid Database
- Investor Presentations

Step 4 - Data Triangulation
Involves using different sources of information in order to increase the validity of a study
These sources are likely to be stakeholders in a program - participants, other researchers, program staff, other community members, and so on.
Then we put all data in single framework & apply various statistical tools to find out the dynamic on the market.
During the analysis stage, feedback from the stakeholder groups would be compared to determine areas of agreement as well as areas of divergence
