

Key Insights
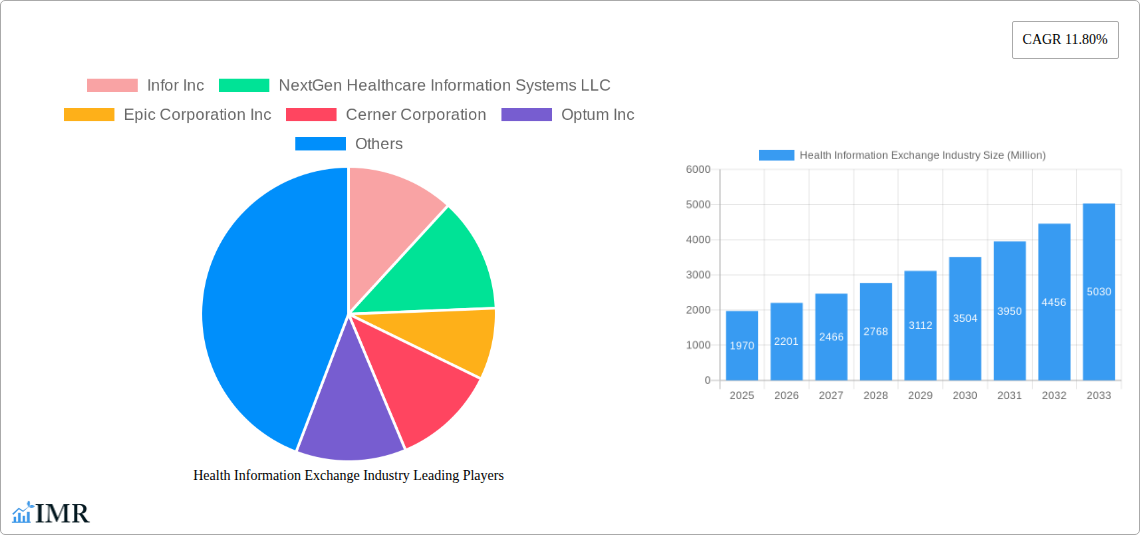
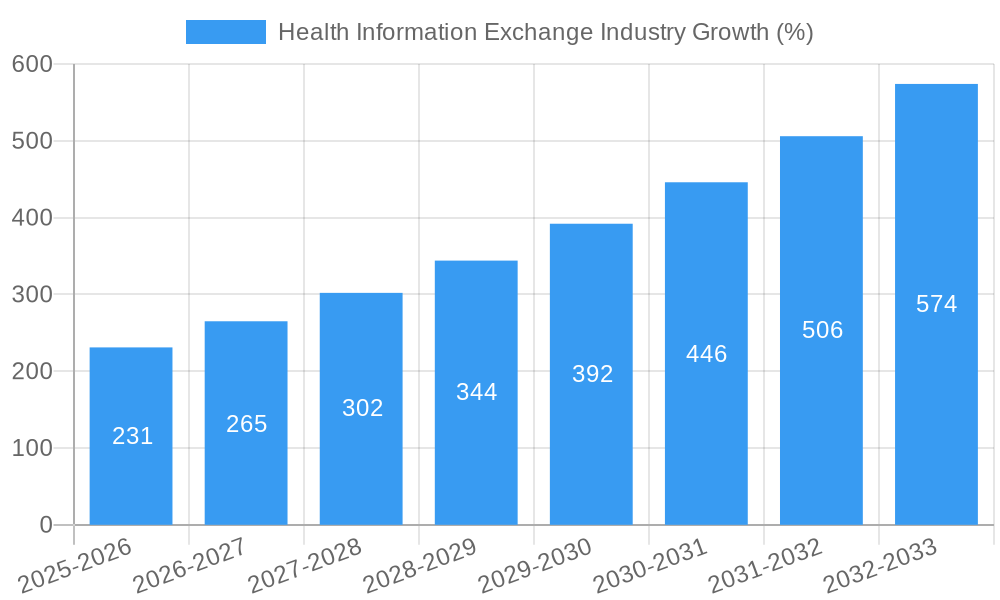
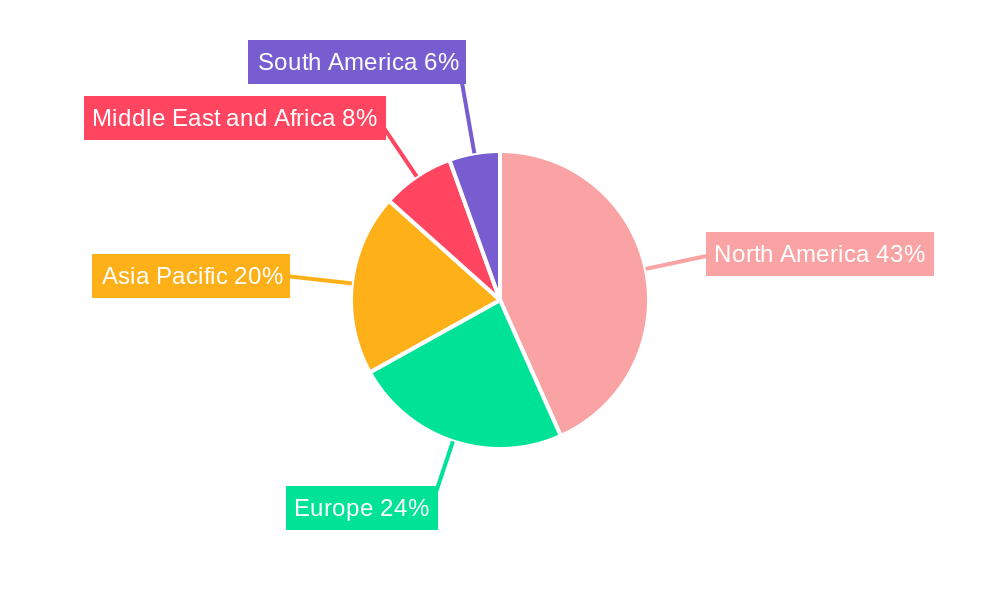
The Health Information Exchange (HIE) market is experiencing robust growth, projected to reach a market size of $1.97 billion in 2025 and maintain a Compound Annual Growth Rate (CAGR) of 11.80% from 2025 to 2033. This expansion is fueled by several key drivers. The increasing need for interoperability among healthcare systems to improve patient care and reduce healthcare costs is a primary factor. Government regulations mandating data sharing and the rise of value-based care models further incentivize HIE adoption. Technological advancements, such as cloud computing and artificial intelligence, are also contributing to enhanced efficiency and scalability of HIE solutions. Growth is particularly strong in segments like centralized/consolidated models due to their streamlined management and improved data consistency, and in applications such as secure messaging and workflow management, reflecting a rising demand for real-time communication and efficient administrative processes. The North American market currently dominates, driven by early adoption and advanced healthcare infrastructure, but the Asia-Pacific region exhibits significant growth potential due to rising healthcare expenditure and increasing digitalization initiatives. However, challenges remain, including data privacy and security concerns, interoperability issues between different systems, and the high initial investment costs associated with HIE implementation.
Despite these challenges, the long-term outlook for the HIE market remains positive. The increasing prevalence of chronic diseases and the aging global population necessitate improved healthcare coordination and data sharing. The continued development of sophisticated HIE solutions addressing data security and interoperability concerns will further fuel market growth. The rising adoption of telehealth and remote patient monitoring also creates new opportunities for HIE solutions to integrate diverse data streams and improve patient outcomes. Future growth will likely be driven by the increasing adoption of hybrid models, offering a balance between centralized control and decentralized flexibility. Expansion into emerging markets in Asia-Pacific and other regions will also significantly contribute to the overall market growth. The major players in the market, including Infor Inc, NextGen Healthcare, Epic Corporation, and Cerner Corporation, are strategically positioning themselves to capitalize on these trends through product innovation and strategic partnerships.
Health Information Exchange (HIE) Industry Market Report: 2019-2033
This comprehensive report provides an in-depth analysis of the Health Information Exchange (HIE) industry, encompassing market dynamics, growth trends, regional dominance, product landscape, key players, and future outlook. The report covers the period from 2019 to 2033, with a focus on 2025 as the base and estimated year. The market is segmented by implementation model, setup type, application, exchange type, component, and end-user, providing granular insights into the parent and child markets. The total market size is projected to reach xx Million by 2033.
Health Information Exchange Industry Market Dynamics & Structure
The HIE market is characterized by moderate concentration, with key players like Cerner Corporation, Epic Corporation Inc, and Allscripts Healthcare Solutions Inc holding significant market share. However, the market is dynamic, driven by technological innovation, particularly in areas like AI-powered analytics and blockchain integration for enhanced data security and interoperability. Regulatory frameworks, such as HIPAA in the US and similar data privacy regulations globally, significantly influence market growth and adoption. The competitive landscape includes substitutes like standalone EHR systems, though HIEs offer superior interoperability and data sharing capabilities. M&A activity remains moderate, with xx deals recorded between 2019 and 2024, primarily focused on expanding functionalities and geographical reach. End-user demographics are predominantly healthcare providers, but the public health sector is rapidly adopting HIE systems for disease surveillance and public health initiatives.
- Market Concentration: Moderately concentrated, with top 5 players holding xx% market share in 2025.
- Technological Innovation Drivers: AI, Blockchain, Cloud Computing.
- Regulatory Landscape: HIPAA (US), GDPR (EU), and other regional data privacy laws.
- Competitive Substitutes: Standalone EHR systems, but with limited interoperability.
- M&A Activity: xx deals between 2019-2024, primarily for expansion and enhanced functionality.
- Innovation Barriers: High implementation costs, interoperability challenges, data security concerns.
Health Information Exchange Industry Growth Trends & Insights
The HIE market exhibited robust growth during the historical period (2019-2024), with a CAGR of xx%. This growth is projected to continue during the forecast period (2025-2033), albeit at a slightly moderated pace, reaching a CAGR of xx%. Increased adoption by healthcare providers, driven by the need for improved patient care coordination and reduced healthcare costs, is a major factor. Technological advancements such as cloud-based HIE solutions are enhancing scalability and accessibility. Shifts in consumer behavior, with patients demanding greater control over their health data, further fuel HIE adoption. Market penetration is expected to increase from xx% in 2025 to xx% by 2033. Disruptive technologies, such as the implementation of federated learning for improved data analysis while preserving patient privacy, contribute to the positive outlook.
Dominant Regions, Countries, or Segments in Health Information Exchange Industry
North America, specifically the US, dominates the HIE market due to robust healthcare infrastructure, advanced technology adoption, and established regulatory frameworks. The centralized/consolidated implementation model holds a significant market share, owing to its efficiency in managing large data volumes. Within applications, secure messaging and workflow management are currently the most widely adopted, driving substantial revenue. Public health agencies are major end-users, particularly in developed nations.
- Leading Region: North America (US)
- Dominant Implementation Model: Centralized/Consolidated
- Key Application Segments: Secure Messaging, Workflow Management
- Major End-User: Public Health Agencies
- Growth Drivers: Government initiatives supporting interoperability, increasing focus on value-based care.
Health Information Exchange Industry Product Landscape
HIE products are evolving to include advanced analytics, predictive modeling capabilities, and improved user interfaces. Key features include robust security protocols, compliance with data privacy regulations, and seamless integration with existing EHR systems. Unique selling propositions include the ability to improve patient care coordination, enhance population health management, and reduce administrative burdens for healthcare providers. Technological advancements such as AI and machine learning are enhancing data analysis and decision-making capabilities.
Key Drivers, Barriers & Challenges in Health Information Exchange Industry
Key Drivers: Increasing government mandates for interoperability, rising demand for improved patient care coordination, and growing adoption of value-based care models.
Challenges: High initial investment costs, interoperability issues between different systems, data security and privacy concerns, and the complexity of implementing and maintaining HIE systems. These challenges result in a xx% market penetration rate, representing a significant untapped potential.
Emerging Opportunities in Health Information Exchange Industry
Emerging opportunities lie in the expansion into untapped markets, such as developing economies. Innovations in areas like telehealth integration and blockchain technology for secure data sharing present significant growth avenues. The increasing focus on consumer-mediated exchange, empowering patients with greater control over their health data, represents a significant opportunity for HIE providers.
Growth Accelerators in the Health Information Exchange Industry
Long-term growth will be fueled by technological advancements, strategic partnerships between HIE vendors and healthcare providers, and expansion into new geographical markets. Government support for interoperability initiatives and the increasing focus on population health management will act as strong catalysts for market growth.
Key Players Shaping the Health Information Exchange Industry Market
- Infor Inc
- NextGen Healthcare Information Systems LLC
- Epic Corporation Inc
- Cerner Corporation
- Optum Inc
- Open Text Corporation
- Allscripts Healthcare Solutions Inc
- Conifer Health Solutions
- Medicity Inc
- Orion Health
Notable Milestones in Health Information Exchange Industry Sector
- 2020: Increased focus on telehealth integration following the COVID-19 pandemic.
- 2022: Launch of several new HIE platforms incorporating AI-powered analytics.
- 2023: Significant government investments in interoperability infrastructure in several countries.
In-Depth Health Information Exchange Industry Market Outlook
The HIE market is poised for significant growth over the next decade. Technological advancements, strategic partnerships, and supportive regulatory frameworks will contribute to expanding market penetration and creating new opportunities for innovation. The focus on improved data security, consumer empowerment, and population health management will shape the future trajectory of the HIE industry. Strategic investments in R&D and expansion into new geographical markets will be crucial for success in this evolving landscape.
Health Information Exchange Industry Segmentation
-
1. Implementation Model
- 1.1. Centralized /Consolidated Models
- 1.2. Decentralized / Federated Models
- 1.3. Hybrid Model
-
2. Setup Type
- 2.1. Private
- 2.2. Public
-
3. Application
- 3.1. Internal Interfacing
- 3.2. Secure Messaging
- 3.3. Work Flow Management
- 3.4. Web portal Development
- 3.5. Other Applications
-
4. Exchange Type
- 4.1. Direct Exchange
- 4.2. Query-based Exchange
- 4.3. Consumer Mediated Exchange
-
5. Component
- 5.1. Enterprise Master Person Index (EMPI)
- 5.2. Healthcare Provider Directory (HPD)
- 5.3. Record Locator Service (RLS)
- 5.4. Clinical Data Repository
- 5.5. Other Components
-
6. End User
- 6.1. Public Health Agencies
- 6.2. Healthcare Providers
- 6.3. Others
Health Information Exchange Industry Segmentation By Geography
-
1. North America
- 1.1. United States
- 1.2. Canada
- 1.3. Mexico
-
2. Europe
- 2.1. Germany
- 2.2. United Kingdom
- 2.3. France
- 2.4. Italy
- 2.5. Spain
- 2.6. Rest of Europe
-
3. Asia Pacific
- 3.1. China
- 3.2. Japan
- 3.3. India
- 3.4. Australia
- 3.5. South Korea
- 3.6. Rest of Asia Pacific
-
4. Middle East and Africa
- 4.1. GCC
- 4.2. South Africa
- 4.3. Rest of Middle East and Africa
-
5. South America
- 5.1. Brazil
- 5.2. Argentina
- 5.3. Rest of South America
Health Information Exchange Industry REPORT HIGHLIGHTS
| Aspects | Details |
|---|---|
| Study Period | 2019-2033 |
| Base Year | 2024 |
| Estimated Year | 2025 |
| Forecast Period | 2025-2033 |
| Historical Period | 2019-2024 |
| Growth Rate | CAGR of 11.80% from 2019-2033 |
| Segmentation |
|
Table of Contents
- 1. Introduction
- 1.1. Research Scope
- 1.2. Market Segmentation
- 1.3. Research Methodology
- 1.4. Definitions and Assumptions
- 2. Executive Summary
- 2.1. Introduction
- 3. Market Dynamics
- 3.1. Introduction
- 3.2. Market Drivers
- 3.2.1. ; Growing Demand for Healthcare Data Exchange; Government Support in Creating Infrastructure for Data Exchange
- 3.3. Market Restrains
- 3.3.1. ; Huge Initial Infrastructural Investment; Data Privacy and Security Concerns
- 3.4. Market Trends
- 3.4.1. Hybrid Model Segment is Expected to Have Significant Share
- 4. Market Factor Analysis
- 4.1. Porters Five Forces
- 4.2. Supply/Value Chain
- 4.3. PESTEL analysis
- 4.4. Market Entropy
- 4.5. Patent/Trademark Analysis
- 5. Global Health Information Exchange Industry Analysis, Insights and Forecast, 2019-2031
- 5.1. Market Analysis, Insights and Forecast - by Implementation Model
- 5.1.1. Centralized /Consolidated Models
- 5.1.2. Decentralized / Federated Models
- 5.1.3. Hybrid Model
- 5.2. Market Analysis, Insights and Forecast - by Setup Type
- 5.2.1. Private
- 5.2.2. Public
- 5.3. Market Analysis, Insights and Forecast - by Application
- 5.3.1. Internal Interfacing
- 5.3.2. Secure Messaging
- 5.3.3. Work Flow Management
- 5.3.4. Web portal Development
- 5.3.5. Other Applications
- 5.4. Market Analysis, Insights and Forecast - by Exchange Type
- 5.4.1. Direct Exchange
- 5.4.2. Query-based Exchange
- 5.4.3. Consumer Mediated Exchange
- 5.5. Market Analysis, Insights and Forecast - by Component
- 5.5.1. Enterprise Master Person Index (EMPI)
- 5.5.2. Healthcare Provider Directory (HPD)
- 5.5.3. Record Locator Service (RLS)
- 5.5.4. Clinical Data Repository
- 5.5.5. Other Components
- 5.6. Market Analysis, Insights and Forecast - by End User
- 5.6.1. Public Health Agencies
- 5.6.2. Healthcare Providers
- 5.6.3. Others
- 5.7. Market Analysis, Insights and Forecast - by Region
- 5.7.1. North America
- 5.7.2. Europe
- 5.7.3. Asia Pacific
- 5.7.4. Middle East and Africa
- 5.7.5. South America
- 5.1. Market Analysis, Insights and Forecast - by Implementation Model
- 6. North America Health Information Exchange Industry Analysis, Insights and Forecast, 2019-2031
- 6.1. Market Analysis, Insights and Forecast - by Implementation Model
- 6.1.1. Centralized /Consolidated Models
- 6.1.2. Decentralized / Federated Models
- 6.1.3. Hybrid Model
- 6.2. Market Analysis, Insights and Forecast - by Setup Type
- 6.2.1. Private
- 6.2.2. Public
- 6.3. Market Analysis, Insights and Forecast - by Application
- 6.3.1. Internal Interfacing
- 6.3.2. Secure Messaging
- 6.3.3. Work Flow Management
- 6.3.4. Web portal Development
- 6.3.5. Other Applications
- 6.4. Market Analysis, Insights and Forecast - by Exchange Type
- 6.4.1. Direct Exchange
- 6.4.2. Query-based Exchange
- 6.4.3. Consumer Mediated Exchange
- 6.5. Market Analysis, Insights and Forecast - by Component
- 6.5.1. Enterprise Master Person Index (EMPI)
- 6.5.2. Healthcare Provider Directory (HPD)
- 6.5.3. Record Locator Service (RLS)
- 6.5.4. Clinical Data Repository
- 6.5.5. Other Components
- 6.6. Market Analysis, Insights and Forecast - by End User
- 6.6.1. Public Health Agencies
- 6.6.2. Healthcare Providers
- 6.6.3. Others
- 6.1. Market Analysis, Insights and Forecast - by Implementation Model
- 7. Europe Health Information Exchange Industry Analysis, Insights and Forecast, 2019-2031
- 7.1. Market Analysis, Insights and Forecast - by Implementation Model
- 7.1.1. Centralized /Consolidated Models
- 7.1.2. Decentralized / Federated Models
- 7.1.3. Hybrid Model
- 7.2. Market Analysis, Insights and Forecast - by Setup Type
- 7.2.1. Private
- 7.2.2. Public
- 7.3. Market Analysis, Insights and Forecast - by Application
- 7.3.1. Internal Interfacing
- 7.3.2. Secure Messaging
- 7.3.3. Work Flow Management
- 7.3.4. Web portal Development
- 7.3.5. Other Applications
- 7.4. Market Analysis, Insights and Forecast - by Exchange Type
- 7.4.1. Direct Exchange
- 7.4.2. Query-based Exchange
- 7.4.3. Consumer Mediated Exchange
- 7.5. Market Analysis, Insights and Forecast - by Component
- 7.5.1. Enterprise Master Person Index (EMPI)
- 7.5.2. Healthcare Provider Directory (HPD)
- 7.5.3. Record Locator Service (RLS)
- 7.5.4. Clinical Data Repository
- 7.5.5. Other Components
- 7.6. Market Analysis, Insights and Forecast - by End User
- 7.6.1. Public Health Agencies
- 7.6.2. Healthcare Providers
- 7.6.3. Others
- 7.1. Market Analysis, Insights and Forecast - by Implementation Model
- 8. Asia Pacific Health Information Exchange Industry Analysis, Insights and Forecast, 2019-2031
- 8.1. Market Analysis, Insights and Forecast - by Implementation Model
- 8.1.1. Centralized /Consolidated Models
- 8.1.2. Decentralized / Federated Models
- 8.1.3. Hybrid Model
- 8.2. Market Analysis, Insights and Forecast - by Setup Type
- 8.2.1. Private
- 8.2.2. Public
- 8.3. Market Analysis, Insights and Forecast - by Application
- 8.3.1. Internal Interfacing
- 8.3.2. Secure Messaging
- 8.3.3. Work Flow Management
- 8.3.4. Web portal Development
- 8.3.5. Other Applications
- 8.4. Market Analysis, Insights and Forecast - by Exchange Type
- 8.4.1. Direct Exchange
- 8.4.2. Query-based Exchange
- 8.4.3. Consumer Mediated Exchange
- 8.5. Market Analysis, Insights and Forecast - by Component
- 8.5.1. Enterprise Master Person Index (EMPI)
- 8.5.2. Healthcare Provider Directory (HPD)
- 8.5.3. Record Locator Service (RLS)
- 8.5.4. Clinical Data Repository
- 8.5.5. Other Components
- 8.6. Market Analysis, Insights and Forecast - by End User
- 8.6.1. Public Health Agencies
- 8.6.2. Healthcare Providers
- 8.6.3. Others
- 8.1. Market Analysis, Insights and Forecast - by Implementation Model
- 9. Middle East and Africa Health Information Exchange Industry Analysis, Insights and Forecast, 2019-2031
- 9.1. Market Analysis, Insights and Forecast - by Implementation Model
- 9.1.1. Centralized /Consolidated Models
- 9.1.2. Decentralized / Federated Models
- 9.1.3. Hybrid Model
- 9.2. Market Analysis, Insights and Forecast - by Setup Type
- 9.2.1. Private
- 9.2.2. Public
- 9.3. Market Analysis, Insights and Forecast - by Application
- 9.3.1. Internal Interfacing
- 9.3.2. Secure Messaging
- 9.3.3. Work Flow Management
- 9.3.4. Web portal Development
- 9.3.5. Other Applications
- 9.4. Market Analysis, Insights and Forecast - by Exchange Type
- 9.4.1. Direct Exchange
- 9.4.2. Query-based Exchange
- 9.4.3. Consumer Mediated Exchange
- 9.5. Market Analysis, Insights and Forecast - by Component
- 9.5.1. Enterprise Master Person Index (EMPI)
- 9.5.2. Healthcare Provider Directory (HPD)
- 9.5.3. Record Locator Service (RLS)
- 9.5.4. Clinical Data Repository
- 9.5.5. Other Components
- 9.6. Market Analysis, Insights and Forecast - by End User
- 9.6.1. Public Health Agencies
- 9.6.2. Healthcare Providers
- 9.6.3. Others
- 9.1. Market Analysis, Insights and Forecast - by Implementation Model
- 10. South America Health Information Exchange Industry Analysis, Insights and Forecast, 2019-2031
- 10.1. Market Analysis, Insights and Forecast - by Implementation Model
- 10.1.1. Centralized /Consolidated Models
- 10.1.2. Decentralized / Federated Models
- 10.1.3. Hybrid Model
- 10.2. Market Analysis, Insights and Forecast - by Setup Type
- 10.2.1. Private
- 10.2.2. Public
- 10.3. Market Analysis, Insights and Forecast - by Application
- 10.3.1. Internal Interfacing
- 10.3.2. Secure Messaging
- 10.3.3. Work Flow Management
- 10.3.4. Web portal Development
- 10.3.5. Other Applications
- 10.4. Market Analysis, Insights and Forecast - by Exchange Type
- 10.4.1. Direct Exchange
- 10.4.2. Query-based Exchange
- 10.4.3. Consumer Mediated Exchange
- 10.5. Market Analysis, Insights and Forecast - by Component
- 10.5.1. Enterprise Master Person Index (EMPI)
- 10.5.2. Healthcare Provider Directory (HPD)
- 10.5.3. Record Locator Service (RLS)
- 10.5.4. Clinical Data Repository
- 10.5.5. Other Components
- 10.6. Market Analysis, Insights and Forecast - by End User
- 10.6.1. Public Health Agencies
- 10.6.2. Healthcare Providers
- 10.6.3. Others
- 10.1. Market Analysis, Insights and Forecast - by Implementation Model
- 11. North America Health Information Exchange Industry Analysis, Insights and Forecast, 2019-2031
- 11.1. Market Analysis, Insights and Forecast - By Country/Sub-region
- 11.1.1 United States
- 11.1.2 Canada
- 11.1.3 Mexico
- 12. Europe Health Information Exchange Industry Analysis, Insights and Forecast, 2019-2031
- 12.1. Market Analysis, Insights and Forecast - By Country/Sub-region
- 12.1.1 Germany
- 12.1.2 United Kingdom
- 12.1.3 France
- 12.1.4 Italy
- 12.1.5 Spain
- 12.1.6 Rest of Europe
- 13. Asia Pacific Health Information Exchange Industry Analysis, Insights and Forecast, 2019-2031
- 13.1. Market Analysis, Insights and Forecast - By Country/Sub-region
- 13.1.1 China
- 13.1.2 Japan
- 13.1.3 India
- 13.1.4 Australia
- 13.1.5 South Korea
- 13.1.6 Rest of Asia Pacific
- 14. Middle East and Africa Health Information Exchange Industry Analysis, Insights and Forecast, 2019-2031
- 14.1. Market Analysis, Insights and Forecast - By Country/Sub-region
- 14.1.1 GCC
- 14.1.2 South Africa
- 14.1.3 Rest of Middle East and Africa
- 15. South America Health Information Exchange Industry Analysis, Insights and Forecast, 2019-2031
- 15.1. Market Analysis, Insights and Forecast - By Country/Sub-region
- 15.1.1 Brazil
- 15.1.2 Argentina
- 15.1.3 Rest of South America
- 16. Competitive Analysis
- 16.1. Global Market Share Analysis 2024
- 16.2. Company Profiles
- 16.2.1 Infor Inc
- 16.2.1.1. Overview
- 16.2.1.2. Products
- 16.2.1.3. SWOT Analysis
- 16.2.1.4. Recent Developments
- 16.2.1.5. Financials (Based on Availability)
- 16.2.2 NextGen Healthcare Information Systems LLC
- 16.2.2.1. Overview
- 16.2.2.2. Products
- 16.2.2.3. SWOT Analysis
- 16.2.2.4. Recent Developments
- 16.2.2.5. Financials (Based on Availability)
- 16.2.3 Epic Corporation Inc
- 16.2.3.1. Overview
- 16.2.3.2. Products
- 16.2.3.3. SWOT Analysis
- 16.2.3.4. Recent Developments
- 16.2.3.5. Financials (Based on Availability)
- 16.2.4 Cerner Corporation
- 16.2.4.1. Overview
- 16.2.4.2. Products
- 16.2.4.3. SWOT Analysis
- 16.2.4.4. Recent Developments
- 16.2.4.5. Financials (Based on Availability)
- 16.2.5 Optum Inc
- 16.2.5.1. Overview
- 16.2.5.2. Products
- 16.2.5.3. SWOT Analysis
- 16.2.5.4. Recent Developments
- 16.2.5.5. Financials (Based on Availability)
- 16.2.6 Open Text Corporation
- 16.2.6.1. Overview
- 16.2.6.2. Products
- 16.2.6.3. SWOT Analysis
- 16.2.6.4. Recent Developments
- 16.2.6.5. Financials (Based on Availability)
- 16.2.7 Allscripts Healthcare Solutions Inc
- 16.2.7.1. Overview
- 16.2.7.2. Products
- 16.2.7.3. SWOT Analysis
- 16.2.7.4. Recent Developments
- 16.2.7.5. Financials (Based on Availability)
- 16.2.8 Conifer Health Solutions
- 16.2.8.1. Overview
- 16.2.8.2. Products
- 16.2.8.3. SWOT Analysis
- 16.2.8.4. Recent Developments
- 16.2.8.5. Financials (Based on Availability)
- 16.2.9 Medicity Inc
- 16.2.9.1. Overview
- 16.2.9.2. Products
- 16.2.9.3. SWOT Analysis
- 16.2.9.4. Recent Developments
- 16.2.9.5. Financials (Based on Availability)
- 16.2.10 Orion Health
- 16.2.10.1. Overview
- 16.2.10.2. Products
- 16.2.10.3. SWOT Analysis
- 16.2.10.4. Recent Developments
- 16.2.10.5. Financials (Based on Availability)
- 16.2.1 Infor Inc
List of Figures
- Figure 1: Global Health Information Exchange Industry Revenue Breakdown (Million, %) by Region 2024 & 2032
- Figure 2: Global Health Information Exchange Industry Volume Breakdown (K Unit, %) by Region 2024 & 2032
- Figure 3: North America Health Information Exchange Industry Revenue (Million), by Country 2024 & 2032
- Figure 4: North America Health Information Exchange Industry Volume (K Unit), by Country 2024 & 2032
- Figure 5: North America Health Information Exchange Industry Revenue Share (%), by Country 2024 & 2032
- Figure 6: North America Health Information Exchange Industry Volume Share (%), by Country 2024 & 2032
- Figure 7: Europe Health Information Exchange Industry Revenue (Million), by Country 2024 & 2032
- Figure 8: Europe Health Information Exchange Industry Volume (K Unit), by Country 2024 & 2032
- Figure 9: Europe Health Information Exchange Industry Revenue Share (%), by Country 2024 & 2032
- Figure 10: Europe Health Information Exchange Industry Volume Share (%), by Country 2024 & 2032
- Figure 11: Asia Pacific Health Information Exchange Industry Revenue (Million), by Country 2024 & 2032
- Figure 12: Asia Pacific Health Information Exchange Industry Volume (K Unit), by Country 2024 & 2032
- Figure 13: Asia Pacific Health Information Exchange Industry Revenue Share (%), by Country 2024 & 2032
- Figure 14: Asia Pacific Health Information Exchange Industry Volume Share (%), by Country 2024 & 2032
- Figure 15: Middle East and Africa Health Information Exchange Industry Revenue (Million), by Country 2024 & 2032
- Figure 16: Middle East and Africa Health Information Exchange Industry Volume (K Unit), by Country 2024 & 2032
- Figure 17: Middle East and Africa Health Information Exchange Industry Revenue Share (%), by Country 2024 & 2032
- Figure 18: Middle East and Africa Health Information Exchange Industry Volume Share (%), by Country 2024 & 2032
- Figure 19: South America Health Information Exchange Industry Revenue (Million), by Country 2024 & 2032
- Figure 20: South America Health Information Exchange Industry Volume (K Unit), by Country 2024 & 2032
- Figure 21: South America Health Information Exchange Industry Revenue Share (%), by Country 2024 & 2032
- Figure 22: South America Health Information Exchange Industry Volume Share (%), by Country 2024 & 2032
- Figure 23: North America Health Information Exchange Industry Revenue (Million), by Implementation Model 2024 & 2032
- Figure 24: North America Health Information Exchange Industry Volume (K Unit), by Implementation Model 2024 & 2032
- Figure 25: North America Health Information Exchange Industry Revenue Share (%), by Implementation Model 2024 & 2032
- Figure 26: North America Health Information Exchange Industry Volume Share (%), by Implementation Model 2024 & 2032
- Figure 27: North America Health Information Exchange Industry Revenue (Million), by Setup Type 2024 & 2032
- Figure 28: North America Health Information Exchange Industry Volume (K Unit), by Setup Type 2024 & 2032
- Figure 29: North America Health Information Exchange Industry Revenue Share (%), by Setup Type 2024 & 2032
- Figure 30: North America Health Information Exchange Industry Volume Share (%), by Setup Type 2024 & 2032
- Figure 31: North America Health Information Exchange Industry Revenue (Million), by Application 2024 & 2032
- Figure 32: North America Health Information Exchange Industry Volume (K Unit), by Application 2024 & 2032
- Figure 33: North America Health Information Exchange Industry Revenue Share (%), by Application 2024 & 2032
- Figure 34: North America Health Information Exchange Industry Volume Share (%), by Application 2024 & 2032
- Figure 35: North America Health Information Exchange Industry Revenue (Million), by Exchange Type 2024 & 2032
- Figure 36: North America Health Information Exchange Industry Volume (K Unit), by Exchange Type 2024 & 2032
- Figure 37: North America Health Information Exchange Industry Revenue Share (%), by Exchange Type 2024 & 2032
- Figure 38: North America Health Information Exchange Industry Volume Share (%), by Exchange Type 2024 & 2032
- Figure 39: North America Health Information Exchange Industry Revenue (Million), by Component 2024 & 2032
- Figure 40: North America Health Information Exchange Industry Volume (K Unit), by Component 2024 & 2032
- Figure 41: North America Health Information Exchange Industry Revenue Share (%), by Component 2024 & 2032
- Figure 42: North America Health Information Exchange Industry Volume Share (%), by Component 2024 & 2032
- Figure 43: North America Health Information Exchange Industry Revenue (Million), by End User 2024 & 2032
- Figure 44: North America Health Information Exchange Industry Volume (K Unit), by End User 2024 & 2032
- Figure 45: North America Health Information Exchange Industry Revenue Share (%), by End User 2024 & 2032
- Figure 46: North America Health Information Exchange Industry Volume Share (%), by End User 2024 & 2032
- Figure 47: North America Health Information Exchange Industry Revenue (Million), by Country 2024 & 2032
- Figure 48: North America Health Information Exchange Industry Volume (K Unit), by Country 2024 & 2032
- Figure 49: North America Health Information Exchange Industry Revenue Share (%), by Country 2024 & 2032
- Figure 50: North America Health Information Exchange Industry Volume Share (%), by Country 2024 & 2032
- Figure 51: Europe Health Information Exchange Industry Revenue (Million), by Implementation Model 2024 & 2032
- Figure 52: Europe Health Information Exchange Industry Volume (K Unit), by Implementation Model 2024 & 2032
- Figure 53: Europe Health Information Exchange Industry Revenue Share (%), by Implementation Model 2024 & 2032
- Figure 54: Europe Health Information Exchange Industry Volume Share (%), by Implementation Model 2024 & 2032
- Figure 55: Europe Health Information Exchange Industry Revenue (Million), by Setup Type 2024 & 2032
- Figure 56: Europe Health Information Exchange Industry Volume (K Unit), by Setup Type 2024 & 2032
- Figure 57: Europe Health Information Exchange Industry Revenue Share (%), by Setup Type 2024 & 2032
- Figure 58: Europe Health Information Exchange Industry Volume Share (%), by Setup Type 2024 & 2032
- Figure 59: Europe Health Information Exchange Industry Revenue (Million), by Application 2024 & 2032
- Figure 60: Europe Health Information Exchange Industry Volume (K Unit), by Application 2024 & 2032
- Figure 61: Europe Health Information Exchange Industry Revenue Share (%), by Application 2024 & 2032
- Figure 62: Europe Health Information Exchange Industry Volume Share (%), by Application 2024 & 2032
- Figure 63: Europe Health Information Exchange Industry Revenue (Million), by Exchange Type 2024 & 2032
- Figure 64: Europe Health Information Exchange Industry Volume (K Unit), by Exchange Type 2024 & 2032
- Figure 65: Europe Health Information Exchange Industry Revenue Share (%), by Exchange Type 2024 & 2032
- Figure 66: Europe Health Information Exchange Industry Volume Share (%), by Exchange Type 2024 & 2032
- Figure 67: Europe Health Information Exchange Industry Revenue (Million), by Component 2024 & 2032
- Figure 68: Europe Health Information Exchange Industry Volume (K Unit), by Component 2024 & 2032
- Figure 69: Europe Health Information Exchange Industry Revenue Share (%), by Component 2024 & 2032
- Figure 70: Europe Health Information Exchange Industry Volume Share (%), by Component 2024 & 2032
- Figure 71: Europe Health Information Exchange Industry Revenue (Million), by End User 2024 & 2032
- Figure 72: Europe Health Information Exchange Industry Volume (K Unit), by End User 2024 & 2032
- Figure 73: Europe Health Information Exchange Industry Revenue Share (%), by End User 2024 & 2032
- Figure 74: Europe Health Information Exchange Industry Volume Share (%), by End User 2024 & 2032
- Figure 75: Europe Health Information Exchange Industry Revenue (Million), by Country 2024 & 2032
- Figure 76: Europe Health Information Exchange Industry Volume (K Unit), by Country 2024 & 2032
- Figure 77: Europe Health Information Exchange Industry Revenue Share (%), by Country 2024 & 2032
- Figure 78: Europe Health Information Exchange Industry Volume Share (%), by Country 2024 & 2032
- Figure 79: Asia Pacific Health Information Exchange Industry Revenue (Million), by Implementation Model 2024 & 2032
- Figure 80: Asia Pacific Health Information Exchange Industry Volume (K Unit), by Implementation Model 2024 & 2032
- Figure 81: Asia Pacific Health Information Exchange Industry Revenue Share (%), by Implementation Model 2024 & 2032
- Figure 82: Asia Pacific Health Information Exchange Industry Volume Share (%), by Implementation Model 2024 & 2032
- Figure 83: Asia Pacific Health Information Exchange Industry Revenue (Million), by Setup Type 2024 & 2032
- Figure 84: Asia Pacific Health Information Exchange Industry Volume (K Unit), by Setup Type 2024 & 2032
- Figure 85: Asia Pacific Health Information Exchange Industry Revenue Share (%), by Setup Type 2024 & 2032
- Figure 86: Asia Pacific Health Information Exchange Industry Volume Share (%), by Setup Type 2024 & 2032
- Figure 87: Asia Pacific Health Information Exchange Industry Revenue (Million), by Application 2024 & 2032
- Figure 88: Asia Pacific Health Information Exchange Industry Volume (K Unit), by Application 2024 & 2032
- Figure 89: Asia Pacific Health Information Exchange Industry Revenue Share (%), by Application 2024 & 2032
- Figure 90: Asia Pacific Health Information Exchange Industry Volume Share (%), by Application 2024 & 2032
- Figure 91: Asia Pacific Health Information Exchange Industry Revenue (Million), by Exchange Type 2024 & 2032
- Figure 92: Asia Pacific Health Information Exchange Industry Volume (K Unit), by Exchange Type 2024 & 2032
- Figure 93: Asia Pacific Health Information Exchange Industry Revenue Share (%), by Exchange Type 2024 & 2032
- Figure 94: Asia Pacific Health Information Exchange Industry Volume Share (%), by Exchange Type 2024 & 2032
- Figure 95: Asia Pacific Health Information Exchange Industry Revenue (Million), by Component 2024 & 2032
- Figure 96: Asia Pacific Health Information Exchange Industry Volume (K Unit), by Component 2024 & 2032
- Figure 97: Asia Pacific Health Information Exchange Industry Revenue Share (%), by Component 2024 & 2032
- Figure 98: Asia Pacific Health Information Exchange Industry Volume Share (%), by Component 2024 & 2032
- Figure 99: Asia Pacific Health Information Exchange Industry Revenue (Million), by End User 2024 & 2032
- Figure 100: Asia Pacific Health Information Exchange Industry Volume (K Unit), by End User 2024 & 2032
- Figure 101: Asia Pacific Health Information Exchange Industry Revenue Share (%), by End User 2024 & 2032
- Figure 102: Asia Pacific Health Information Exchange Industry Volume Share (%), by End User 2024 & 2032
- Figure 103: Asia Pacific Health Information Exchange Industry Revenue (Million), by Country 2024 & 2032
- Figure 104: Asia Pacific Health Information Exchange Industry Volume (K Unit), by Country 2024 & 2032
- Figure 105: Asia Pacific Health Information Exchange Industry Revenue Share (%), by Country 2024 & 2032
- Figure 106: Asia Pacific Health Information Exchange Industry Volume Share (%), by Country 2024 & 2032
- Figure 107: Middle East and Africa Health Information Exchange Industry Revenue (Million), by Implementation Model 2024 & 2032
- Figure 108: Middle East and Africa Health Information Exchange Industry Volume (K Unit), by Implementation Model 2024 & 2032
- Figure 109: Middle East and Africa Health Information Exchange Industry Revenue Share (%), by Implementation Model 2024 & 2032
- Figure 110: Middle East and Africa Health Information Exchange Industry Volume Share (%), by Implementation Model 2024 & 2032
- Figure 111: Middle East and Africa Health Information Exchange Industry Revenue (Million), by Setup Type 2024 & 2032
- Figure 112: Middle East and Africa Health Information Exchange Industry Volume (K Unit), by Setup Type 2024 & 2032
- Figure 113: Middle East and Africa Health Information Exchange Industry Revenue Share (%), by Setup Type 2024 & 2032
- Figure 114: Middle East and Africa Health Information Exchange Industry Volume Share (%), by Setup Type 2024 & 2032
- Figure 115: Middle East and Africa Health Information Exchange Industry Revenue (Million), by Application 2024 & 2032
- Figure 116: Middle East and Africa Health Information Exchange Industry Volume (K Unit), by Application 2024 & 2032
- Figure 117: Middle East and Africa Health Information Exchange Industry Revenue Share (%), by Application 2024 & 2032
- Figure 118: Middle East and Africa Health Information Exchange Industry Volume Share (%), by Application 2024 & 2032
- Figure 119: Middle East and Africa Health Information Exchange Industry Revenue (Million), by Exchange Type 2024 & 2032
- Figure 120: Middle East and Africa Health Information Exchange Industry Volume (K Unit), by Exchange Type 2024 & 2032
- Figure 121: Middle East and Africa Health Information Exchange Industry Revenue Share (%), by Exchange Type 2024 & 2032
- Figure 122: Middle East and Africa Health Information Exchange Industry Volume Share (%), by Exchange Type 2024 & 2032
- Figure 123: Middle East and Africa Health Information Exchange Industry Revenue (Million), by Component 2024 & 2032
- Figure 124: Middle East and Africa Health Information Exchange Industry Volume (K Unit), by Component 2024 & 2032
- Figure 125: Middle East and Africa Health Information Exchange Industry Revenue Share (%), by Component 2024 & 2032
- Figure 126: Middle East and Africa Health Information Exchange Industry Volume Share (%), by Component 2024 & 2032
- Figure 127: Middle East and Africa Health Information Exchange Industry Revenue (Million), by End User 2024 & 2032
- Figure 128: Middle East and Africa Health Information Exchange Industry Volume (K Unit), by End User 2024 & 2032
- Figure 129: Middle East and Africa Health Information Exchange Industry Revenue Share (%), by End User 2024 & 2032
- Figure 130: Middle East and Africa Health Information Exchange Industry Volume Share (%), by End User 2024 & 2032
- Figure 131: Middle East and Africa Health Information Exchange Industry Revenue (Million), by Country 2024 & 2032
- Figure 132: Middle East and Africa Health Information Exchange Industry Volume (K Unit), by Country 2024 & 2032
- Figure 133: Middle East and Africa Health Information Exchange Industry Revenue Share (%), by Country 2024 & 2032
- Figure 134: Middle East and Africa Health Information Exchange Industry Volume Share (%), by Country 2024 & 2032
- Figure 135: South America Health Information Exchange Industry Revenue (Million), by Implementation Model 2024 & 2032
- Figure 136: South America Health Information Exchange Industry Volume (K Unit), by Implementation Model 2024 & 2032
- Figure 137: South America Health Information Exchange Industry Revenue Share (%), by Implementation Model 2024 & 2032
- Figure 138: South America Health Information Exchange Industry Volume Share (%), by Implementation Model 2024 & 2032
- Figure 139: South America Health Information Exchange Industry Revenue (Million), by Setup Type 2024 & 2032
- Figure 140: South America Health Information Exchange Industry Volume (K Unit), by Setup Type 2024 & 2032
- Figure 141: South America Health Information Exchange Industry Revenue Share (%), by Setup Type 2024 & 2032
- Figure 142: South America Health Information Exchange Industry Volume Share (%), by Setup Type 2024 & 2032
- Figure 143: South America Health Information Exchange Industry Revenue (Million), by Application 2024 & 2032
- Figure 144: South America Health Information Exchange Industry Volume (K Unit), by Application 2024 & 2032
- Figure 145: South America Health Information Exchange Industry Revenue Share (%), by Application 2024 & 2032
- Figure 146: South America Health Information Exchange Industry Volume Share (%), by Application 2024 & 2032
- Figure 147: South America Health Information Exchange Industry Revenue (Million), by Exchange Type 2024 & 2032
- Figure 148: South America Health Information Exchange Industry Volume (K Unit), by Exchange Type 2024 & 2032
- Figure 149: South America Health Information Exchange Industry Revenue Share (%), by Exchange Type 2024 & 2032
- Figure 150: South America Health Information Exchange Industry Volume Share (%), by Exchange Type 2024 & 2032
- Figure 151: South America Health Information Exchange Industry Revenue (Million), by Component 2024 & 2032
- Figure 152: South America Health Information Exchange Industry Volume (K Unit), by Component 2024 & 2032
- Figure 153: South America Health Information Exchange Industry Revenue Share (%), by Component 2024 & 2032
- Figure 154: South America Health Information Exchange Industry Volume Share (%), by Component 2024 & 2032
- Figure 155: South America Health Information Exchange Industry Revenue (Million), by End User 2024 & 2032
- Figure 156: South America Health Information Exchange Industry Volume (K Unit), by End User 2024 & 2032
- Figure 157: South America Health Information Exchange Industry Revenue Share (%), by End User 2024 & 2032
- Figure 158: South America Health Information Exchange Industry Volume Share (%), by End User 2024 & 2032
- Figure 159: South America Health Information Exchange Industry Revenue (Million), by Country 2024 & 2032
- Figure 160: South America Health Information Exchange Industry Volume (K Unit), by Country 2024 & 2032
- Figure 161: South America Health Information Exchange Industry Revenue Share (%), by Country 2024 & 2032
- Figure 162: South America Health Information Exchange Industry Volume Share (%), by Country 2024 & 2032
List of Tables
- Table 1: Global Health Information Exchange Industry Revenue Million Forecast, by Region 2019 & 2032
- Table 2: Global Health Information Exchange Industry Volume K Unit Forecast, by Region 2019 & 2032
- Table 3: Global Health Information Exchange Industry Revenue Million Forecast, by Implementation Model 2019 & 2032
- Table 4: Global Health Information Exchange Industry Volume K Unit Forecast, by Implementation Model 2019 & 2032
- Table 5: Global Health Information Exchange Industry Revenue Million Forecast, by Setup Type 2019 & 2032
- Table 6: Global Health Information Exchange Industry Volume K Unit Forecast, by Setup Type 2019 & 2032
- Table 7: Global Health Information Exchange Industry Revenue Million Forecast, by Application 2019 & 2032
- Table 8: Global Health Information Exchange Industry Volume K Unit Forecast, by Application 2019 & 2032
- Table 9: Global Health Information Exchange Industry Revenue Million Forecast, by Exchange Type 2019 & 2032
- Table 10: Global Health Information Exchange Industry Volume K Unit Forecast, by Exchange Type 2019 & 2032
- Table 11: Global Health Information Exchange Industry Revenue Million Forecast, by Component 2019 & 2032
- Table 12: Global Health Information Exchange Industry Volume K Unit Forecast, by Component 2019 & 2032
- Table 13: Global Health Information Exchange Industry Revenue Million Forecast, by End User 2019 & 2032
- Table 14: Global Health Information Exchange Industry Volume K Unit Forecast, by End User 2019 & 2032
- Table 15: Global Health Information Exchange Industry Revenue Million Forecast, by Region 2019 & 2032
- Table 16: Global Health Information Exchange Industry Volume K Unit Forecast, by Region 2019 & 2032
- Table 17: Global Health Information Exchange Industry Revenue Million Forecast, by Country 2019 & 2032
- Table 18: Global Health Information Exchange Industry Volume K Unit Forecast, by Country 2019 & 2032
- Table 19: United States Health Information Exchange Industry Revenue (Million) Forecast, by Application 2019 & 2032
- Table 20: United States Health Information Exchange Industry Volume (K Unit) Forecast, by Application 2019 & 2032
- Table 21: Canada Health Information Exchange Industry Revenue (Million) Forecast, by Application 2019 & 2032
- Table 22: Canada Health Information Exchange Industry Volume (K Unit) Forecast, by Application 2019 & 2032
- Table 23: Mexico Health Information Exchange Industry Revenue (Million) Forecast, by Application 2019 & 2032
- Table 24: Mexico Health Information Exchange Industry Volume (K Unit) Forecast, by Application 2019 & 2032
- Table 25: Global Health Information Exchange Industry Revenue Million Forecast, by Country 2019 & 2032
- Table 26: Global Health Information Exchange Industry Volume K Unit Forecast, by Country 2019 & 2032
- Table 27: Germany Health Information Exchange Industry Revenue (Million) Forecast, by Application 2019 & 2032
- Table 28: Germany Health Information Exchange Industry Volume (K Unit) Forecast, by Application 2019 & 2032
- Table 29: United Kingdom Health Information Exchange Industry Revenue (Million) Forecast, by Application 2019 & 2032
- Table 30: United Kingdom Health Information Exchange Industry Volume (K Unit) Forecast, by Application 2019 & 2032
- Table 31: France Health Information Exchange Industry Revenue (Million) Forecast, by Application 2019 & 2032
- Table 32: France Health Information Exchange Industry Volume (K Unit) Forecast, by Application 2019 & 2032
- Table 33: Italy Health Information Exchange Industry Revenue (Million) Forecast, by Application 2019 & 2032
- Table 34: Italy Health Information Exchange Industry Volume (K Unit) Forecast, by Application 2019 & 2032
- Table 35: Spain Health Information Exchange Industry Revenue (Million) Forecast, by Application 2019 & 2032
- Table 36: Spain Health Information Exchange Industry Volume (K Unit) Forecast, by Application 2019 & 2032
- Table 37: Rest of Europe Health Information Exchange Industry Revenue (Million) Forecast, by Application 2019 & 2032
- Table 38: Rest of Europe Health Information Exchange Industry Volume (K Unit) Forecast, by Application 2019 & 2032
- Table 39: Global Health Information Exchange Industry Revenue Million Forecast, by Country 2019 & 2032
- Table 40: Global Health Information Exchange Industry Volume K Unit Forecast, by Country 2019 & 2032
- Table 41: China Health Information Exchange Industry Revenue (Million) Forecast, by Application 2019 & 2032
- Table 42: China Health Information Exchange Industry Volume (K Unit) Forecast, by Application 2019 & 2032
- Table 43: Japan Health Information Exchange Industry Revenue (Million) Forecast, by Application 2019 & 2032
- Table 44: Japan Health Information Exchange Industry Volume (K Unit) Forecast, by Application 2019 & 2032
- Table 45: India Health Information Exchange Industry Revenue (Million) Forecast, by Application 2019 & 2032
- Table 46: India Health Information Exchange Industry Volume (K Unit) Forecast, by Application 2019 & 2032
- Table 47: Australia Health Information Exchange Industry Revenue (Million) Forecast, by Application 2019 & 2032
- Table 48: Australia Health Information Exchange Industry Volume (K Unit) Forecast, by Application 2019 & 2032
- Table 49: South Korea Health Information Exchange Industry Revenue (Million) Forecast, by Application 2019 & 2032
- Table 50: South Korea Health Information Exchange Industry Volume (K Unit) Forecast, by Application 2019 & 2032
- Table 51: Rest of Asia Pacific Health Information Exchange Industry Revenue (Million) Forecast, by Application 2019 & 2032
- Table 52: Rest of Asia Pacific Health Information Exchange Industry Volume (K Unit) Forecast, by Application 2019 & 2032
- Table 53: Global Health Information Exchange Industry Revenue Million Forecast, by Country 2019 & 2032
- Table 54: Global Health Information Exchange Industry Volume K Unit Forecast, by Country 2019 & 2032
- Table 55: GCC Health Information Exchange Industry Revenue (Million) Forecast, by Application 2019 & 2032
- Table 56: GCC Health Information Exchange Industry Volume (K Unit) Forecast, by Application 2019 & 2032
- Table 57: South Africa Health Information Exchange Industry Revenue (Million) Forecast, by Application 2019 & 2032
- Table 58: South Africa Health Information Exchange Industry Volume (K Unit) Forecast, by Application 2019 & 2032
- Table 59: Rest of Middle East and Africa Health Information Exchange Industry Revenue (Million) Forecast, by Application 2019 & 2032
- Table 60: Rest of Middle East and Africa Health Information Exchange Industry Volume (K Unit) Forecast, by Application 2019 & 2032
- Table 61: Global Health Information Exchange Industry Revenue Million Forecast, by Country 2019 & 2032
- Table 62: Global Health Information Exchange Industry Volume K Unit Forecast, by Country 2019 & 2032
- Table 63: Brazil Health Information Exchange Industry Revenue (Million) Forecast, by Application 2019 & 2032
- Table 64: Brazil Health Information Exchange Industry Volume (K Unit) Forecast, by Application 2019 & 2032
- Table 65: Argentina Health Information Exchange Industry Revenue (Million) Forecast, by Application 2019 & 2032
- Table 66: Argentina Health Information Exchange Industry Volume (K Unit) Forecast, by Application 2019 & 2032
- Table 67: Rest of South America Health Information Exchange Industry Revenue (Million) Forecast, by Application 2019 & 2032
- Table 68: Rest of South America Health Information Exchange Industry Volume (K Unit) Forecast, by Application 2019 & 2032
- Table 69: Global Health Information Exchange Industry Revenue Million Forecast, by Implementation Model 2019 & 2032
- Table 70: Global Health Information Exchange Industry Volume K Unit Forecast, by Implementation Model 2019 & 2032
- Table 71: Global Health Information Exchange Industry Revenue Million Forecast, by Setup Type 2019 & 2032
- Table 72: Global Health Information Exchange Industry Volume K Unit Forecast, by Setup Type 2019 & 2032
- Table 73: Global Health Information Exchange Industry Revenue Million Forecast, by Application 2019 & 2032
- Table 74: Global Health Information Exchange Industry Volume K Unit Forecast, by Application 2019 & 2032
- Table 75: Global Health Information Exchange Industry Revenue Million Forecast, by Exchange Type 2019 & 2032
- Table 76: Global Health Information Exchange Industry Volume K Unit Forecast, by Exchange Type 2019 & 2032
- Table 77: Global Health Information Exchange Industry Revenue Million Forecast, by Component 2019 & 2032
- Table 78: Global Health Information Exchange Industry Volume K Unit Forecast, by Component 2019 & 2032
- Table 79: Global Health Information Exchange Industry Revenue Million Forecast, by End User 2019 & 2032
- Table 80: Global Health Information Exchange Industry Volume K Unit Forecast, by End User 2019 & 2032
- Table 81: Global Health Information Exchange Industry Revenue Million Forecast, by Country 2019 & 2032
- Table 82: Global Health Information Exchange Industry Volume K Unit Forecast, by Country 2019 & 2032
- Table 83: United States Health Information Exchange Industry Revenue (Million) Forecast, by Application 2019 & 2032
- Table 84: United States Health Information Exchange Industry Volume (K Unit) Forecast, by Application 2019 & 2032
- Table 85: Canada Health Information Exchange Industry Revenue (Million) Forecast, by Application 2019 & 2032
- Table 86: Canada Health Information Exchange Industry Volume (K Unit) Forecast, by Application 2019 & 2032
- Table 87: Mexico Health Information Exchange Industry Revenue (Million) Forecast, by Application 2019 & 2032
- Table 88: Mexico Health Information Exchange Industry Volume (K Unit) Forecast, by Application 2019 & 2032
- Table 89: Global Health Information Exchange Industry Revenue Million Forecast, by Implementation Model 2019 & 2032
- Table 90: Global Health Information Exchange Industry Volume K Unit Forecast, by Implementation Model 2019 & 2032
- Table 91: Global Health Information Exchange Industry Revenue Million Forecast, by Setup Type 2019 & 2032
- Table 92: Global Health Information Exchange Industry Volume K Unit Forecast, by Setup Type 2019 & 2032
- Table 93: Global Health Information Exchange Industry Revenue Million Forecast, by Application 2019 & 2032
- Table 94: Global Health Information Exchange Industry Volume K Unit Forecast, by Application 2019 & 2032
- Table 95: Global Health Information Exchange Industry Revenue Million Forecast, by Exchange Type 2019 & 2032
- Table 96: Global Health Information Exchange Industry Volume K Unit Forecast, by Exchange Type 2019 & 2032
- Table 97: Global Health Information Exchange Industry Revenue Million Forecast, by Component 2019 & 2032
- Table 98: Global Health Information Exchange Industry Volume K Unit Forecast, by Component 2019 & 2032
- Table 99: Global Health Information Exchange Industry Revenue Million Forecast, by End User 2019 & 2032
- Table 100: Global Health Information Exchange Industry Volume K Unit Forecast, by End User 2019 & 2032
- Table 101: Global Health Information Exchange Industry Revenue Million Forecast, by Country 2019 & 2032
- Table 102: Global Health Information Exchange Industry Volume K Unit Forecast, by Country 2019 & 2032
- Table 103: Germany Health Information Exchange Industry Revenue (Million) Forecast, by Application 2019 & 2032
- Table 104: Germany Health Information Exchange Industry Volume (K Unit) Forecast, by Application 2019 & 2032
- Table 105: United Kingdom Health Information Exchange Industry Revenue (Million) Forecast, by Application 2019 & 2032
- Table 106: United Kingdom Health Information Exchange Industry Volume (K Unit) Forecast, by Application 2019 & 2032
- Table 107: France Health Information Exchange Industry Revenue (Million) Forecast, by Application 2019 & 2032
- Table 108: France Health Information Exchange Industry Volume (K Unit) Forecast, by Application 2019 & 2032
- Table 109: Italy Health Information Exchange Industry Revenue (Million) Forecast, by Application 2019 & 2032
- Table 110: Italy Health Information Exchange Industry Volume (K Unit) Forecast, by Application 2019 & 2032
- Table 111: Spain Health Information Exchange Industry Revenue (Million) Forecast, by Application 2019 & 2032
- Table 112: Spain Health Information Exchange Industry Volume (K Unit) Forecast, by Application 2019 & 2032
- Table 113: Rest of Europe Health Information Exchange Industry Revenue (Million) Forecast, by Application 2019 & 2032
- Table 114: Rest of Europe Health Information Exchange Industry Volume (K Unit) Forecast, by Application 2019 & 2032
- Table 115: Global Health Information Exchange Industry Revenue Million Forecast, by Implementation Model 2019 & 2032
- Table 116: Global Health Information Exchange Industry Volume K Unit Forecast, by Implementation Model 2019 & 2032
- Table 117: Global Health Information Exchange Industry Revenue Million Forecast, by Setup Type 2019 & 2032
- Table 118: Global Health Information Exchange Industry Volume K Unit Forecast, by Setup Type 2019 & 2032
- Table 119: Global Health Information Exchange Industry Revenue Million Forecast, by Application 2019 & 2032
- Table 120: Global Health Information Exchange Industry Volume K Unit Forecast, by Application 2019 & 2032
- Table 121: Global Health Information Exchange Industry Revenue Million Forecast, by Exchange Type 2019 & 2032
- Table 122: Global Health Information Exchange Industry Volume K Unit Forecast, by Exchange Type 2019 & 2032
- Table 123: Global Health Information Exchange Industry Revenue Million Forecast, by Component 2019 & 2032
- Table 124: Global Health Information Exchange Industry Volume K Unit Forecast, by Component 2019 & 2032
- Table 125: Global Health Information Exchange Industry Revenue Million Forecast, by End User 2019 & 2032
- Table 126: Global Health Information Exchange Industry Volume K Unit Forecast, by End User 2019 & 2032
- Table 127: Global Health Information Exchange Industry Revenue Million Forecast, by Country 2019 & 2032
- Table 128: Global Health Information Exchange Industry Volume K Unit Forecast, by Country 2019 & 2032
- Table 129: China Health Information Exchange Industry Revenue (Million) Forecast, by Application 2019 & 2032
- Table 130: China Health Information Exchange Industry Volume (K Unit) Forecast, by Application 2019 & 2032
- Table 131: Japan Health Information Exchange Industry Revenue (Million) Forecast, by Application 2019 & 2032
- Table 132: Japan Health Information Exchange Industry Volume (K Unit) Forecast, by Application 2019 & 2032
- Table 133: India Health Information Exchange Industry Revenue (Million) Forecast, by Application 2019 & 2032
- Table 134: India Health Information Exchange Industry Volume (K Unit) Forecast, by Application 2019 & 2032
- Table 135: Australia Health Information Exchange Industry Revenue (Million) Forecast, by Application 2019 & 2032
- Table 136: Australia Health Information Exchange Industry Volume (K Unit) Forecast, by Application 2019 & 2032
- Table 137: South Korea Health Information Exchange Industry Revenue (Million) Forecast, by Application 2019 & 2032
- Table 138: South Korea Health Information Exchange Industry Volume (K Unit) Forecast, by Application 2019 & 2032
- Table 139: Rest of Asia Pacific Health Information Exchange Industry Revenue (Million) Forecast, by Application 2019 & 2032
- Table 140: Rest of Asia Pacific Health Information Exchange Industry Volume (K Unit) Forecast, by Application 2019 & 2032
- Table 141: Global Health Information Exchange Industry Revenue Million Forecast, by Implementation Model 2019 & 2032
- Table 142: Global Health Information Exchange Industry Volume K Unit Forecast, by Implementation Model 2019 & 2032
- Table 143: Global Health Information Exchange Industry Revenue Million Forecast, by Setup Type 2019 & 2032
- Table 144: Global Health Information Exchange Industry Volume K Unit Forecast, by Setup Type 2019 & 2032
- Table 145: Global Health Information Exchange Industry Revenue Million Forecast, by Application 2019 & 2032
- Table 146: Global Health Information Exchange Industry Volume K Unit Forecast, by Application 2019 & 2032
- Table 147: Global Health Information Exchange Industry Revenue Million Forecast, by Exchange Type 2019 & 2032
- Table 148: Global Health Information Exchange Industry Volume K Unit Forecast, by Exchange Type 2019 & 2032
- Table 149: Global Health Information Exchange Industry Revenue Million Forecast, by Component 2019 & 2032
- Table 150: Global Health Information Exchange Industry Volume K Unit Forecast, by Component 2019 & 2032
- Table 151: Global Health Information Exchange Industry Revenue Million Forecast, by End User 2019 & 2032
- Table 152: Global Health Information Exchange Industry Volume K Unit Forecast, by End User 2019 & 2032
- Table 153: Global Health Information Exchange Industry Revenue Million Forecast, by Country 2019 & 2032
- Table 154: Global Health Information Exchange Industry Volume K Unit Forecast, by Country 2019 & 2032
- Table 155: GCC Health Information Exchange Industry Revenue (Million) Forecast, by Application 2019 & 2032
- Table 156: GCC Health Information Exchange Industry Volume (K Unit) Forecast, by Application 2019 & 2032
- Table 157: South Africa Health Information Exchange Industry Revenue (Million) Forecast, by Application 2019 & 2032
- Table 158: South Africa Health Information Exchange Industry Volume (K Unit) Forecast, by Application 2019 & 2032
- Table 159: Rest of Middle East and Africa Health Information Exchange Industry Revenue (Million) Forecast, by Application 2019 & 2032
- Table 160: Rest of Middle East and Africa Health Information Exchange Industry Volume (K Unit) Forecast, by Application 2019 & 2032
- Table 161: Global Health Information Exchange Industry Revenue Million Forecast, by Implementation Model 2019 & 2032
- Table 162: Global Health Information Exchange Industry Volume K Unit Forecast, by Implementation Model 2019 & 2032
- Table 163: Global Health Information Exchange Industry Revenue Million Forecast, by Setup Type 2019 & 2032
- Table 164: Global Health Information Exchange Industry Volume K Unit Forecast, by Setup Type 2019 & 2032
- Table 165: Global Health Information Exchange Industry Revenue Million Forecast, by Application 2019 & 2032
- Table 166: Global Health Information Exchange Industry Volume K Unit Forecast, by Application 2019 & 2032
- Table 167: Global Health Information Exchange Industry Revenue Million Forecast, by Exchange Type 2019 & 2032
- Table 168: Global Health Information Exchange Industry Volume K Unit Forecast, by Exchange Type 2019 & 2032
- Table 169: Global Health Information Exchange Industry Revenue Million Forecast, by Component 2019 & 2032
- Table 170: Global Health Information Exchange Industry Volume K Unit Forecast, by Component 2019 & 2032
- Table 171: Global Health Information Exchange Industry Revenue Million Forecast, by End User 2019 & 2032
- Table 172: Global Health Information Exchange Industry Volume K Unit Forecast, by End User 2019 & 2032
- Table 173: Global Health Information Exchange Industry Revenue Million Forecast, by Country 2019 & 2032
- Table 174: Global Health Information Exchange Industry Volume K Unit Forecast, by Country 2019 & 2032
- Table 175: Brazil Health Information Exchange Industry Revenue (Million) Forecast, by Application 2019 & 2032
- Table 176: Brazil Health Information Exchange Industry Volume (K Unit) Forecast, by Application 2019 & 2032
- Table 177: Argentina Health Information Exchange Industry Revenue (Million) Forecast, by Application 2019 & 2032
- Table 178: Argentina Health Information Exchange Industry Volume (K Unit) Forecast, by Application 2019 & 2032
- Table 179: Rest of South America Health Information Exchange Industry Revenue (Million) Forecast, by Application 2019 & 2032
- Table 180: Rest of South America Health Information Exchange Industry Volume (K Unit) Forecast, by Application 2019 & 2032
Frequently Asked Questions
1. What is the projected Compound Annual Growth Rate (CAGR) of the Health Information Exchange Industry?
The projected CAGR is approximately 11.80%.
2. Which companies are prominent players in the Health Information Exchange Industry?
Key companies in the market include Infor Inc, NextGen Healthcare Information Systems LLC, Epic Corporation Inc, Cerner Corporation, Optum Inc, Open Text Corporation, Allscripts Healthcare Solutions Inc, Conifer Health Solutions, Medicity Inc, Orion Health.
3. What are the main segments of the Health Information Exchange Industry?
The market segments include Implementation Model, Setup Type, Application, Exchange Type, Component, End User.
4. Can you provide details about the market size?
The market size is estimated to be USD 1.97 Million as of 2022.
5. What are some drivers contributing to market growth?
; Growing Demand for Healthcare Data Exchange; Government Support in Creating Infrastructure for Data Exchange.
6. What are the notable trends driving market growth?
Hybrid Model Segment is Expected to Have Significant Share.
7. Are there any restraints impacting market growth?
; Huge Initial Infrastructural Investment; Data Privacy and Security Concerns.
8. Can you provide examples of recent developments in the market?
N/A
9. What pricing options are available for accessing the report?
Pricing options include single-user, multi-user, and enterprise licenses priced at USD 4750, USD 5250, and USD 8750 respectively.
10. Is the market size provided in terms of value or volume?
The market size is provided in terms of value, measured in Million and volume, measured in K Unit.
11. Are there any specific market keywords associated with the report?
Yes, the market keyword associated with the report is "Health Information Exchange Industry," which aids in identifying and referencing the specific market segment covered.
12. How do I determine which pricing option suits my needs best?
The pricing options vary based on user requirements and access needs. Individual users may opt for single-user licenses, while businesses requiring broader access may choose multi-user or enterprise licenses for cost-effective access to the report.
13. Are there any additional resources or data provided in the Health Information Exchange Industry report?
While the report offers comprehensive insights, it's advisable to review the specific contents or supplementary materials provided to ascertain if additional resources or data are available.
14. How can I stay updated on further developments or reports in the Health Information Exchange Industry?
To stay informed about further developments, trends, and reports in the Health Information Exchange Industry, consider subscribing to industry newsletters, following relevant companies and organizations, or regularly checking reputable industry news sources and publications.
Methodology
Step 1 - Identification of Relevant Samples Size from Population Database


Step 2 - Approaches for Defining Global Market Size (Value, Volume* & Price*)

Note*: In applicable scenarios
Step 3 - Data Sources
Primary Research
- Web Analytics
- Survey Reports
- Research Institute
- Latest Research Reports
- Opinion Leaders
Secondary Research
- Annual Reports
- White Paper
- Latest Press Release
- Industry Association
- Paid Database
- Investor Presentations

Step 4 - Data Triangulation
Involves using different sources of information in order to increase the validity of a study
These sources are likely to be stakeholders in a program - participants, other researchers, program staff, other community members, and so on.
Then we put all data in single framework & apply various statistical tools to find out the dynamic on the market.
During the analysis stage, feedback from the stakeholder groups would be compared to determine areas of agreement as well as areas of divergence
