

Key Insights
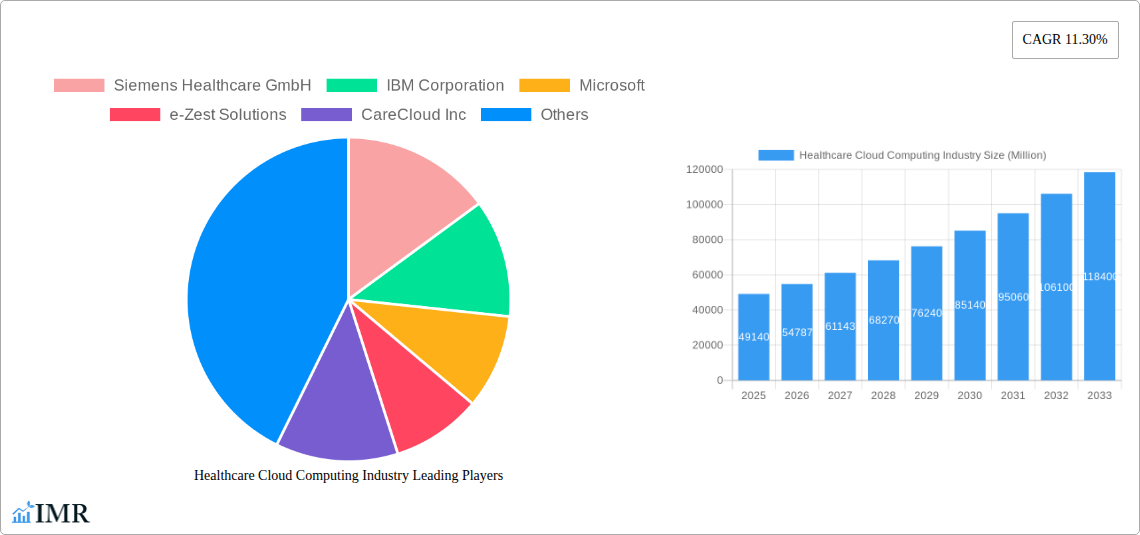
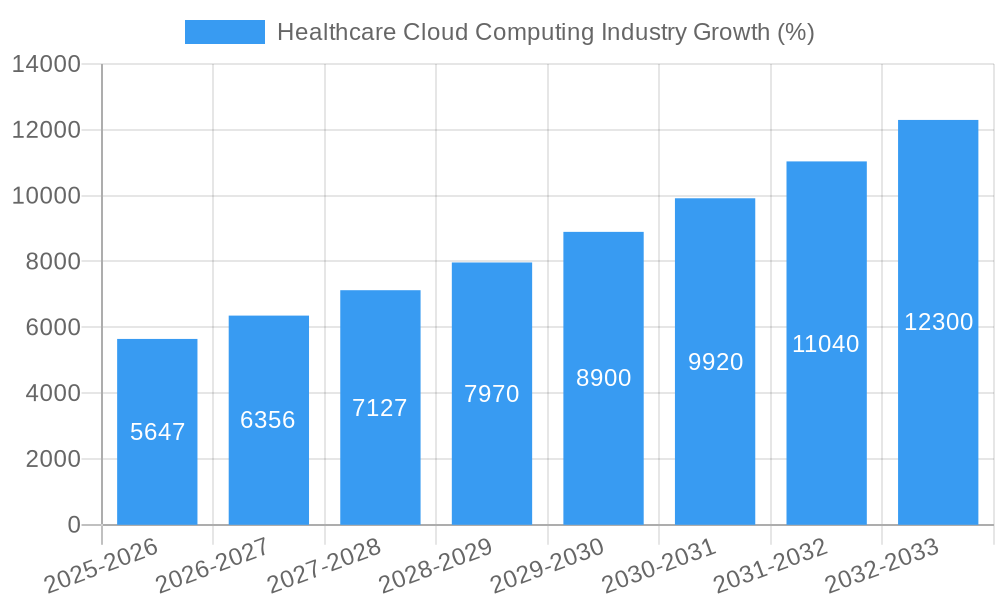
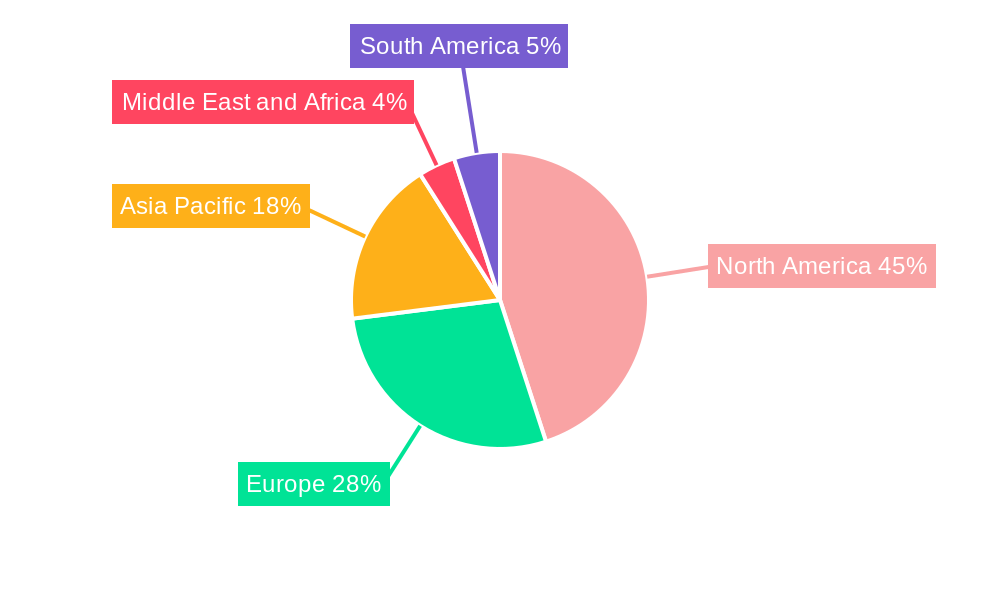
The global healthcare cloud computing market, valued at $49.14 billion in 2025, is poised for robust growth, exhibiting a Compound Annual Growth Rate (CAGR) of 11.30% from 2025 to 2033. This expansion is driven by several key factors. The increasing adoption of electronic health records (EHRs) and the need for improved interoperability among healthcare systems are significant catalysts. Furthermore, the rising demand for remote patient monitoring, telehealth services, and big data analytics within the healthcare sector fuels the demand for scalable and secure cloud solutions. Data security and privacy concerns remain a key challenge, but advancements in encryption technologies and robust compliance frameworks are mitigating these risks. The market is segmented by application (Clinical Information Systems (CIS) and Non-clinical Information Systems (NCIS)), deployment (Private and Public Cloud), service (SaaS, IaaS, and PaaS), and end-user (Healthcare Providers and Payers). North America currently holds a significant market share, attributed to advanced healthcare infrastructure and early adoption of cloud technologies. However, Asia Pacific is projected to witness the fastest growth, fueled by rising healthcare expenditure and increasing digitalization initiatives. The competitive landscape comprises major technology players like Microsoft, IBM, and Amazon, alongside specialized healthcare IT companies, indicating a dynamic and evolving market.
The diverse applications of cloud computing within healthcare are transforming operational efficiency and patient care. For instance, cloud-based CIS streamlines administrative tasks, improves data management, and enhances care coordination. NCIS applications optimize billing, claims processing, and other operational aspects. The shift towards SaaS models simplifies deployment and reduces upfront costs for healthcare organizations, leading to wider adoption. The increasing integration of AI and machine learning within cloud platforms enables advanced analytics for disease prediction, personalized medicine, and improved treatment outcomes. Continued innovation in cloud security, regulatory compliance, and interoperability standards will further drive market growth throughout the forecast period. The market's trajectory reflects a compelling convergence of technological advancements and the evolving needs of the healthcare industry.
Healthcare Cloud Computing Industry Market Report: 2019-2033
This comprehensive report provides an in-depth analysis of the Healthcare Cloud Computing industry, encompassing market dynamics, growth trends, competitive landscape, and future outlook. With a focus on key segments – including Clinical Information Systems (CIS), Non-clinical Information Systems (NCIS), Private Cloud, Public Cloud, SaaS, IaaS, PaaS, Healthcare Providers, and Healthcare Payers – this report offers invaluable insights for industry professionals, investors, and strategic decision-makers. The study period covers 2019-2033, with a base year of 2025 and a forecast period of 2025-2033.
Healthcare Cloud Computing Industry Market Dynamics & Structure
The healthcare cloud computing market is experiencing significant growth driven by technological advancements, increasing data volumes, and the need for improved efficiency and cost-effectiveness in healthcare delivery. Market concentration is moderate, with a few major players holding significant market share, while numerous smaller companies compete in niche segments. Technological innovation, particularly in areas like AI and machine learning, is a key driver, enhancing data analytics and personalized medicine. However, stringent regulatory frameworks, including HIPAA and GDPR, pose significant challenges. The market also faces pressure from competitive product substitutes, such as on-premise solutions. Mergers and acquisitions (M&A) are common, with an estimated xx million deals in the past five years, reflecting the ongoing consolidation within the industry.
- Market Concentration: Moderate, with top 5 players holding approximately xx% market share (2024).
- Technological Innovation: AI, machine learning, blockchain driving data analytics and security advancements.
- Regulatory Frameworks: HIPAA, GDPR, and other regional regulations influencing cloud adoption strategies.
- Competitive Substitutes: On-premise solutions and legacy systems present competition.
- End-User Demographics: Shift towards digitally-savvy healthcare providers and payers fuels demand.
- M&A Trends: xx million deals in 2019-2024, indicating consolidation and strategic expansion.
Healthcare Cloud Computing Industry Growth Trends & Insights
The healthcare cloud computing market is exhibiting robust growth, with a projected CAGR of xx% during the forecast period (2025-2033). Market size is expected to reach xx million by 2033, up from xx million in 2024. This growth is fuelled by increasing adoption rates among healthcare providers and payers, driven by the need to improve operational efficiency, enhance data security, and enable telehealth services. Technological disruptions, such as the rise of edge computing and serverless architectures, are reshaping the industry landscape. Consumer behavior is also shifting, with increased demand for personalized and accessible healthcare services.
(Note: This section requires XXX data points for a full 600-word analysis. The above provides a framework.)
Dominant Regions, Countries, or Segments in Healthcare Cloud Computing Industry
North America currently dominates the healthcare cloud computing market, accounting for xx% of the global market share in 2024, followed by Europe at xx%. This dominance is attributed to factors such as high technological advancement, robust healthcare infrastructure, and early adoption of cloud technologies. Within segments, SaaS is the leading service model, followed by IaaS and PaaS. Clinical Information Systems (CIS) represents a larger segment compared to Non-clinical Information Systems (NCIS). Healthcare providers are the dominant end-users, followed by healthcare payers.
- Key Drivers (North America): Advanced healthcare infrastructure, high technology adoption, favorable regulatory environment.
- Key Drivers (Europe): Increasing government initiatives supporting digital healthcare transformation, growing demand for telehealth.
- Segment Dominance: SaaS (xx% market share), CIS (xx% market share), Healthcare Providers (xx% market share).
(Note: This section requires additional data to reach 600 words. The above structure provides a framework. Include further details on regional specifics.)
Healthcare Cloud Computing Industry Product Landscape
The healthcare cloud computing market offers a diverse range of products, including cloud-based Electronic Health Records (EHRs), medical image storage and management systems, telehealth platforms, and patient engagement tools. These products incorporate advanced features such as AI-powered diagnostics, predictive analytics, and robust security protocols. Key innovations include the development of interoperable systems and seamless integration with existing healthcare IT infrastructure. The focus is on improving data accessibility, enhancing clinical decision-making, and improving patient outcomes.
Key Drivers, Barriers & Challenges in Healthcare Cloud Computing Industry
Key Drivers:
- Increasing demand for efficient healthcare delivery.
- Rise of telehealth and remote patient monitoring.
- Need for improved data security and interoperability.
- Growing adoption of AI and machine learning in healthcare.
Key Challenges:
- Stringent regulatory compliance (HIPAA, GDPR).
- Data security and privacy concerns.
- Interoperability challenges among different systems.
- High initial investment costs for cloud adoption.
- Estimated xx million in lost revenue due to security breaches in 2024.
Emerging Opportunities in Healthcare Cloud Computing Industry
- Expansion into emerging markets with growing healthcare infrastructure investment.
- Development of specialized cloud solutions for niche medical segments (e.g., genomics).
- Integration of blockchain technology for secure data sharing and management.
- Growing demand for AI-powered diagnostic tools and personalized medicine applications.
Growth Accelerators in the Healthcare Cloud Computing Industry Industry
Technological advancements, particularly in AI, machine learning, and edge computing, are accelerating growth. Strategic partnerships between technology providers and healthcare organizations are fostering innovation and wider adoption. Expanding into untapped markets, particularly in developing economies with increasing healthcare expenditure, presents significant opportunities.
Key Players Shaping the Healthcare Cloud Computing Industry Market
- Siemens Healthcare GmbH
- IBM Corporation
- Microsoft
- e-Zest Solutions
- CareCloud Inc
- Iron Mountain Incorporated
- Dell Inc
- Koninklijke Philips NV
- Amazon com Inc
- ClearDATA
- Euris
- Oracle
- OSP Labs
- ZYMR Inc
- Athenahealth Inc
Notable Milestones in Healthcare Cloud Computing Industry Sector
- November 2022: Wipro Ltd partners with VMware to offer cross-cloud services to healthcare and other sectors, training 5,000 professionals.
- June 2022: Saudi Arabia's Ministry of Health deploys VMware's multi-cloud solutions to digitally transform the public healthcare sector.
In-Depth Healthcare Cloud Computing Industry Market Outlook
The healthcare cloud computing market is poised for continued strong growth, driven by technological advancements, increasing data volumes, and a rising focus on data-driven healthcare. Strategic partnerships, coupled with expansion into new markets and the development of innovative applications, will further fuel this growth. The market's future potential is significant, presenting substantial opportunities for both established players and emerging companies.
Healthcare Cloud Computing Industry Segmentation
-
1. Application
-
1.1. Clinical Information Systems (CIS)
- 1.1.1. Electronic Health Record (EHR)
- 1.1.2. Picture Archiving and Communication System (PACS)
- 1.1.3. Radiology Information Systems (RIS)
- 1.1.4. Computerized Physician Order Entry (CPOE)
- 1.1.5. Other Applications
-
1.2. Non-clinical Information Systems (NCIS)
- 1.2.1. Revenue Cycle Management (RCM)
- 1.2.2. Automatic Patient Billing (APB)
- 1.2.3. Payroll Management System
- 1.2.4. Other Non-clinical Information Systems
-
1.1. Clinical Information Systems (CIS)
-
2. Deployment
- 2.1. Private Cloud
- 2.2. Public Cloud
-
3. Service
- 3.1. Software-as-a-Service (SaaS)
- 3.2. Infrastructure-as-a-Service (IaaS)
- 3.3. Platform-as-a-Service (PaaS)
-
4. End User
- 4.1. Healthcare Providers
- 4.2. Healthcare Payers
Healthcare Cloud Computing Industry Segmentation By Geography
-
1. North America
- 1.1. United States
- 1.2. Canada
- 1.3. Mexico
-
2. Europe
- 2.1. Germany
- 2.2. United Kingdom
- 2.3. France
- 2.4. Italy
- 2.5. Spain
- 2.6. Rest of Europe
-
3. Asia Pacific
- 3.1. China
- 3.2. Japan
- 3.3. India
- 3.4. Australia
- 3.5. South Korea
- 3.6. Rest of Asia Pacific
-
4. Middle East and Africa
- 4.1. GCC
- 4.2. South Africa
- 4.3. Rest of Middle East and Africa
-
5. South America
- 5.1. Brazil
- 5.2. Argentina
- 5.3. Rest of South America
Healthcare Cloud Computing Industry REPORT HIGHLIGHTS
| Aspects | Details |
|---|---|
| Study Period | 2019-2033 |
| Base Year | 2024 |
| Estimated Year | 2025 |
| Forecast Period | 2025-2033 |
| Historical Period | 2019-2024 |
| Growth Rate | CAGR of 11.30% from 2019-2033 |
| Segmentation |
|
Table of Contents
- 1. Introduction
- 1.1. Research Scope
- 1.2. Market Segmentation
- 1.3. Research Methodology
- 1.4. Definitions and Assumptions
- 2. Executive Summary
- 2.1. Introduction
- 3. Market Dynamics
- 3.1. Introduction
- 3.2. Market Drivers
- 3.2.1 Increase in Adoption of Information Technology in the Healthcare Sector; Access to Advanced Technology
- 3.2.2 Such as Machine Learning
- 3.2.3 is Easier on Cloud Systems; Usage of Cloud Reduces Cost and Improves Scalability
- 3.2.4 Storage
- 3.2.5 and Flexibility
- 3.3. Market Restrains
- 3.3.1. Data Security and Integrity Issues; Lack of Interoperability and Industry Standards
- 3.4. Market Trends
- 3.4.1. Electronic Health Record (EHR) Segment is Expected to Hold the Largest Market Share Over the Forecast Period
- 4. Market Factor Analysis
- 4.1. Porters Five Forces
- 4.2. Supply/Value Chain
- 4.3. PESTEL analysis
- 4.4. Market Entropy
- 4.5. Patent/Trademark Analysis
- 5. Global Healthcare Cloud Computing Industry Analysis, Insights and Forecast, 2019-2031
- 5.1. Market Analysis, Insights and Forecast - by Application
- 5.1.1. Clinical Information Systems (CIS)
- 5.1.1.1. Electronic Health Record (EHR)
- 5.1.1.2. Picture Archiving and Communication System (PACS)
- 5.1.1.3. Radiology Information Systems (RIS)
- 5.1.1.4. Computerized Physician Order Entry (CPOE)
- 5.1.1.5. Other Applications
- 5.1.2. Non-clinical Information Systems (NCIS)
- 5.1.2.1. Revenue Cycle Management (RCM)
- 5.1.2.2. Automatic Patient Billing (APB)
- 5.1.2.3. Payroll Management System
- 5.1.2.4. Other Non-clinical Information Systems
- 5.1.1. Clinical Information Systems (CIS)
- 5.2. Market Analysis, Insights and Forecast - by Deployment
- 5.2.1. Private Cloud
- 5.2.2. Public Cloud
- 5.3. Market Analysis, Insights and Forecast - by Service
- 5.3.1. Software-as-a-Service (SaaS)
- 5.3.2. Infrastructure-as-a-Service (IaaS)
- 5.3.3. Platform-as-a-Service (PaaS)
- 5.4. Market Analysis, Insights and Forecast - by End User
- 5.4.1. Healthcare Providers
- 5.4.2. Healthcare Payers
- 5.5. Market Analysis, Insights and Forecast - by Region
- 5.5.1. North America
- 5.5.2. Europe
- 5.5.3. Asia Pacific
- 5.5.4. Middle East and Africa
- 5.5.5. South America
- 5.1. Market Analysis, Insights and Forecast - by Application
- 6. North America Healthcare Cloud Computing Industry Analysis, Insights and Forecast, 2019-2031
- 6.1. Market Analysis, Insights and Forecast - by Application
- 6.1.1. Clinical Information Systems (CIS)
- 6.1.1.1. Electronic Health Record (EHR)
- 6.1.1.2. Picture Archiving and Communication System (PACS)
- 6.1.1.3. Radiology Information Systems (RIS)
- 6.1.1.4. Computerized Physician Order Entry (CPOE)
- 6.1.1.5. Other Applications
- 6.1.2. Non-clinical Information Systems (NCIS)
- 6.1.2.1. Revenue Cycle Management (RCM)
- 6.1.2.2. Automatic Patient Billing (APB)
- 6.1.2.3. Payroll Management System
- 6.1.2.4. Other Non-clinical Information Systems
- 6.1.1. Clinical Information Systems (CIS)
- 6.2. Market Analysis, Insights and Forecast - by Deployment
- 6.2.1. Private Cloud
- 6.2.2. Public Cloud
- 6.3. Market Analysis, Insights and Forecast - by Service
- 6.3.1. Software-as-a-Service (SaaS)
- 6.3.2. Infrastructure-as-a-Service (IaaS)
- 6.3.3. Platform-as-a-Service (PaaS)
- 6.4. Market Analysis, Insights and Forecast - by End User
- 6.4.1. Healthcare Providers
- 6.4.2. Healthcare Payers
- 6.1. Market Analysis, Insights and Forecast - by Application
- 7. Europe Healthcare Cloud Computing Industry Analysis, Insights and Forecast, 2019-2031
- 7.1. Market Analysis, Insights and Forecast - by Application
- 7.1.1. Clinical Information Systems (CIS)
- 7.1.1.1. Electronic Health Record (EHR)
- 7.1.1.2. Picture Archiving and Communication System (PACS)
- 7.1.1.3. Radiology Information Systems (RIS)
- 7.1.1.4. Computerized Physician Order Entry (CPOE)
- 7.1.1.5. Other Applications
- 7.1.2. Non-clinical Information Systems (NCIS)
- 7.1.2.1. Revenue Cycle Management (RCM)
- 7.1.2.2. Automatic Patient Billing (APB)
- 7.1.2.3. Payroll Management System
- 7.1.2.4. Other Non-clinical Information Systems
- 7.1.1. Clinical Information Systems (CIS)
- 7.2. Market Analysis, Insights and Forecast - by Deployment
- 7.2.1. Private Cloud
- 7.2.2. Public Cloud
- 7.3. Market Analysis, Insights and Forecast - by Service
- 7.3.1. Software-as-a-Service (SaaS)
- 7.3.2. Infrastructure-as-a-Service (IaaS)
- 7.3.3. Platform-as-a-Service (PaaS)
- 7.4. Market Analysis, Insights and Forecast - by End User
- 7.4.1. Healthcare Providers
- 7.4.2. Healthcare Payers
- 7.1. Market Analysis, Insights and Forecast - by Application
- 8. Asia Pacific Healthcare Cloud Computing Industry Analysis, Insights and Forecast, 2019-2031
- 8.1. Market Analysis, Insights and Forecast - by Application
- 8.1.1. Clinical Information Systems (CIS)
- 8.1.1.1. Electronic Health Record (EHR)
- 8.1.1.2. Picture Archiving and Communication System (PACS)
- 8.1.1.3. Radiology Information Systems (RIS)
- 8.1.1.4. Computerized Physician Order Entry (CPOE)
- 8.1.1.5. Other Applications
- 8.1.2. Non-clinical Information Systems (NCIS)
- 8.1.2.1. Revenue Cycle Management (RCM)
- 8.1.2.2. Automatic Patient Billing (APB)
- 8.1.2.3. Payroll Management System
- 8.1.2.4. Other Non-clinical Information Systems
- 8.1.1. Clinical Information Systems (CIS)
- 8.2. Market Analysis, Insights and Forecast - by Deployment
- 8.2.1. Private Cloud
- 8.2.2. Public Cloud
- 8.3. Market Analysis, Insights and Forecast - by Service
- 8.3.1. Software-as-a-Service (SaaS)
- 8.3.2. Infrastructure-as-a-Service (IaaS)
- 8.3.3. Platform-as-a-Service (PaaS)
- 8.4. Market Analysis, Insights and Forecast - by End User
- 8.4.1. Healthcare Providers
- 8.4.2. Healthcare Payers
- 8.1. Market Analysis, Insights and Forecast - by Application
- 9. Middle East and Africa Healthcare Cloud Computing Industry Analysis, Insights and Forecast, 2019-2031
- 9.1. Market Analysis, Insights and Forecast - by Application
- 9.1.1. Clinical Information Systems (CIS)
- 9.1.1.1. Electronic Health Record (EHR)
- 9.1.1.2. Picture Archiving and Communication System (PACS)
- 9.1.1.3. Radiology Information Systems (RIS)
- 9.1.1.4. Computerized Physician Order Entry (CPOE)
- 9.1.1.5. Other Applications
- 9.1.2. Non-clinical Information Systems (NCIS)
- 9.1.2.1. Revenue Cycle Management (RCM)
- 9.1.2.2. Automatic Patient Billing (APB)
- 9.1.2.3. Payroll Management System
- 9.1.2.4. Other Non-clinical Information Systems
- 9.1.1. Clinical Information Systems (CIS)
- 9.2. Market Analysis, Insights and Forecast - by Deployment
- 9.2.1. Private Cloud
- 9.2.2. Public Cloud
- 9.3. Market Analysis, Insights and Forecast - by Service
- 9.3.1. Software-as-a-Service (SaaS)
- 9.3.2. Infrastructure-as-a-Service (IaaS)
- 9.3.3. Platform-as-a-Service (PaaS)
- 9.4. Market Analysis, Insights and Forecast - by End User
- 9.4.1. Healthcare Providers
- 9.4.2. Healthcare Payers
- 9.1. Market Analysis, Insights and Forecast - by Application
- 10. South America Healthcare Cloud Computing Industry Analysis, Insights and Forecast, 2019-2031
- 10.1. Market Analysis, Insights and Forecast - by Application
- 10.1.1. Clinical Information Systems (CIS)
- 10.1.1.1. Electronic Health Record (EHR)
- 10.1.1.2. Picture Archiving and Communication System (PACS)
- 10.1.1.3. Radiology Information Systems (RIS)
- 10.1.1.4. Computerized Physician Order Entry (CPOE)
- 10.1.1.5. Other Applications
- 10.1.2. Non-clinical Information Systems (NCIS)
- 10.1.2.1. Revenue Cycle Management (RCM)
- 10.1.2.2. Automatic Patient Billing (APB)
- 10.1.2.3. Payroll Management System
- 10.1.2.4. Other Non-clinical Information Systems
- 10.1.1. Clinical Information Systems (CIS)
- 10.2. Market Analysis, Insights and Forecast - by Deployment
- 10.2.1. Private Cloud
- 10.2.2. Public Cloud
- 10.3. Market Analysis, Insights and Forecast - by Service
- 10.3.1. Software-as-a-Service (SaaS)
- 10.3.2. Infrastructure-as-a-Service (IaaS)
- 10.3.3. Platform-as-a-Service (PaaS)
- 10.4. Market Analysis, Insights and Forecast - by End User
- 10.4.1. Healthcare Providers
- 10.4.2. Healthcare Payers
- 10.1. Market Analysis, Insights and Forecast - by Application
- 11. North America Healthcare Cloud Computing Industry Analysis, Insights and Forecast, 2019-2031
- 11.1. Market Analysis, Insights and Forecast - By Country/Sub-region
- 11.1.1 United States
- 11.1.2 Canada
- 11.1.3 Mexico
- 12. Europe Healthcare Cloud Computing Industry Analysis, Insights and Forecast, 2019-2031
- 12.1. Market Analysis, Insights and Forecast - By Country/Sub-region
- 12.1.1 Germany
- 12.1.2 United Kingdom
- 12.1.3 France
- 12.1.4 Italy
- 12.1.5 Spain
- 12.1.6 Rest of Europe
- 13. Asia Pacific Healthcare Cloud Computing Industry Analysis, Insights and Forecast, 2019-2031
- 13.1. Market Analysis, Insights and Forecast - By Country/Sub-region
- 13.1.1 China
- 13.1.2 Japan
- 13.1.3 India
- 13.1.4 Australia
- 13.1.5 South Korea
- 13.1.6 Rest of Asia Pacific
- 14. Middle East and Africa Healthcare Cloud Computing Industry Analysis, Insights and Forecast, 2019-2031
- 14.1. Market Analysis, Insights and Forecast - By Country/Sub-region
- 14.1.1 GCC
- 14.1.2 South Africa
- 14.1.3 Rest of Middle East and Africa
- 15. South America Healthcare Cloud Computing Industry Analysis, Insights and Forecast, 2019-2031
- 15.1. Market Analysis, Insights and Forecast - By Country/Sub-region
- 15.1.1 Brazil
- 15.1.2 Argentina
- 15.1.3 Rest of South America
- 16. Competitive Analysis
- 16.1. Global Market Share Analysis 2024
- 16.2. Company Profiles
- 16.2.1 Siemens Healthcare GmbH
- 16.2.1.1. Overview
- 16.2.1.2. Products
- 16.2.1.3. SWOT Analysis
- 16.2.1.4. Recent Developments
- 16.2.1.5. Financials (Based on Availability)
- 16.2.2 IBM Corporation
- 16.2.2.1. Overview
- 16.2.2.2. Products
- 16.2.2.3. SWOT Analysis
- 16.2.2.4. Recent Developments
- 16.2.2.5. Financials (Based on Availability)
- 16.2.3 Microsoft
- 16.2.3.1. Overview
- 16.2.3.2. Products
- 16.2.3.3. SWOT Analysis
- 16.2.3.4. Recent Developments
- 16.2.3.5. Financials (Based on Availability)
- 16.2.4 e-Zest Solutions
- 16.2.4.1. Overview
- 16.2.4.2. Products
- 16.2.4.3. SWOT Analysis
- 16.2.4.4. Recent Developments
- 16.2.4.5. Financials (Based on Availability)
- 16.2.5 CareCloud Inc
- 16.2.5.1. Overview
- 16.2.5.2. Products
- 16.2.5.3. SWOT Analysis
- 16.2.5.4. Recent Developments
- 16.2.5.5. Financials (Based on Availability)
- 16.2.6 Iron Mountain Incorporated
- 16.2.6.1. Overview
- 16.2.6.2. Products
- 16.2.6.3. SWOT Analysis
- 16.2.6.4. Recent Developments
- 16.2.6.5. Financials (Based on Availability)
- 16.2.7 Dell Inc
- 16.2.7.1. Overview
- 16.2.7.2. Products
- 16.2.7.3. SWOT Analysis
- 16.2.7.4. Recent Developments
- 16.2.7.5. Financials (Based on Availability)
- 16.2.8 Koninklijke Philips NV
- 16.2.8.1. Overview
- 16.2.8.2. Products
- 16.2.8.3. SWOT Analysis
- 16.2.8.4. Recent Developments
- 16.2.8.5. Financials (Based on Availability)
- 16.2.9 Amazon com Inc
- 16.2.9.1. Overview
- 16.2.9.2. Products
- 16.2.9.3. SWOT Analysis
- 16.2.9.4. Recent Developments
- 16.2.9.5. Financials (Based on Availability)
- 16.2.10 ClearDATA
- 16.2.10.1. Overview
- 16.2.10.2. Products
- 16.2.10.3. SWOT Analysis
- 16.2.10.4. Recent Developments
- 16.2.10.5. Financials (Based on Availability)
- 16.2.11 Euris
- 16.2.11.1. Overview
- 16.2.11.2. Products
- 16.2.11.3. SWOT Analysis
- 16.2.11.4. Recent Developments
- 16.2.11.5. Financials (Based on Availability)
- 16.2.12 Oracle
- 16.2.12.1. Overview
- 16.2.12.2. Products
- 16.2.12.3. SWOT Analysis
- 16.2.12.4. Recent Developments
- 16.2.12.5. Financials (Based on Availability)
- 16.2.13 OSP Labs
- 16.2.13.1. Overview
- 16.2.13.2. Products
- 16.2.13.3. SWOT Analysis
- 16.2.13.4. Recent Developments
- 16.2.13.5. Financials (Based on Availability)
- 16.2.14 ZYMR Inc
- 16.2.14.1. Overview
- 16.2.14.2. Products
- 16.2.14.3. SWOT Analysis
- 16.2.14.4. Recent Developments
- 16.2.14.5. Financials (Based on Availability)
- 16.2.15 Athenahealth Inc
- 16.2.15.1. Overview
- 16.2.15.2. Products
- 16.2.15.3. SWOT Analysis
- 16.2.15.4. Recent Developments
- 16.2.15.5. Financials (Based on Availability)
- 16.2.1 Siemens Healthcare GmbH
List of Figures
- Figure 1: Global Healthcare Cloud Computing Industry Revenue Breakdown (Million, %) by Region 2024 & 2032
- Figure 2: Global Healthcare Cloud Computing Industry Volume Breakdown (K Unit, %) by Region 2024 & 2032
- Figure 3: North America Healthcare Cloud Computing Industry Revenue (Million), by Country 2024 & 2032
- Figure 4: North America Healthcare Cloud Computing Industry Volume (K Unit), by Country 2024 & 2032
- Figure 5: North America Healthcare Cloud Computing Industry Revenue Share (%), by Country 2024 & 2032
- Figure 6: North America Healthcare Cloud Computing Industry Volume Share (%), by Country 2024 & 2032
- Figure 7: Europe Healthcare Cloud Computing Industry Revenue (Million), by Country 2024 & 2032
- Figure 8: Europe Healthcare Cloud Computing Industry Volume (K Unit), by Country 2024 & 2032
- Figure 9: Europe Healthcare Cloud Computing Industry Revenue Share (%), by Country 2024 & 2032
- Figure 10: Europe Healthcare Cloud Computing Industry Volume Share (%), by Country 2024 & 2032
- Figure 11: Asia Pacific Healthcare Cloud Computing Industry Revenue (Million), by Country 2024 & 2032
- Figure 12: Asia Pacific Healthcare Cloud Computing Industry Volume (K Unit), by Country 2024 & 2032
- Figure 13: Asia Pacific Healthcare Cloud Computing Industry Revenue Share (%), by Country 2024 & 2032
- Figure 14: Asia Pacific Healthcare Cloud Computing Industry Volume Share (%), by Country 2024 & 2032
- Figure 15: Middle East and Africa Healthcare Cloud Computing Industry Revenue (Million), by Country 2024 & 2032
- Figure 16: Middle East and Africa Healthcare Cloud Computing Industry Volume (K Unit), by Country 2024 & 2032
- Figure 17: Middle East and Africa Healthcare Cloud Computing Industry Revenue Share (%), by Country 2024 & 2032
- Figure 18: Middle East and Africa Healthcare Cloud Computing Industry Volume Share (%), by Country 2024 & 2032
- Figure 19: South America Healthcare Cloud Computing Industry Revenue (Million), by Country 2024 & 2032
- Figure 20: South America Healthcare Cloud Computing Industry Volume (K Unit), by Country 2024 & 2032
- Figure 21: South America Healthcare Cloud Computing Industry Revenue Share (%), by Country 2024 & 2032
- Figure 22: South America Healthcare Cloud Computing Industry Volume Share (%), by Country 2024 & 2032
- Figure 23: North America Healthcare Cloud Computing Industry Revenue (Million), by Application 2024 & 2032
- Figure 24: North America Healthcare Cloud Computing Industry Volume (K Unit), by Application 2024 & 2032
- Figure 25: North America Healthcare Cloud Computing Industry Revenue Share (%), by Application 2024 & 2032
- Figure 26: North America Healthcare Cloud Computing Industry Volume Share (%), by Application 2024 & 2032
- Figure 27: North America Healthcare Cloud Computing Industry Revenue (Million), by Deployment 2024 & 2032
- Figure 28: North America Healthcare Cloud Computing Industry Volume (K Unit), by Deployment 2024 & 2032
- Figure 29: North America Healthcare Cloud Computing Industry Revenue Share (%), by Deployment 2024 & 2032
- Figure 30: North America Healthcare Cloud Computing Industry Volume Share (%), by Deployment 2024 & 2032
- Figure 31: North America Healthcare Cloud Computing Industry Revenue (Million), by Service 2024 & 2032
- Figure 32: North America Healthcare Cloud Computing Industry Volume (K Unit), by Service 2024 & 2032
- Figure 33: North America Healthcare Cloud Computing Industry Revenue Share (%), by Service 2024 & 2032
- Figure 34: North America Healthcare Cloud Computing Industry Volume Share (%), by Service 2024 & 2032
- Figure 35: North America Healthcare Cloud Computing Industry Revenue (Million), by End User 2024 & 2032
- Figure 36: North America Healthcare Cloud Computing Industry Volume (K Unit), by End User 2024 & 2032
- Figure 37: North America Healthcare Cloud Computing Industry Revenue Share (%), by End User 2024 & 2032
- Figure 38: North America Healthcare Cloud Computing Industry Volume Share (%), by End User 2024 & 2032
- Figure 39: North America Healthcare Cloud Computing Industry Revenue (Million), by Country 2024 & 2032
- Figure 40: North America Healthcare Cloud Computing Industry Volume (K Unit), by Country 2024 & 2032
- Figure 41: North America Healthcare Cloud Computing Industry Revenue Share (%), by Country 2024 & 2032
- Figure 42: North America Healthcare Cloud Computing Industry Volume Share (%), by Country 2024 & 2032
- Figure 43: Europe Healthcare Cloud Computing Industry Revenue (Million), by Application 2024 & 2032
- Figure 44: Europe Healthcare Cloud Computing Industry Volume (K Unit), by Application 2024 & 2032
- Figure 45: Europe Healthcare Cloud Computing Industry Revenue Share (%), by Application 2024 & 2032
- Figure 46: Europe Healthcare Cloud Computing Industry Volume Share (%), by Application 2024 & 2032
- Figure 47: Europe Healthcare Cloud Computing Industry Revenue (Million), by Deployment 2024 & 2032
- Figure 48: Europe Healthcare Cloud Computing Industry Volume (K Unit), by Deployment 2024 & 2032
- Figure 49: Europe Healthcare Cloud Computing Industry Revenue Share (%), by Deployment 2024 & 2032
- Figure 50: Europe Healthcare Cloud Computing Industry Volume Share (%), by Deployment 2024 & 2032
- Figure 51: Europe Healthcare Cloud Computing Industry Revenue (Million), by Service 2024 & 2032
- Figure 52: Europe Healthcare Cloud Computing Industry Volume (K Unit), by Service 2024 & 2032
- Figure 53: Europe Healthcare Cloud Computing Industry Revenue Share (%), by Service 2024 & 2032
- Figure 54: Europe Healthcare Cloud Computing Industry Volume Share (%), by Service 2024 & 2032
- Figure 55: Europe Healthcare Cloud Computing Industry Revenue (Million), by End User 2024 & 2032
- Figure 56: Europe Healthcare Cloud Computing Industry Volume (K Unit), by End User 2024 & 2032
- Figure 57: Europe Healthcare Cloud Computing Industry Revenue Share (%), by End User 2024 & 2032
- Figure 58: Europe Healthcare Cloud Computing Industry Volume Share (%), by End User 2024 & 2032
- Figure 59: Europe Healthcare Cloud Computing Industry Revenue (Million), by Country 2024 & 2032
- Figure 60: Europe Healthcare Cloud Computing Industry Volume (K Unit), by Country 2024 & 2032
- Figure 61: Europe Healthcare Cloud Computing Industry Revenue Share (%), by Country 2024 & 2032
- Figure 62: Europe Healthcare Cloud Computing Industry Volume Share (%), by Country 2024 & 2032
- Figure 63: Asia Pacific Healthcare Cloud Computing Industry Revenue (Million), by Application 2024 & 2032
- Figure 64: Asia Pacific Healthcare Cloud Computing Industry Volume (K Unit), by Application 2024 & 2032
- Figure 65: Asia Pacific Healthcare Cloud Computing Industry Revenue Share (%), by Application 2024 & 2032
- Figure 66: Asia Pacific Healthcare Cloud Computing Industry Volume Share (%), by Application 2024 & 2032
- Figure 67: Asia Pacific Healthcare Cloud Computing Industry Revenue (Million), by Deployment 2024 & 2032
- Figure 68: Asia Pacific Healthcare Cloud Computing Industry Volume (K Unit), by Deployment 2024 & 2032
- Figure 69: Asia Pacific Healthcare Cloud Computing Industry Revenue Share (%), by Deployment 2024 & 2032
- Figure 70: Asia Pacific Healthcare Cloud Computing Industry Volume Share (%), by Deployment 2024 & 2032
- Figure 71: Asia Pacific Healthcare Cloud Computing Industry Revenue (Million), by Service 2024 & 2032
- Figure 72: Asia Pacific Healthcare Cloud Computing Industry Volume (K Unit), by Service 2024 & 2032
- Figure 73: Asia Pacific Healthcare Cloud Computing Industry Revenue Share (%), by Service 2024 & 2032
- Figure 74: Asia Pacific Healthcare Cloud Computing Industry Volume Share (%), by Service 2024 & 2032
- Figure 75: Asia Pacific Healthcare Cloud Computing Industry Revenue (Million), by End User 2024 & 2032
- Figure 76: Asia Pacific Healthcare Cloud Computing Industry Volume (K Unit), by End User 2024 & 2032
- Figure 77: Asia Pacific Healthcare Cloud Computing Industry Revenue Share (%), by End User 2024 & 2032
- Figure 78: Asia Pacific Healthcare Cloud Computing Industry Volume Share (%), by End User 2024 & 2032
- Figure 79: Asia Pacific Healthcare Cloud Computing Industry Revenue (Million), by Country 2024 & 2032
- Figure 80: Asia Pacific Healthcare Cloud Computing Industry Volume (K Unit), by Country 2024 & 2032
- Figure 81: Asia Pacific Healthcare Cloud Computing Industry Revenue Share (%), by Country 2024 & 2032
- Figure 82: Asia Pacific Healthcare Cloud Computing Industry Volume Share (%), by Country 2024 & 2032
- Figure 83: Middle East and Africa Healthcare Cloud Computing Industry Revenue (Million), by Application 2024 & 2032
- Figure 84: Middle East and Africa Healthcare Cloud Computing Industry Volume (K Unit), by Application 2024 & 2032
- Figure 85: Middle East and Africa Healthcare Cloud Computing Industry Revenue Share (%), by Application 2024 & 2032
- Figure 86: Middle East and Africa Healthcare Cloud Computing Industry Volume Share (%), by Application 2024 & 2032
- Figure 87: Middle East and Africa Healthcare Cloud Computing Industry Revenue (Million), by Deployment 2024 & 2032
- Figure 88: Middle East and Africa Healthcare Cloud Computing Industry Volume (K Unit), by Deployment 2024 & 2032
- Figure 89: Middle East and Africa Healthcare Cloud Computing Industry Revenue Share (%), by Deployment 2024 & 2032
- Figure 90: Middle East and Africa Healthcare Cloud Computing Industry Volume Share (%), by Deployment 2024 & 2032
- Figure 91: Middle East and Africa Healthcare Cloud Computing Industry Revenue (Million), by Service 2024 & 2032
- Figure 92: Middle East and Africa Healthcare Cloud Computing Industry Volume (K Unit), by Service 2024 & 2032
- Figure 93: Middle East and Africa Healthcare Cloud Computing Industry Revenue Share (%), by Service 2024 & 2032
- Figure 94: Middle East and Africa Healthcare Cloud Computing Industry Volume Share (%), by Service 2024 & 2032
- Figure 95: Middle East and Africa Healthcare Cloud Computing Industry Revenue (Million), by End User 2024 & 2032
- Figure 96: Middle East and Africa Healthcare Cloud Computing Industry Volume (K Unit), by End User 2024 & 2032
- Figure 97: Middle East and Africa Healthcare Cloud Computing Industry Revenue Share (%), by End User 2024 & 2032
- Figure 98: Middle East and Africa Healthcare Cloud Computing Industry Volume Share (%), by End User 2024 & 2032
- Figure 99: Middle East and Africa Healthcare Cloud Computing Industry Revenue (Million), by Country 2024 & 2032
- Figure 100: Middle East and Africa Healthcare Cloud Computing Industry Volume (K Unit), by Country 2024 & 2032
- Figure 101: Middle East and Africa Healthcare Cloud Computing Industry Revenue Share (%), by Country 2024 & 2032
- Figure 102: Middle East and Africa Healthcare Cloud Computing Industry Volume Share (%), by Country 2024 & 2032
- Figure 103: South America Healthcare Cloud Computing Industry Revenue (Million), by Application 2024 & 2032
- Figure 104: South America Healthcare Cloud Computing Industry Volume (K Unit), by Application 2024 & 2032
- Figure 105: South America Healthcare Cloud Computing Industry Revenue Share (%), by Application 2024 & 2032
- Figure 106: South America Healthcare Cloud Computing Industry Volume Share (%), by Application 2024 & 2032
- Figure 107: South America Healthcare Cloud Computing Industry Revenue (Million), by Deployment 2024 & 2032
- Figure 108: South America Healthcare Cloud Computing Industry Volume (K Unit), by Deployment 2024 & 2032
- Figure 109: South America Healthcare Cloud Computing Industry Revenue Share (%), by Deployment 2024 & 2032
- Figure 110: South America Healthcare Cloud Computing Industry Volume Share (%), by Deployment 2024 & 2032
- Figure 111: South America Healthcare Cloud Computing Industry Revenue (Million), by Service 2024 & 2032
- Figure 112: South America Healthcare Cloud Computing Industry Volume (K Unit), by Service 2024 & 2032
- Figure 113: South America Healthcare Cloud Computing Industry Revenue Share (%), by Service 2024 & 2032
- Figure 114: South America Healthcare Cloud Computing Industry Volume Share (%), by Service 2024 & 2032
- Figure 115: South America Healthcare Cloud Computing Industry Revenue (Million), by End User 2024 & 2032
- Figure 116: South America Healthcare Cloud Computing Industry Volume (K Unit), by End User 2024 & 2032
- Figure 117: South America Healthcare Cloud Computing Industry Revenue Share (%), by End User 2024 & 2032
- Figure 118: South America Healthcare Cloud Computing Industry Volume Share (%), by End User 2024 & 2032
- Figure 119: South America Healthcare Cloud Computing Industry Revenue (Million), by Country 2024 & 2032
- Figure 120: South America Healthcare Cloud Computing Industry Volume (K Unit), by Country 2024 & 2032
- Figure 121: South America Healthcare Cloud Computing Industry Revenue Share (%), by Country 2024 & 2032
- Figure 122: South America Healthcare Cloud Computing Industry Volume Share (%), by Country 2024 & 2032
List of Tables
- Table 1: Global Healthcare Cloud Computing Industry Revenue Million Forecast, by Region 2019 & 2032
- Table 2: Global Healthcare Cloud Computing Industry Volume K Unit Forecast, by Region 2019 & 2032
- Table 3: Global Healthcare Cloud Computing Industry Revenue Million Forecast, by Application 2019 & 2032
- Table 4: Global Healthcare Cloud Computing Industry Volume K Unit Forecast, by Application 2019 & 2032
- Table 5: Global Healthcare Cloud Computing Industry Revenue Million Forecast, by Deployment 2019 & 2032
- Table 6: Global Healthcare Cloud Computing Industry Volume K Unit Forecast, by Deployment 2019 & 2032
- Table 7: Global Healthcare Cloud Computing Industry Revenue Million Forecast, by Service 2019 & 2032
- Table 8: Global Healthcare Cloud Computing Industry Volume K Unit Forecast, by Service 2019 & 2032
- Table 9: Global Healthcare Cloud Computing Industry Revenue Million Forecast, by End User 2019 & 2032
- Table 10: Global Healthcare Cloud Computing Industry Volume K Unit Forecast, by End User 2019 & 2032
- Table 11: Global Healthcare Cloud Computing Industry Revenue Million Forecast, by Region 2019 & 2032
- Table 12: Global Healthcare Cloud Computing Industry Volume K Unit Forecast, by Region 2019 & 2032
- Table 13: Global Healthcare Cloud Computing Industry Revenue Million Forecast, by Country 2019 & 2032
- Table 14: Global Healthcare Cloud Computing Industry Volume K Unit Forecast, by Country 2019 & 2032
- Table 15: United States Healthcare Cloud Computing Industry Revenue (Million) Forecast, by Application 2019 & 2032
- Table 16: United States Healthcare Cloud Computing Industry Volume (K Unit) Forecast, by Application 2019 & 2032
- Table 17: Canada Healthcare Cloud Computing Industry Revenue (Million) Forecast, by Application 2019 & 2032
- Table 18: Canada Healthcare Cloud Computing Industry Volume (K Unit) Forecast, by Application 2019 & 2032
- Table 19: Mexico Healthcare Cloud Computing Industry Revenue (Million) Forecast, by Application 2019 & 2032
- Table 20: Mexico Healthcare Cloud Computing Industry Volume (K Unit) Forecast, by Application 2019 & 2032
- Table 21: Global Healthcare Cloud Computing Industry Revenue Million Forecast, by Country 2019 & 2032
- Table 22: Global Healthcare Cloud Computing Industry Volume K Unit Forecast, by Country 2019 & 2032
- Table 23: Germany Healthcare Cloud Computing Industry Revenue (Million) Forecast, by Application 2019 & 2032
- Table 24: Germany Healthcare Cloud Computing Industry Volume (K Unit) Forecast, by Application 2019 & 2032
- Table 25: United Kingdom Healthcare Cloud Computing Industry Revenue (Million) Forecast, by Application 2019 & 2032
- Table 26: United Kingdom Healthcare Cloud Computing Industry Volume (K Unit) Forecast, by Application 2019 & 2032
- Table 27: France Healthcare Cloud Computing Industry Revenue (Million) Forecast, by Application 2019 & 2032
- Table 28: France Healthcare Cloud Computing Industry Volume (K Unit) Forecast, by Application 2019 & 2032
- Table 29: Italy Healthcare Cloud Computing Industry Revenue (Million) Forecast, by Application 2019 & 2032
- Table 30: Italy Healthcare Cloud Computing Industry Volume (K Unit) Forecast, by Application 2019 & 2032
- Table 31: Spain Healthcare Cloud Computing Industry Revenue (Million) Forecast, by Application 2019 & 2032
- Table 32: Spain Healthcare Cloud Computing Industry Volume (K Unit) Forecast, by Application 2019 & 2032
- Table 33: Rest of Europe Healthcare Cloud Computing Industry Revenue (Million) Forecast, by Application 2019 & 2032
- Table 34: Rest of Europe Healthcare Cloud Computing Industry Volume (K Unit) Forecast, by Application 2019 & 2032
- Table 35: Global Healthcare Cloud Computing Industry Revenue Million Forecast, by Country 2019 & 2032
- Table 36: Global Healthcare Cloud Computing Industry Volume K Unit Forecast, by Country 2019 & 2032
- Table 37: China Healthcare Cloud Computing Industry Revenue (Million) Forecast, by Application 2019 & 2032
- Table 38: China Healthcare Cloud Computing Industry Volume (K Unit) Forecast, by Application 2019 & 2032
- Table 39: Japan Healthcare Cloud Computing Industry Revenue (Million) Forecast, by Application 2019 & 2032
- Table 40: Japan Healthcare Cloud Computing Industry Volume (K Unit) Forecast, by Application 2019 & 2032
- Table 41: India Healthcare Cloud Computing Industry Revenue (Million) Forecast, by Application 2019 & 2032
- Table 42: India Healthcare Cloud Computing Industry Volume (K Unit) Forecast, by Application 2019 & 2032
- Table 43: Australia Healthcare Cloud Computing Industry Revenue (Million) Forecast, by Application 2019 & 2032
- Table 44: Australia Healthcare Cloud Computing Industry Volume (K Unit) Forecast, by Application 2019 & 2032
- Table 45: South Korea Healthcare Cloud Computing Industry Revenue (Million) Forecast, by Application 2019 & 2032
- Table 46: South Korea Healthcare Cloud Computing Industry Volume (K Unit) Forecast, by Application 2019 & 2032
- Table 47: Rest of Asia Pacific Healthcare Cloud Computing Industry Revenue (Million) Forecast, by Application 2019 & 2032
- Table 48: Rest of Asia Pacific Healthcare Cloud Computing Industry Volume (K Unit) Forecast, by Application 2019 & 2032
- Table 49: Global Healthcare Cloud Computing Industry Revenue Million Forecast, by Country 2019 & 2032
- Table 50: Global Healthcare Cloud Computing Industry Volume K Unit Forecast, by Country 2019 & 2032
- Table 51: GCC Healthcare Cloud Computing Industry Revenue (Million) Forecast, by Application 2019 & 2032
- Table 52: GCC Healthcare Cloud Computing Industry Volume (K Unit) Forecast, by Application 2019 & 2032
- Table 53: South Africa Healthcare Cloud Computing Industry Revenue (Million) Forecast, by Application 2019 & 2032
- Table 54: South Africa Healthcare Cloud Computing Industry Volume (K Unit) Forecast, by Application 2019 & 2032
- Table 55: Rest of Middle East and Africa Healthcare Cloud Computing Industry Revenue (Million) Forecast, by Application 2019 & 2032
- Table 56: Rest of Middle East and Africa Healthcare Cloud Computing Industry Volume (K Unit) Forecast, by Application 2019 & 2032
- Table 57: Global Healthcare Cloud Computing Industry Revenue Million Forecast, by Country 2019 & 2032
- Table 58: Global Healthcare Cloud Computing Industry Volume K Unit Forecast, by Country 2019 & 2032
- Table 59: Brazil Healthcare Cloud Computing Industry Revenue (Million) Forecast, by Application 2019 & 2032
- Table 60: Brazil Healthcare Cloud Computing Industry Volume (K Unit) Forecast, by Application 2019 & 2032
- Table 61: Argentina Healthcare Cloud Computing Industry Revenue (Million) Forecast, by Application 2019 & 2032
- Table 62: Argentina Healthcare Cloud Computing Industry Volume (K Unit) Forecast, by Application 2019 & 2032
- Table 63: Rest of South America Healthcare Cloud Computing Industry Revenue (Million) Forecast, by Application 2019 & 2032
- Table 64: Rest of South America Healthcare Cloud Computing Industry Volume (K Unit) Forecast, by Application 2019 & 2032
- Table 65: Global Healthcare Cloud Computing Industry Revenue Million Forecast, by Application 2019 & 2032
- Table 66: Global Healthcare Cloud Computing Industry Volume K Unit Forecast, by Application 2019 & 2032
- Table 67: Global Healthcare Cloud Computing Industry Revenue Million Forecast, by Deployment 2019 & 2032
- Table 68: Global Healthcare Cloud Computing Industry Volume K Unit Forecast, by Deployment 2019 & 2032
- Table 69: Global Healthcare Cloud Computing Industry Revenue Million Forecast, by Service 2019 & 2032
- Table 70: Global Healthcare Cloud Computing Industry Volume K Unit Forecast, by Service 2019 & 2032
- Table 71: Global Healthcare Cloud Computing Industry Revenue Million Forecast, by End User 2019 & 2032
- Table 72: Global Healthcare Cloud Computing Industry Volume K Unit Forecast, by End User 2019 & 2032
- Table 73: Global Healthcare Cloud Computing Industry Revenue Million Forecast, by Country 2019 & 2032
- Table 74: Global Healthcare Cloud Computing Industry Volume K Unit Forecast, by Country 2019 & 2032
- Table 75: United States Healthcare Cloud Computing Industry Revenue (Million) Forecast, by Application 2019 & 2032
- Table 76: United States Healthcare Cloud Computing Industry Volume (K Unit) Forecast, by Application 2019 & 2032
- Table 77: Canada Healthcare Cloud Computing Industry Revenue (Million) Forecast, by Application 2019 & 2032
- Table 78: Canada Healthcare Cloud Computing Industry Volume (K Unit) Forecast, by Application 2019 & 2032
- Table 79: Mexico Healthcare Cloud Computing Industry Revenue (Million) Forecast, by Application 2019 & 2032
- Table 80: Mexico Healthcare Cloud Computing Industry Volume (K Unit) Forecast, by Application 2019 & 2032
- Table 81: Global Healthcare Cloud Computing Industry Revenue Million Forecast, by Application 2019 & 2032
- Table 82: Global Healthcare Cloud Computing Industry Volume K Unit Forecast, by Application 2019 & 2032
- Table 83: Global Healthcare Cloud Computing Industry Revenue Million Forecast, by Deployment 2019 & 2032
- Table 84: Global Healthcare Cloud Computing Industry Volume K Unit Forecast, by Deployment 2019 & 2032
- Table 85: Global Healthcare Cloud Computing Industry Revenue Million Forecast, by Service 2019 & 2032
- Table 86: Global Healthcare Cloud Computing Industry Volume K Unit Forecast, by Service 2019 & 2032
- Table 87: Global Healthcare Cloud Computing Industry Revenue Million Forecast, by End User 2019 & 2032
- Table 88: Global Healthcare Cloud Computing Industry Volume K Unit Forecast, by End User 2019 & 2032
- Table 89: Global Healthcare Cloud Computing Industry Revenue Million Forecast, by Country 2019 & 2032
- Table 90: Global Healthcare Cloud Computing Industry Volume K Unit Forecast, by Country 2019 & 2032
- Table 91: Germany Healthcare Cloud Computing Industry Revenue (Million) Forecast, by Application 2019 & 2032
- Table 92: Germany Healthcare Cloud Computing Industry Volume (K Unit) Forecast, by Application 2019 & 2032
- Table 93: United Kingdom Healthcare Cloud Computing Industry Revenue (Million) Forecast, by Application 2019 & 2032
- Table 94: United Kingdom Healthcare Cloud Computing Industry Volume (K Unit) Forecast, by Application 2019 & 2032
- Table 95: France Healthcare Cloud Computing Industry Revenue (Million) Forecast, by Application 2019 & 2032
- Table 96: France Healthcare Cloud Computing Industry Volume (K Unit) Forecast, by Application 2019 & 2032
- Table 97: Italy Healthcare Cloud Computing Industry Revenue (Million) Forecast, by Application 2019 & 2032
- Table 98: Italy Healthcare Cloud Computing Industry Volume (K Unit) Forecast, by Application 2019 & 2032
- Table 99: Spain Healthcare Cloud Computing Industry Revenue (Million) Forecast, by Application 2019 & 2032
- Table 100: Spain Healthcare Cloud Computing Industry Volume (K Unit) Forecast, by Application 2019 & 2032
- Table 101: Rest of Europe Healthcare Cloud Computing Industry Revenue (Million) Forecast, by Application 2019 & 2032
- Table 102: Rest of Europe Healthcare Cloud Computing Industry Volume (K Unit) Forecast, by Application 2019 & 2032
- Table 103: Global Healthcare Cloud Computing Industry Revenue Million Forecast, by Application 2019 & 2032
- Table 104: Global Healthcare Cloud Computing Industry Volume K Unit Forecast, by Application 2019 & 2032
- Table 105: Global Healthcare Cloud Computing Industry Revenue Million Forecast, by Deployment 2019 & 2032
- Table 106: Global Healthcare Cloud Computing Industry Volume K Unit Forecast, by Deployment 2019 & 2032
- Table 107: Global Healthcare Cloud Computing Industry Revenue Million Forecast, by Service 2019 & 2032
- Table 108: Global Healthcare Cloud Computing Industry Volume K Unit Forecast, by Service 2019 & 2032
- Table 109: Global Healthcare Cloud Computing Industry Revenue Million Forecast, by End User 2019 & 2032
- Table 110: Global Healthcare Cloud Computing Industry Volume K Unit Forecast, by End User 2019 & 2032
- Table 111: Global Healthcare Cloud Computing Industry Revenue Million Forecast, by Country 2019 & 2032
- Table 112: Global Healthcare Cloud Computing Industry Volume K Unit Forecast, by Country 2019 & 2032
- Table 113: China Healthcare Cloud Computing Industry Revenue (Million) Forecast, by Application 2019 & 2032
- Table 114: China Healthcare Cloud Computing Industry Volume (K Unit) Forecast, by Application 2019 & 2032
- Table 115: Japan Healthcare Cloud Computing Industry Revenue (Million) Forecast, by Application 2019 & 2032
- Table 116: Japan Healthcare Cloud Computing Industry Volume (K Unit) Forecast, by Application 2019 & 2032
- Table 117: India Healthcare Cloud Computing Industry Revenue (Million) Forecast, by Application 2019 & 2032
- Table 118: India Healthcare Cloud Computing Industry Volume (K Unit) Forecast, by Application 2019 & 2032
- Table 119: Australia Healthcare Cloud Computing Industry Revenue (Million) Forecast, by Application 2019 & 2032
- Table 120: Australia Healthcare Cloud Computing Industry Volume (K Unit) Forecast, by Application 2019 & 2032
- Table 121: South Korea Healthcare Cloud Computing Industry Revenue (Million) Forecast, by Application 2019 & 2032
- Table 122: South Korea Healthcare Cloud Computing Industry Volume (K Unit) Forecast, by Application 2019 & 2032
- Table 123: Rest of Asia Pacific Healthcare Cloud Computing Industry Revenue (Million) Forecast, by Application 2019 & 2032
- Table 124: Rest of Asia Pacific Healthcare Cloud Computing Industry Volume (K Unit) Forecast, by Application 2019 & 2032
- Table 125: Global Healthcare Cloud Computing Industry Revenue Million Forecast, by Application 2019 & 2032
- Table 126: Global Healthcare Cloud Computing Industry Volume K Unit Forecast, by Application 2019 & 2032
- Table 127: Global Healthcare Cloud Computing Industry Revenue Million Forecast, by Deployment 2019 & 2032
- Table 128: Global Healthcare Cloud Computing Industry Volume K Unit Forecast, by Deployment 2019 & 2032
- Table 129: Global Healthcare Cloud Computing Industry Revenue Million Forecast, by Service 2019 & 2032
- Table 130: Global Healthcare Cloud Computing Industry Volume K Unit Forecast, by Service 2019 & 2032
- Table 131: Global Healthcare Cloud Computing Industry Revenue Million Forecast, by End User 2019 & 2032
- Table 132: Global Healthcare Cloud Computing Industry Volume K Unit Forecast, by End User 2019 & 2032
- Table 133: Global Healthcare Cloud Computing Industry Revenue Million Forecast, by Country 2019 & 2032
- Table 134: Global Healthcare Cloud Computing Industry Volume K Unit Forecast, by Country 2019 & 2032
- Table 135: GCC Healthcare Cloud Computing Industry Revenue (Million) Forecast, by Application 2019 & 2032
- Table 136: GCC Healthcare Cloud Computing Industry Volume (K Unit) Forecast, by Application 2019 & 2032
- Table 137: South Africa Healthcare Cloud Computing Industry Revenue (Million) Forecast, by Application 2019 & 2032
- Table 138: South Africa Healthcare Cloud Computing Industry Volume (K Unit) Forecast, by Application 2019 & 2032
- Table 139: Rest of Middle East and Africa Healthcare Cloud Computing Industry Revenue (Million) Forecast, by Application 2019 & 2032
- Table 140: Rest of Middle East and Africa Healthcare Cloud Computing Industry Volume (K Unit) Forecast, by Application 2019 & 2032
- Table 141: Global Healthcare Cloud Computing Industry Revenue Million Forecast, by Application 2019 & 2032
- Table 142: Global Healthcare Cloud Computing Industry Volume K Unit Forecast, by Application 2019 & 2032
- Table 143: Global Healthcare Cloud Computing Industry Revenue Million Forecast, by Deployment 2019 & 2032
- Table 144: Global Healthcare Cloud Computing Industry Volume K Unit Forecast, by Deployment 2019 & 2032
- Table 145: Global Healthcare Cloud Computing Industry Revenue Million Forecast, by Service 2019 & 2032
- Table 146: Global Healthcare Cloud Computing Industry Volume K Unit Forecast, by Service 2019 & 2032
- Table 147: Global Healthcare Cloud Computing Industry Revenue Million Forecast, by End User 2019 & 2032
- Table 148: Global Healthcare Cloud Computing Industry Volume K Unit Forecast, by End User 2019 & 2032
- Table 149: Global Healthcare Cloud Computing Industry Revenue Million Forecast, by Country 2019 & 2032
- Table 150: Global Healthcare Cloud Computing Industry Volume K Unit Forecast, by Country 2019 & 2032
- Table 151: Brazil Healthcare Cloud Computing Industry Revenue (Million) Forecast, by Application 2019 & 2032
- Table 152: Brazil Healthcare Cloud Computing Industry Volume (K Unit) Forecast, by Application 2019 & 2032
- Table 153: Argentina Healthcare Cloud Computing Industry Revenue (Million) Forecast, by Application 2019 & 2032
- Table 154: Argentina Healthcare Cloud Computing Industry Volume (K Unit) Forecast, by Application 2019 & 2032
- Table 155: Rest of South America Healthcare Cloud Computing Industry Revenue (Million) Forecast, by Application 2019 & 2032
- Table 156: Rest of South America Healthcare Cloud Computing Industry Volume (K Unit) Forecast, by Application 2019 & 2032
Frequently Asked Questions
1. What is the projected Compound Annual Growth Rate (CAGR) of the Healthcare Cloud Computing Industry?
The projected CAGR is approximately 11.30%.
2. Which companies are prominent players in the Healthcare Cloud Computing Industry?
Key companies in the market include Siemens Healthcare GmbH, IBM Corporation, Microsoft, e-Zest Solutions, CareCloud Inc, Iron Mountain Incorporated, Dell Inc, Koninklijke Philips NV, Amazon com Inc, ClearDATA, Euris, Oracle, OSP Labs, ZYMR Inc, Athenahealth Inc.
3. What are the main segments of the Healthcare Cloud Computing Industry?
The market segments include Application, Deployment, Service, End User.
4. Can you provide details about the market size?
The market size is estimated to be USD 49.14 Million as of 2022.
5. What are some drivers contributing to market growth?
Increase in Adoption of Information Technology in the Healthcare Sector; Access to Advanced Technology. Such as Machine Learning. is Easier on Cloud Systems; Usage of Cloud Reduces Cost and Improves Scalability. Storage. and Flexibility.
6. What are the notable trends driving market growth?
Electronic Health Record (EHR) Segment is Expected to Hold the Largest Market Share Over the Forecast Period.
7. Are there any restraints impacting market growth?
Data Security and Integrity Issues; Lack of Interoperability and Industry Standards.
8. Can you provide examples of recent developments in the market?
In November 2022, Wipro Ltd partnered with the United States-based cloud computing service provider VMware. The partnership will see Wipro maintain a VMware business unit to offer its clients the latter's platform as a service. Wipro is training up to 5,000 professionals in VMware's cross-cloud services, which will offer multi-cloud enterprise tools and focus on sectors such as banking, financial services and insurance (BFSI), healthcare, and consumer and retail services, as per the statement.
9. What pricing options are available for accessing the report?
Pricing options include single-user, multi-user, and enterprise licenses priced at USD 4750, USD 5250, and USD 8750 respectively.
10. Is the market size provided in terms of value or volume?
The market size is provided in terms of value, measured in Million and volume, measured in K Unit.
11. Are there any specific market keywords associated with the report?
Yes, the market keyword associated with the report is "Healthcare Cloud Computing Industry," which aids in identifying and referencing the specific market segment covered.
12. How do I determine which pricing option suits my needs best?
The pricing options vary based on user requirements and access needs. Individual users may opt for single-user licenses, while businesses requiring broader access may choose multi-user or enterprise licenses for cost-effective access to the report.
13. Are there any additional resources or data provided in the Healthcare Cloud Computing Industry report?
While the report offers comprehensive insights, it's advisable to review the specific contents or supplementary materials provided to ascertain if additional resources or data are available.
14. How can I stay updated on further developments or reports in the Healthcare Cloud Computing Industry?
To stay informed about further developments, trends, and reports in the Healthcare Cloud Computing Industry, consider subscribing to industry newsletters, following relevant companies and organizations, or regularly checking reputable industry news sources and publications.
Methodology
Step 1 - Identification of Relevant Samples Size from Population Database


Step 2 - Approaches for Defining Global Market Size (Value, Volume* & Price*)

Note*: In applicable scenarios
Step 3 - Data Sources
Primary Research
- Web Analytics
- Survey Reports
- Research Institute
- Latest Research Reports
- Opinion Leaders
Secondary Research
- Annual Reports
- White Paper
- Latest Press Release
- Industry Association
- Paid Database
- Investor Presentations

Step 4 - Data Triangulation
Involves using different sources of information in order to increase the validity of a study
These sources are likely to be stakeholders in a program - participants, other researchers, program staff, other community members, and so on.
Then we put all data in single framework & apply various statistical tools to find out the dynamic on the market.
During the analysis stage, feedback from the stakeholder groups would be compared to determine areas of agreement as well as areas of divergence
